

In the contemporary digital landscape, most marketing teams are not suffering from a lack of data—they are suffering from an excess of it. We live in an era of "dashboard fatigue," where marketers are often drowning in metrics yet starving for actionable insights. If your team treats analytics as a post-campaign afterthought, you are likely operating at a significant disadvantage.
The reality is that effective Conversion Rate Optimization (CRO) measurement is not a reactive process; it is a foundational one. It begins long before the first A/B test is launched. This guide explores how to pivot from a state of reactive guesswork to a proactive, data-driven workflow that fuels sustainable growth.
Defining Success: Beyond Vanity Metrics
In the world of CRO, there is a dangerous tendency to celebrate "wins" that fail to move the needle on revenue. Before analyzing a single heatmap or session recording, you must define what success looks like for your specific business model.
The Pitfall of Vague KPIs
Many organizations fall into the trap of setting generic goals, such as "improve conversion rate" or "generate more leads." These are not goals; they are vague desires. A true, outcome-focused goal is specific, measurable, and tied to the bottom line. For example, instead of "get more leads," a focused goal might be "increase the conversion rate of top-of-funnel prospects into Marketing Qualified Leads (MQLs) by 15% over the next quarter."
By aligning your CRO goals with your sales stages, you can work backward. If you know that 10% of your qualified leads typically convert into paying customers, and your quarterly target is 100 new customers, you can mathematically derive the exact volume of leads required. This transforms CRO from an abstract design project into a calculated revenue engine.

The Power of Micro-Conversions
Tracking only macro-conversions—like a completed purchase or a signed contract—is akin to a baseball scout only tracking home runs. You miss the singles, doubles, and base hits that signal momentum. Micro-conversions, such as watching a product demo video, clicking a pricing link, or downloading a case study, provide early indicators of intent.
By monitoring these micro-interactions, you can identify friction points in the user journey long before they result in a lost sale. If your data shows that users are engaging with your demo video but abandoning the subsequent form, you have uncovered a specific point of friction—likely a disconnect between the promise of the video and the complexity of the lead form.
Mastering the Funnel: Where Data Meets Reality
Once your goals are set, the focus must shift to the structure of your conversion path. Think of your website as a bucket; your job is to identify the leaks.
Funnel Analysis and Segmentation
Funnel reports are your diagnostic tools. By tracking each step of the user journey—from landing page view to checkout—you can isolate exactly where your conversion rates plummet. A sudden 40% drop-off between your features page and your pricing page is a massive red flag that suggests your value proposition is failing to justify the cost at that critical moment.
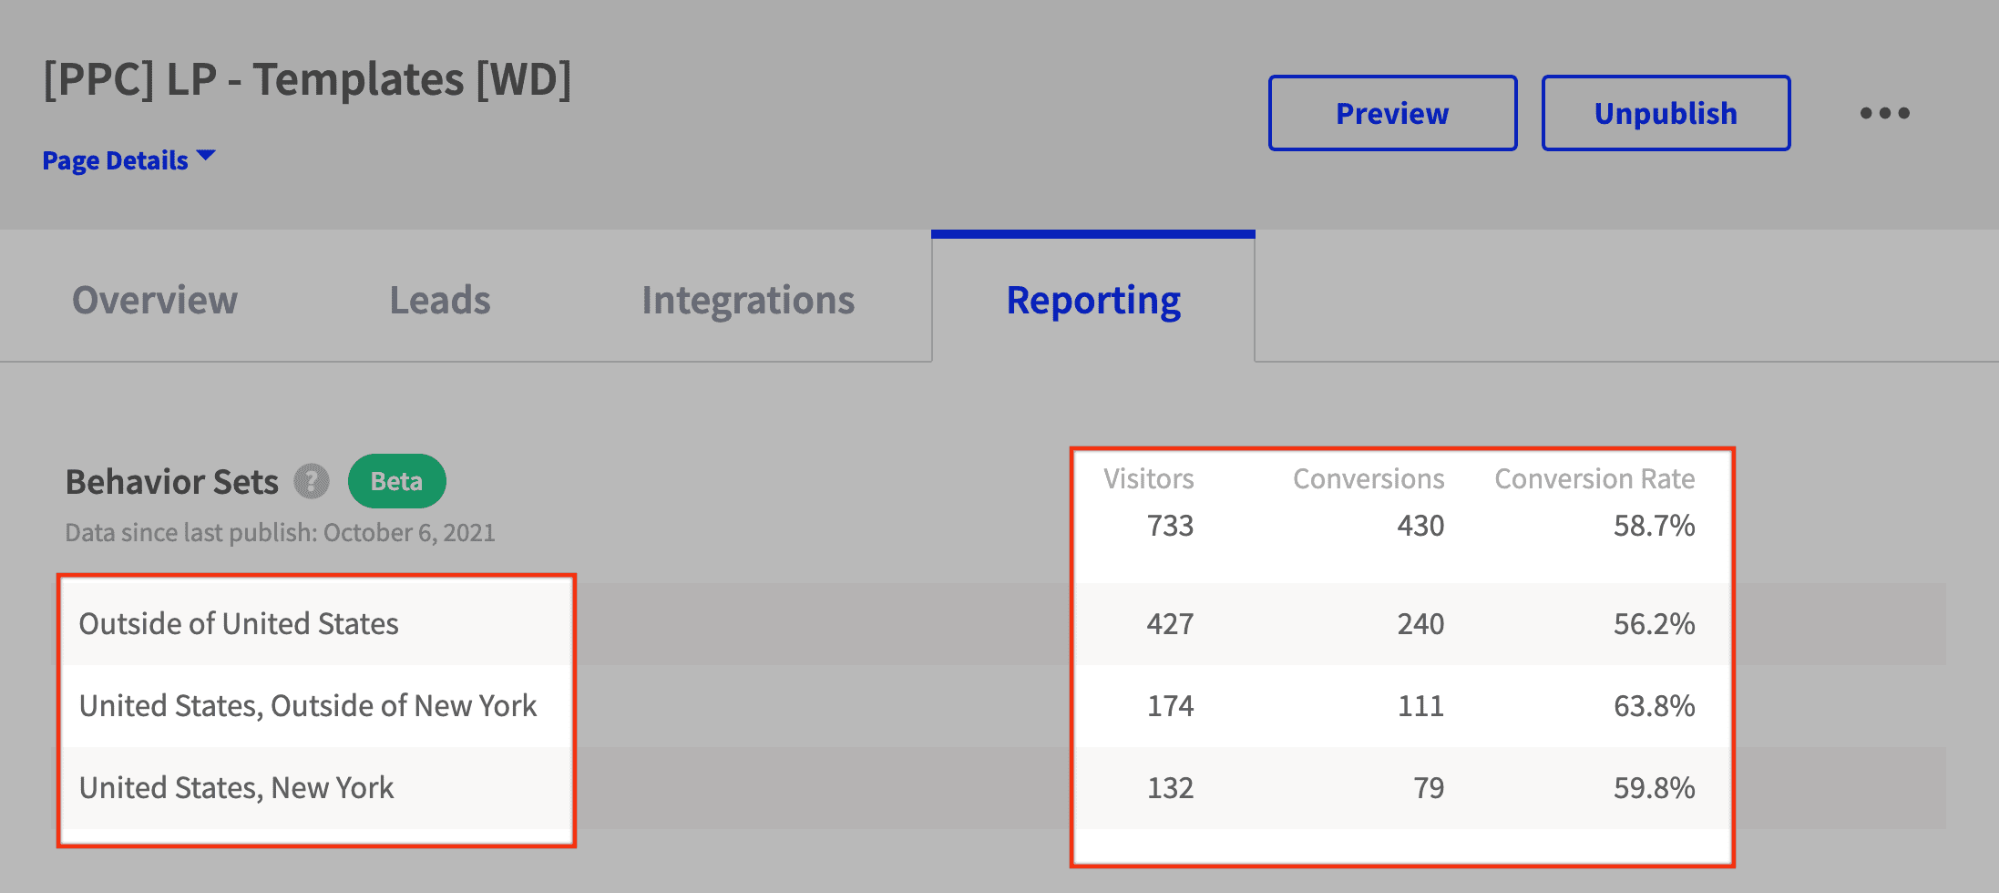
However, aggregate data can be deceptive. A high bounce rate might indicate a poor user experience, or it might simply mean that a user found the exact information they needed and left satisfied. To gain clarity, you must segment your data by traffic source, device, and user intent. For instance, recent industry benchmarks show that while 83% of landing page traffic arrives via mobile, desktop environments often yield an 8% higher conversion rate. Without device-specific segmentation, you would be unable to tailor your mobile experience to bridge that gap.

Filtering Out the Noise
Standard analytics platforms often present a buffet of data that can lead to "analysis paralysis." The key is to ignore vanity metrics—like total page views or social media engagement—and focus on metrics that correlate with business growth. Ruthless segmentation is your best defense against misleading data. By filtering your reports to look at "Returning Visitors" versus "First-time Visitors," you can understand how different audiences interact with your brand, allowing for more personalized optimization strategies.
Qualitative Context: Understanding the "Why"
Quantitative data tells you what is happening, but it rarely explains why. To bridge this gap, you must integrate qualitative research into your workflow.
Heatmaps and Session Recordings
Heatmaps allow you to visualize visitor behavior at scale. If users are repeatedly clicking on non-clickable elements, they are signaling a design flaw. Similarly, session recordings provide a "fly-on-the-wall" perspective of the user experience. Watching a user struggle with an unresponsive button or a confusing form field is far more persuasive to stakeholders than a spreadsheet of conversion percentages.
Voice-of-Customer (VoC) Insights
Surveys are your direct line to the user’s psyche. By implementing short, context-aware surveys on high-drop-off pages, you can ask direct questions: "What was missing from this page?" or "What is preventing you from signing up today?" These insights often reveal "low-hanging fruit"—simple copy changes or feature clarifications—that can result in immediate, significant boosts to your conversion rates.
Building a Culture of Experimentation
The most successful companies do not treat CRO as a one-time project. They build a "culture of experimentation" where testing is a continuous, habitual process.
The Hypothesis-Driven Workflow
A valid hypothesis must be grounded in data. Use the following formula: "Because we observed [data insight], if we [make this specific change], then [this outcome] will occur." This removes the subjectivity from the process. Instead of "let’s try a red button," you are testing a specific theory based on observed user behavior.
Prioritizing with the PIE Framework
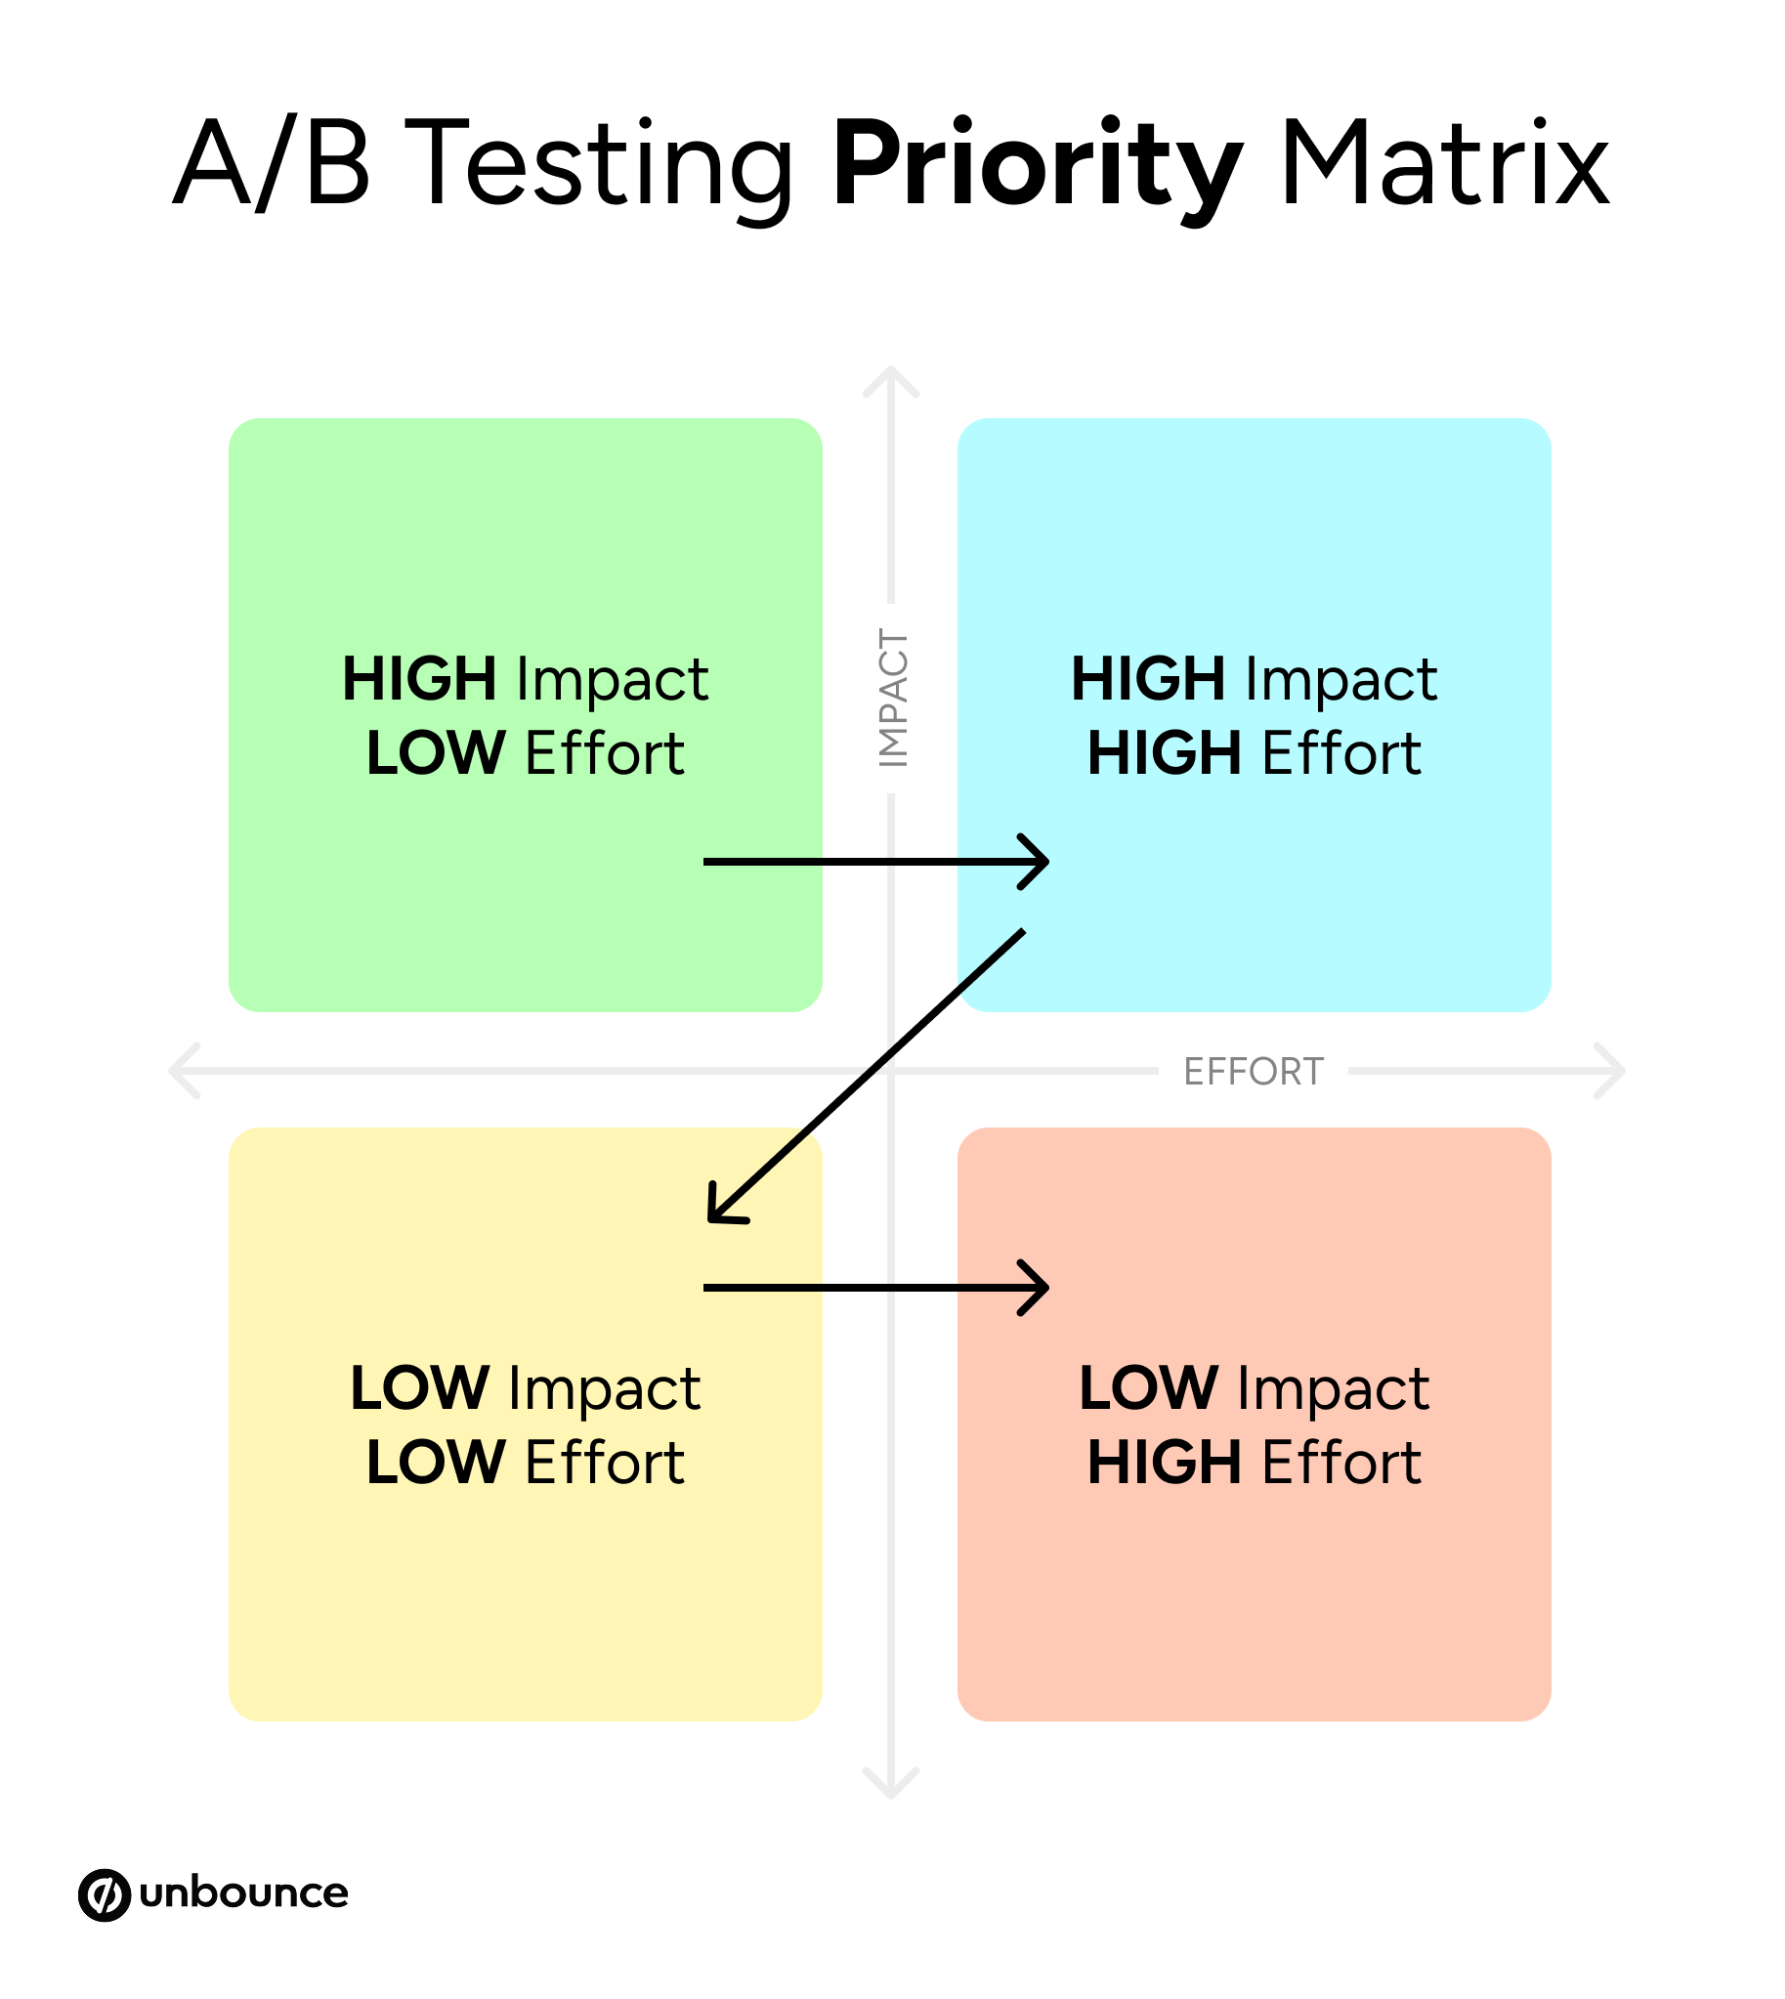
You will likely have more test ideas than time. Use the PIE framework to prioritize:
- Potential: How much could this page improve?
- Importance: How valuable is this traffic?
- Ease: How difficult is this test to implement?
By scoring each test idea on these criteria, you ensure that your team is focusing on high-impact changes rather than getting bogged down in minor, inconsequential tweaks.
Statistical Rigor
Never declare a winner based on a few days of data. Statistical significance is the safeguard that ensures your results are not just random noise. As a rule of thumb, wait until your test has reached a sufficient sample size and statistical confidence (typically 95%) before implementing a change. Even "losing" tests are valuable; they teach you what does not resonate with your audience, effectively narrowing your path toward a winning strategy.
The Future of CRO: Tools and Integration
In a crowded, competitive market, relying on gut instinct is a liability. You need a modern tech stack that allows for rapid experimentation and integrated reporting. The most effective marketing teams consolidate their tools to avoid the friction of disparate platforms.
By utilizing a unified system for landing pages, A/B testing, and analytics, you can reduce the time between forming a hypothesis and launching a test. This agility is the ultimate competitive advantage. When your competitors are stuck in a cycle of manual, disjointed data collection, your team should be launching, learning, and iterating at high velocity.
Conclusion: The Path Forward
The difference between stagnant conversion rates and consistent growth is not luck—it is a systematic approach to measurement. By defining clear, outcome-focused goals, tracking micro-conversions, supplementing data with qualitative feedback, and building a disciplined culture of experimentation, you can transform your analytics from a source of confusion into a roadmap for revenue.
Stop drowning in data. Start pulling the levers that actually matter. The process of conversion optimization is a marathon, not a sprint, and it begins with the decision to finally stop guessing and start measuring.