

In the high-stakes world of digital marketing, data is often treated as a vanity metric—a box to check once a campaign has already launched. However, the most successful growth teams have realized that analytics should never be an afterthought. Effective Conversion Rate Optimization (CRO) doesn’t begin when a test goes live; it begins in the planning phase, long before a single pixel is placed on a landing page.
For many marketers, the experience is all too familiar: drowning in a sea of Google Analytics reports and heatmaps, yet unable to extract a single actionable insight. This article explores the systematic transition from passive data collection to a high-impact, conversion-focused workflow that drives measurable business growth.
1. Defining Success: Moving Beyond Vague KPIs
The most common pitfall in CRO is the obsession with "vanity metrics"—data points that look impressive on a slide deck but fail to move the bottom line. Before diving into tools, you must define what success actually looks like for your business.
From Vague Goals to Outcome-Focused Targets
Setting a goal like "increase conversion rate" is not a strategy; it is a wish. To be effective, your goals must be tied to specific business outcomes. Instead of chasing a generic percentage, align your CRO efforts with your sales funnel. If you know that 10% of qualified leads ultimately become customers, and your quarterly target is 50 new clients, you can reverse-engineer your required lead volume.
Industry benchmarks, such as the 6.6% median conversion rate across sectors, serve as a helpful reality check, but they should not be your North Star. Use them to calibrate expectations, but prioritize your own historical data and business-specific margins.

The Power of Micro-Conversions
If you only measure "Macro" conversions (purchases or form submissions), you are ignoring the vast majority of user activity. Micro-conversions—such as watching a demo video, clicking a pricing link, or downloading a case study—provide the context of early intent. By tracking these smaller interactions, you gain visibility into where friction exists in the funnel long before a prospect reaches the final checkout stage.
2. Deciding Which Metrics Actually Matter
Data overload is the enemy of action. When your dashboard resembles an all-you-can-eat buffet, the result is usually decision paralysis. The key is to strip away the noise and focus on metrics that reveal the "leaky" parts of your funnel.
Funnel Analysis: The X-Ray of Your Site
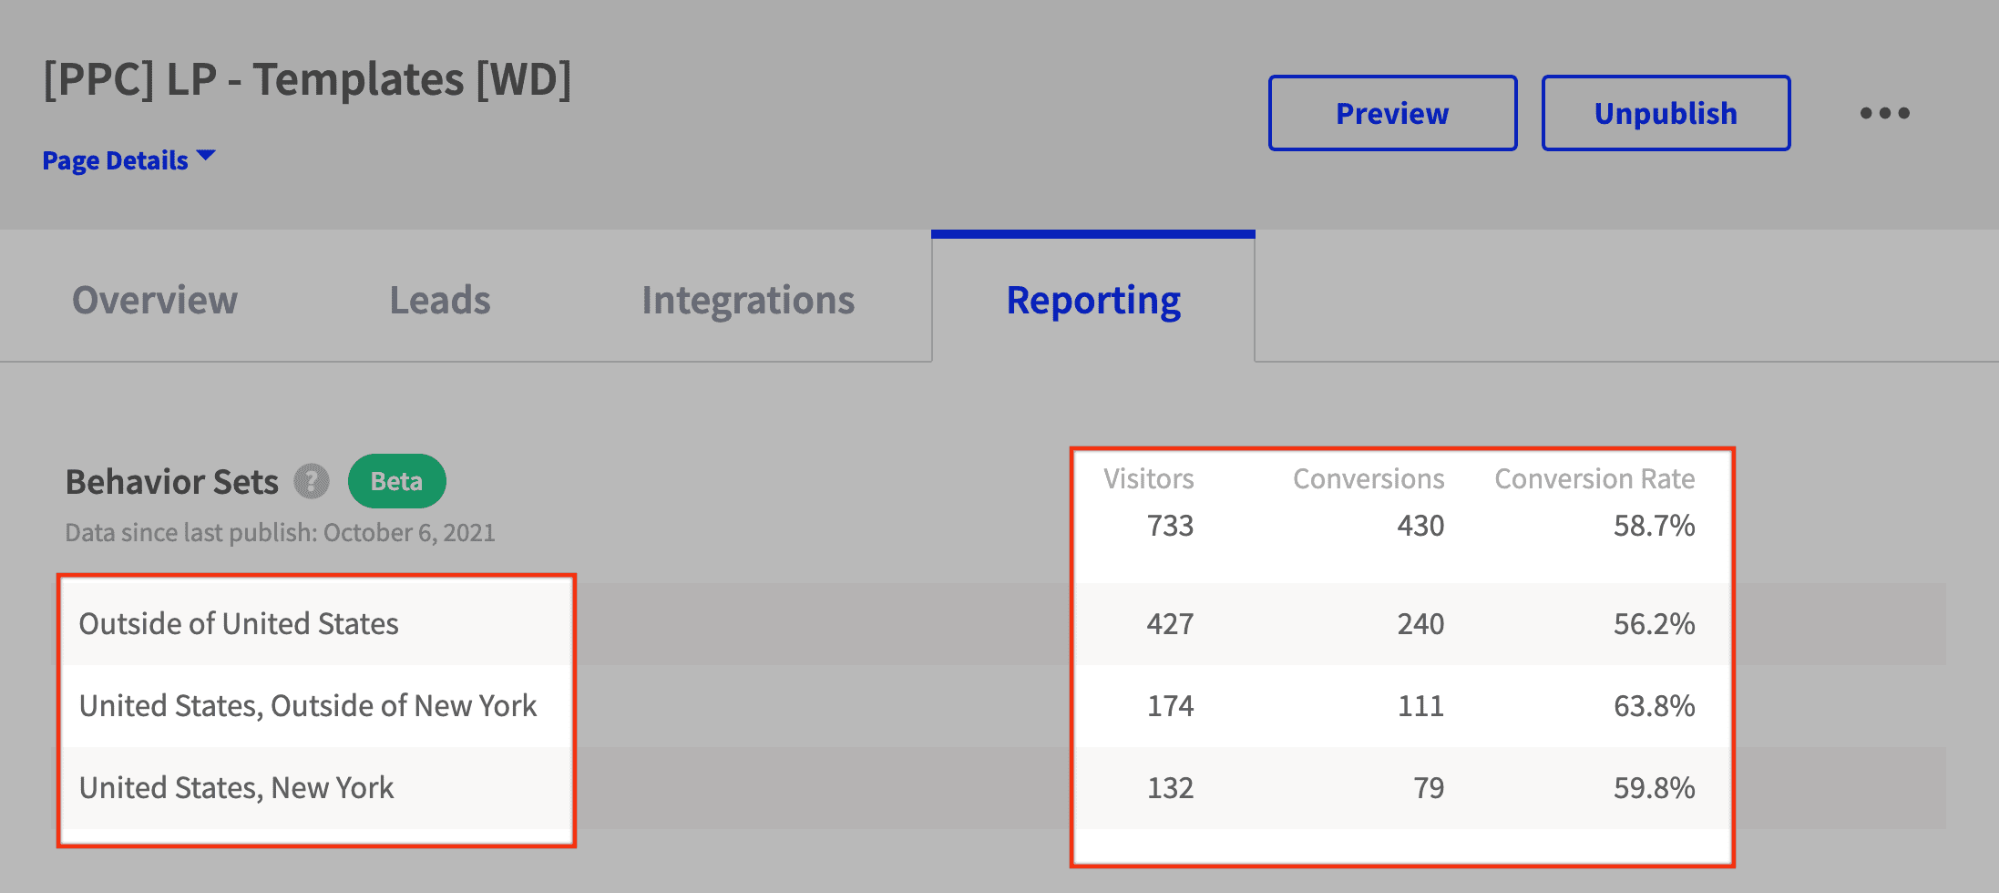
A funnel report acts as an X-ray for your customer journey. By segmenting your funnel by traffic source—for example, comparing social media visitors against email subscribers—you can identify exactly where specific demographics are dropping off. If your pricing page sees a 40% drop-off rate, you have identified a concrete, solvable problem rather than a vague sense of "low performance."
The Danger of Misleading Data
Context is everything. A high bounce rate, for instance, is often misinterpreted as a failure. In reality, it may indicate that a user found exactly what they were looking for and exited satisfied. To avoid these traps, marketers must utilize rigorous segmentation. Filter your data by device, browser, and traffic source to uncover the truth. For example, recent data suggests that while 83% of traffic occurs on mobile, desktop continues to convert at a significantly higher rate. Without segmenting by device, you might be blaming your copy for a problem that is actually rooted in mobile user experience.
3. Adding Qualitative Context to Quantitative Numbers
Numbers tell you what is happening, but they rarely explain why. To bridge this gap, you must integrate qualitative research into your workflow.

Heatmaps and Session Recordings
Visual behavior tools provide a "looking over the shoulder" perspective. Heatmaps reveal where users click and how far they scroll, while session recordings highlight moments of frustration—such as rage-clicking an unclickable image or struggling with a form field. These visual cues are essential for identifying friction points that spreadsheets simply cannot capture.
The Voice of the Customer
Surveys are your direct line to the user’s psychology. By deploying targeted exit-intent surveys, you can ask the single most important question in CRO: "What stopped you from completing your purchase today?" The responses often uncover simple, easily fixable blockers, such as confusion over shipping costs or lack of clarity regarding support options.
4. Building Tests on Data-Backed Hypotheses
Once you have collected the data, the temptation is to start testing immediately. However, random testing is an expensive way to learn. Every experiment should be grounded in a formal hypothesis.
The Anatomy of a Winning Hypothesis
A proper hypothesis follows a strict formula:
"Because we observed [data insight], if we [make this specific change], then [this metric] will [increase/decrease]."
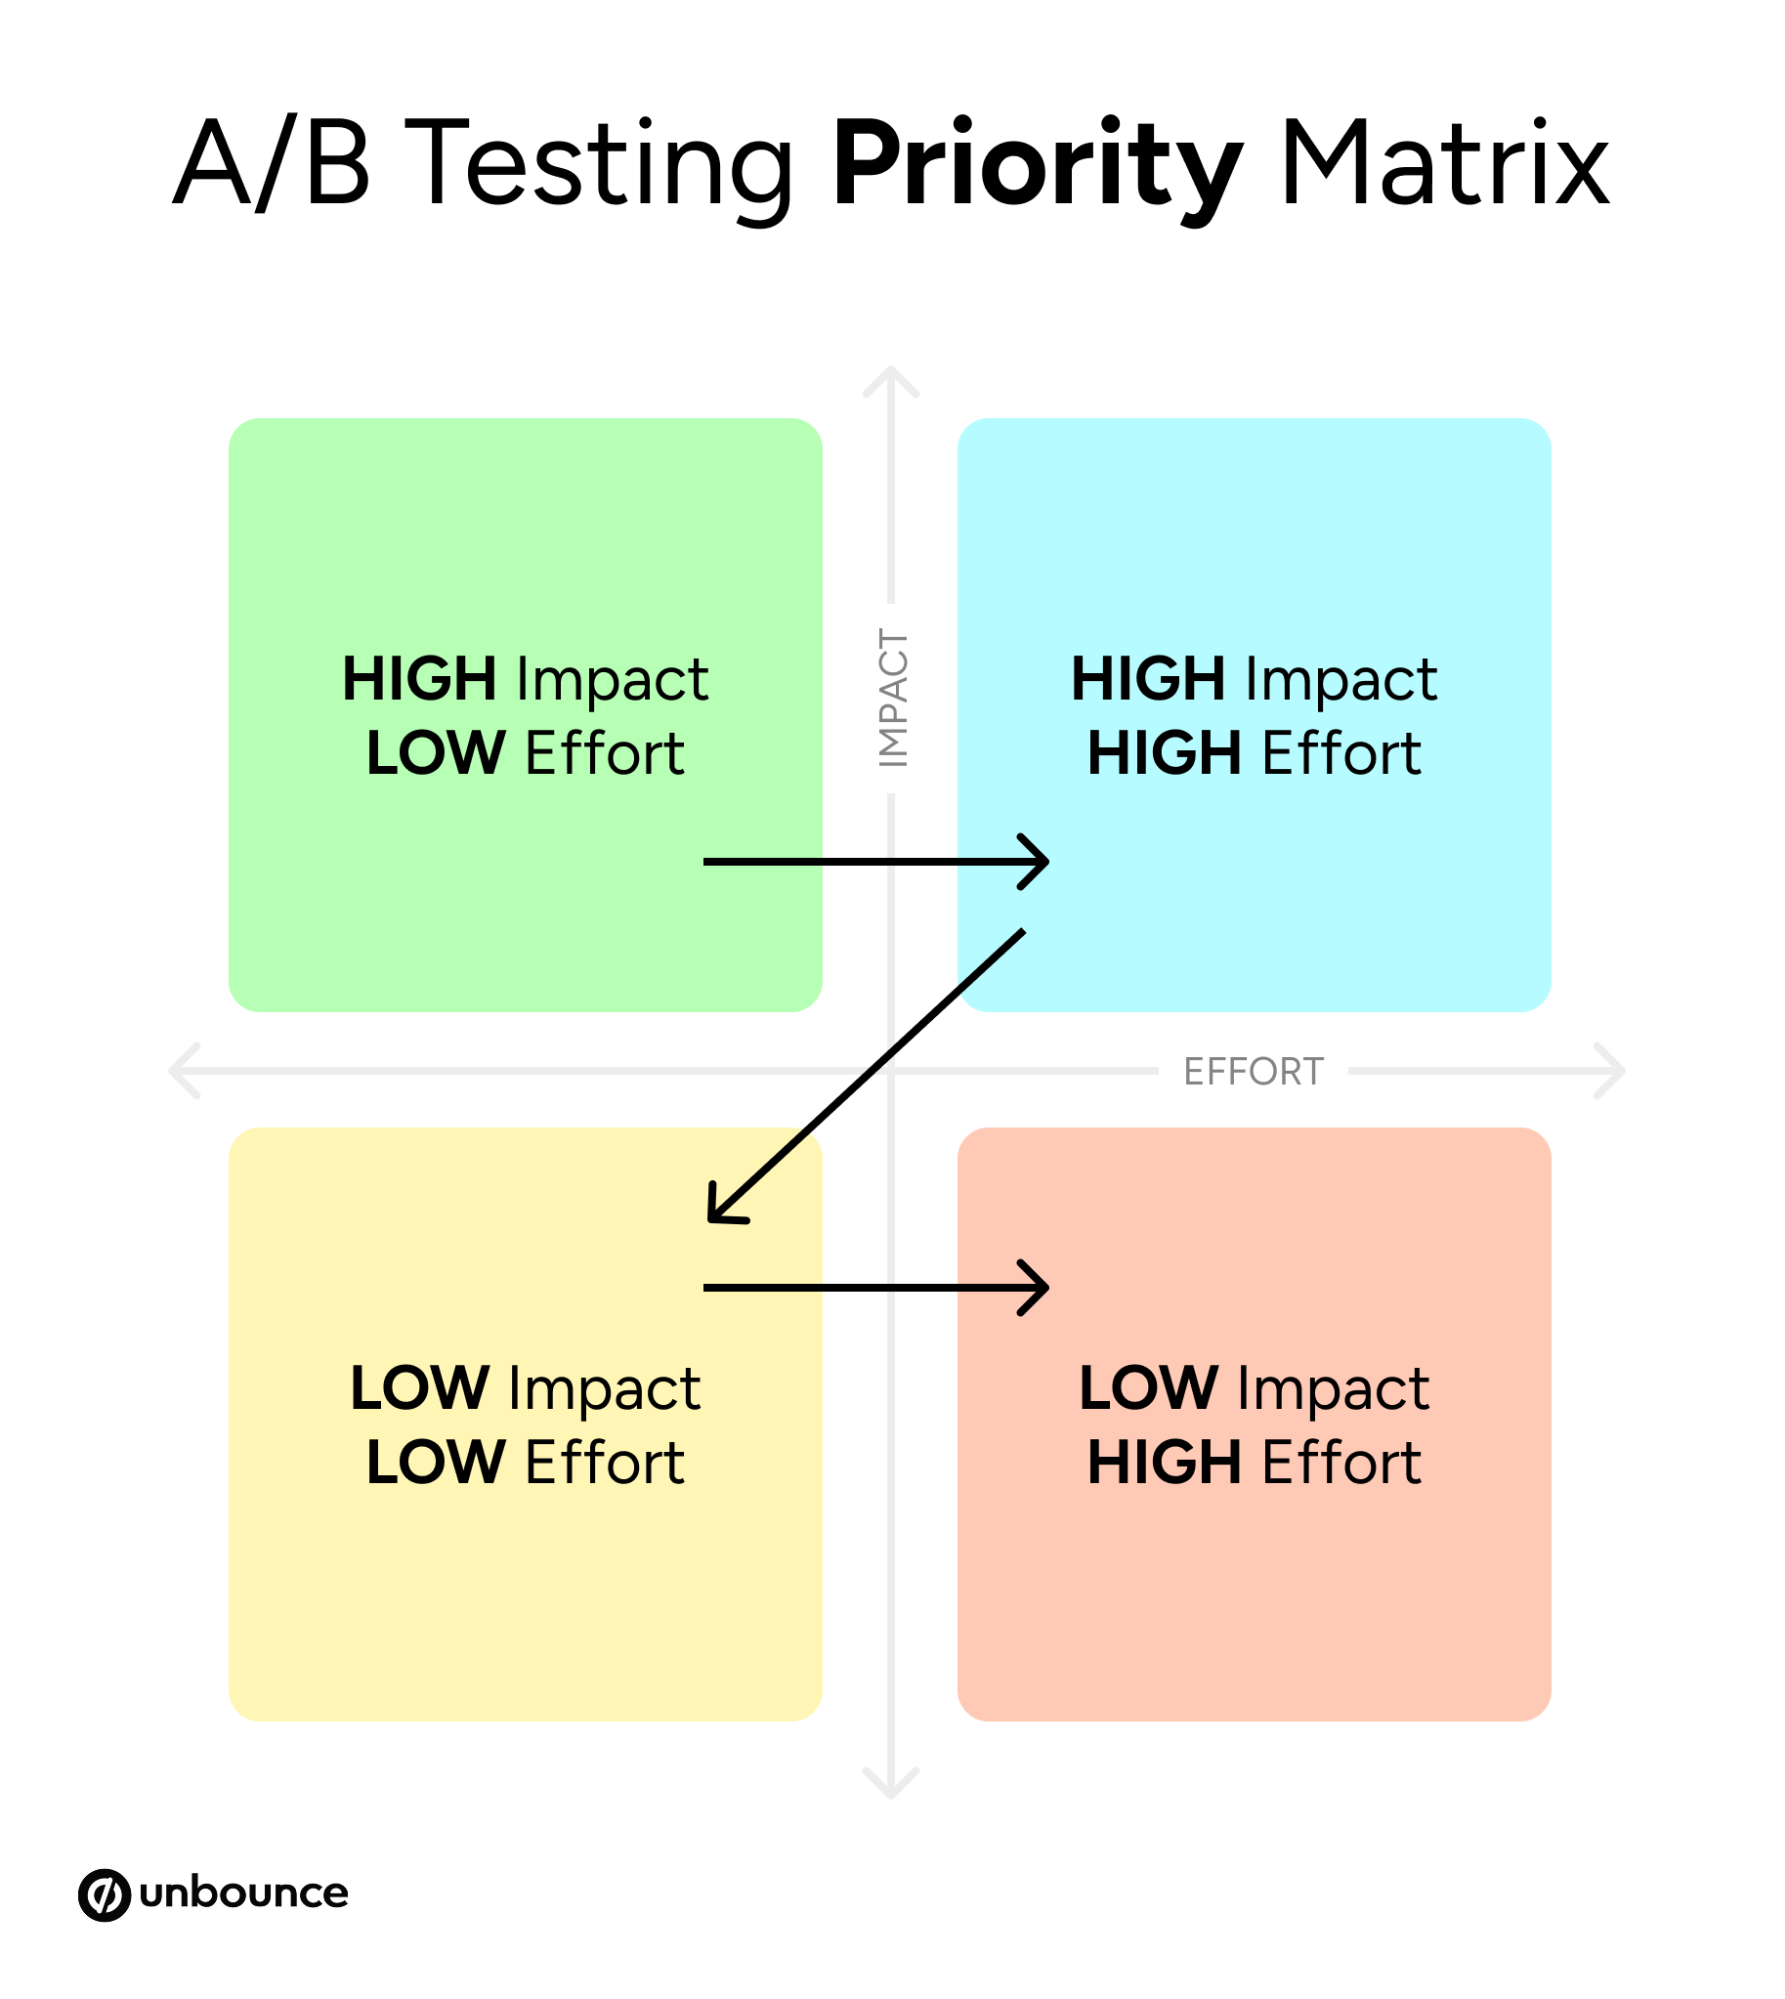
This structure ensures that every test is an attempt to solve a specific, observed problem rather than a subjective design preference. Once you have a backlog of hypotheses, prioritize them using a simple 2×2 matrix evaluating "Impact" vs. "Ease of Implementation." Focus on high-impact, low-effort changes first to build momentum.
Maintaining Statistical Rigor
A common mistake in testing is declaring a winner prematurely. Without reaching statistical significance, you are likely acting on noise rather than signal. Always calculate the probability that your results are not due to chance. Remember: even "losing" tests are valuable. A test that yields no difference teaches you that a specific element is not a primary driver of conversion, allowing you to move your focus elsewhere.
5. Turning CRO into an Organizational Habit
Conversion Rate Optimization is not a project; it is a discipline. The companies that dominate their markets do not treat optimization as an event—they treat it as a culture.
The Virtuous Cycle of Experimentation
A healthy CRO "flywheel" involves:
- Observation: Monitoring data and qualitative feedback.
- Hypothesis: Formulating a data-backed plan.
- Execution: Running the test.
- Learning: Analyzing results (regardless of the outcome).
- Iteration: Applying learnings to future campaigns.
By treating tests as connected experiments rather than isolated events, you create a compounding effect. A small 5% lift in conversion, when repeated across multiple touchpoints over a year, results in massive cumulative growth.
The Essential Toolkit
To sustain this, you need a streamlined stack. Attempting to manage CRO with fragmented tools often leads to burnout. Modern teams require:
- Analytics: For broad quantitative tracking.
- Heatmaps/Recordings: For behavioral context.
- Survey Tools: For direct user input.
- Testing Platforms: For rapid deployment and segmentation.
- Centralized Reporting: To keep the team aligned on outcomes.
Conclusion: From Guesswork to Growth
The transition from being overwhelmed by data to becoming a high-performing, data-driven marketer is defined by systematic measurement. When you stop relying on intuition and start relying on a structured, evidence-based process, you stop guessing and start growing.
As you move forward, remember that the most successful marketers are not those with the most complex tools, but those who best understand the "why" behind their users’ actions. Start small, maintain your statistical rigor, and turn your metrics into the insights that will define your next big win.