
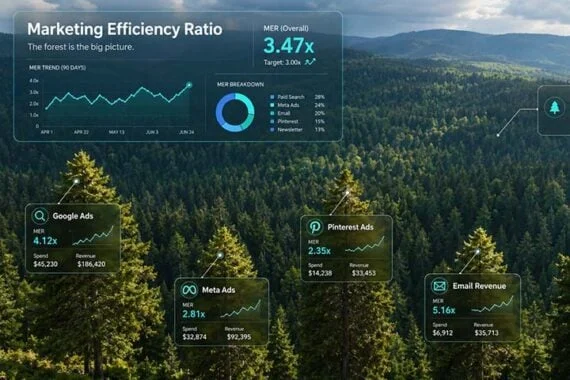
In the high-stakes world of ecommerce, the quest for the perfect attribution model has become the industry’s equivalent of chasing a mirage. Despite the arrival of sophisticated, AI-driven tracking tools, machine learning algorithms, and cross-device identity resolution services, the fundamental task of mapping revenue to specific marketing efforts remains notoriously messy.
Google Ads provides data on return on ad spend (ROAS). Meta’s dashboard tracks conversion values and granular cost-per-result metrics. Email marketing platforms report revenue-per-send, while affiliate networks track individual commissions. Each of these tools functions as a niche specialist, providing high-fidelity data on a specific "tree" within the vast promotional "forest."
While these granular insights are indispensable for tactical optimization, they often fail to answer the most critical question for ecommerce leadership: Is the company’s total marketing investment actually driving sustainable, profitable growth? To answer this, forward-thinking brands are increasingly turning to the Marketing Efficiency Ratio (MER)—a holistic metric that ignores the noise of attribution to focus on the big picture.
What Is MER and Why Does It Matter?
The Marketing Efficiency Ratio is, at its core, a simple indicator that compares total revenue to total marketing spend. It is not designed to replace channel-specific metrics like ROAS, Customer Acquisition Cost (CAC), or Lifetime Value (LTV); rather, it acts as the primary gauge of the health of the entire marketing ecosystem.
The Calculation
The beauty of MER lies in its transparency. The formula is straightforward:
MER = Total Revenue ÷ Total Marketing Spend
Consider a scenario: An ecommerce brand generates $500,000 in gross revenue over the course of a month. During that same period, the company spends $100,000 on marketing—a figure that encompasses not just advertising spend, but also agency retainers, affiliate commissions, content production costs, and software subscriptions.
In this instance, the company’s MER is 5.0. This means that for every single dollar invested in the marketing apparatus, the company generates five dollars in top-line revenue. This "blended" approach is why many industry veterans refer to MER as "Blended ROAS."
The Chronology of Attribution’s Decline
To understand why MER is gaining such prominence, one must look at the shifting landscape of digital privacy and consumer behavior over the last decade.
The Golden Age of Tracking (2010–2018):
In the early days of social and search advertising, third-party cookies provided near-perfect visibility. Marketers could track a user from their first click on a Facebook ad to the final checkout on a website with remarkable precision. This created a reliance on single-channel attribution models.
The Privacy Pivot (2018–2021):
The introduction of GDPR in Europe and the California Consumer Privacy Act (CCPA) signaled the beginning of the end for granular, persistent tracking. The digital walls began to close in, limiting how much data platforms could collect on user behavior.
The Post-iOS 14 Era (2021–Present):
Apple’s App Tracking Transparency (ATT) framework was the watershed moment. It effectively blinded many ad platforms to the long-term journey of users. Suddenly, "last-click" attribution became fundamentally broken. Marketers realized that the data inside their Facebook or Google dashboards was no longer the "source of truth," but rather a partial, often fragmented view of reality.
This technological evolution forced a pivot. Marketers realized that if they could no longer accurately track every individual touchpoint, they had to shift their focus to the total aggregate output of their spending.

Supporting Data: MER vs. Channel-Specific ROAS
To illustrate the difference, consider the "attribution trap." A manager might look at a Google Shopping campaign and see a ROAS of 4.2, prompting them to increase the budget. However, that campaign may be cannibalizing organic search traffic or simply capturing intent that would have resulted in a sale regardless of the ad.
ROAS measures the performance of a specific tactic. MER measures the performance of the entire business.
| Feature | ROAS (Channel-Specific) | MER (Blended) |
|---|---|---|
| Primary Goal | Tactical optimization | Financial health |
| Input Data | Platform-side metrics | Bank-side/ERP data |
| Sensitivity | High (subject to tracking loss) | Low (immune to tracking gaps) |
| Strategic Use | Ad creative/bid adjustment | Budget allocation/Profitability |
When a company observes a high ROAS in a specific channel but a stagnant or declining MER, it serves as a "canary in the coal mine." It suggests that the marketing budget is not actually contributing to incremental growth, but is instead being spent on customers who would have converted through other channels (or none at all).
The Essential Inputs: Maintaining Integrity
For MER to be an effective management tool, the inputs must be consistent and comprehensive. If a brand excludes agency fees or content production costs in one quarter but includes them in the next, the data becomes noisy and unreliable.
To build an accurate MER, companies should include:
- Paid Media Spend: All platforms (Google, Meta, TikTok, Pinterest, etc.).
- Agency Fees: Retainers and performance-based payouts.
- Content/Creative Costs: Freelancer fees, photography, and video production.
- Affiliate Commissions: All payments to partners and influencers.
- Software Tools: Any marketing-specific SaaS subscriptions.
Consistency is the bedrock of this metric. If a marketing team decides to include an expense, that category must remain a fixture of the calculation to ensure month-over-month and year-over-year comparisons are valid.
Implications for Budgeting and Strategy
Marketing is rarely a linear process. A customer might see a Meta ad on Monday, receive an email on Wednesday, search for the brand on Google on Friday, and finally complete the purchase on Saturday.
In this journey, every platform will try to claim 100% of the credit for that sale. This leads to internal arguments between platform managers, skewed budget allocations, and a waste of executive time. By using MER, leadership can avoid the "attribution war" entirely.
Establishing Guardrails
MER provides the necessary guardrails for scaling a business. By establishing a "break-even" MER—the point where the business neither gains nor loses money—marketers can determine their operational boundaries.
- High MER (e.g., 7.0+): This may signal that the brand is "under-investing." The company is highly profitable, but it might be leaving market share on the table by not spending more to acquire customers.
- Stable MER (e.g., 4.0–5.0): This is often the "sweet spot" for healthy growth, providing enough profit to reinvest while maintaining scale.
- Low MER (e.g., <2.5): This suggests inefficiency. The company is spending too much on customer acquisition relative to the revenue being generated, potentially eroding long-term viability.
The "Big Picture" Perspective
There is no universal "good" MER. It is entirely dependent on the specific economics of the business. An ecommerce store with a 70% gross margin can tolerate a significantly lower MER than a business operating on thin 25% margins.
A high-margin business can afford to spend more to acquire a customer, meaning they can operate at a lower MER while still remaining profitable. Conversely, a low-margin business must maintain a high MER to ensure that their marketing spend does not exceed their net profit per unit.
Final Thoughts
The Marketing Efficiency Ratio is not a replacement for deep-dive analytics. It does not tell you which ad creative performed best or why a specific landing page converted at a higher rate. It does not replace the need for Marketing Mix Modeling (MMM) or rigorous CAC analysis.
Instead, MER provides the executive team with a reliable, unshakeable "source of truth." In an era where digital tracking is increasingly opaque, the ability to zoom out and view the forest—rather than obsessing over a single leaf—is the hallmark of modern, data-driven ecommerce leadership. By focusing on the relationship between total investment and total revenue, businesses can strip away the complexities of the digital age and focus on what matters most: the bottom line.