In the high-stakes world of digital marketing, one question haunts every growth marketer, startup founder, and agency lead: "Is my conversion rate good?"
For years, marketers have chased a mythical "industry average," often comparing their performance against irrelevant data points. However, new research from the 2024 Unbounce Conversion Benchmark Report—which analyzed a massive dataset of 57 million conversions across 41,000 landing pages and 464 million pageviews—reveals that the "one-size-fits-all" approach to conversion rate optimization (CRO) is fundamentally broken.

The reality is that conversion rates are deeply contextual. They are tethered to industry nuances, visitor intent, traffic sources, and even the complexity of the offer itself. This report serves as a definitive guide to understanding what "good" actually looks like in your sector and how to move the needle.
The Baseline: Understanding the Median vs. the Average
Before diving into industry-specific data, it is crucial to understand the methodology behind these findings. The 2024 report relies on median values rather than arithmetic averages.

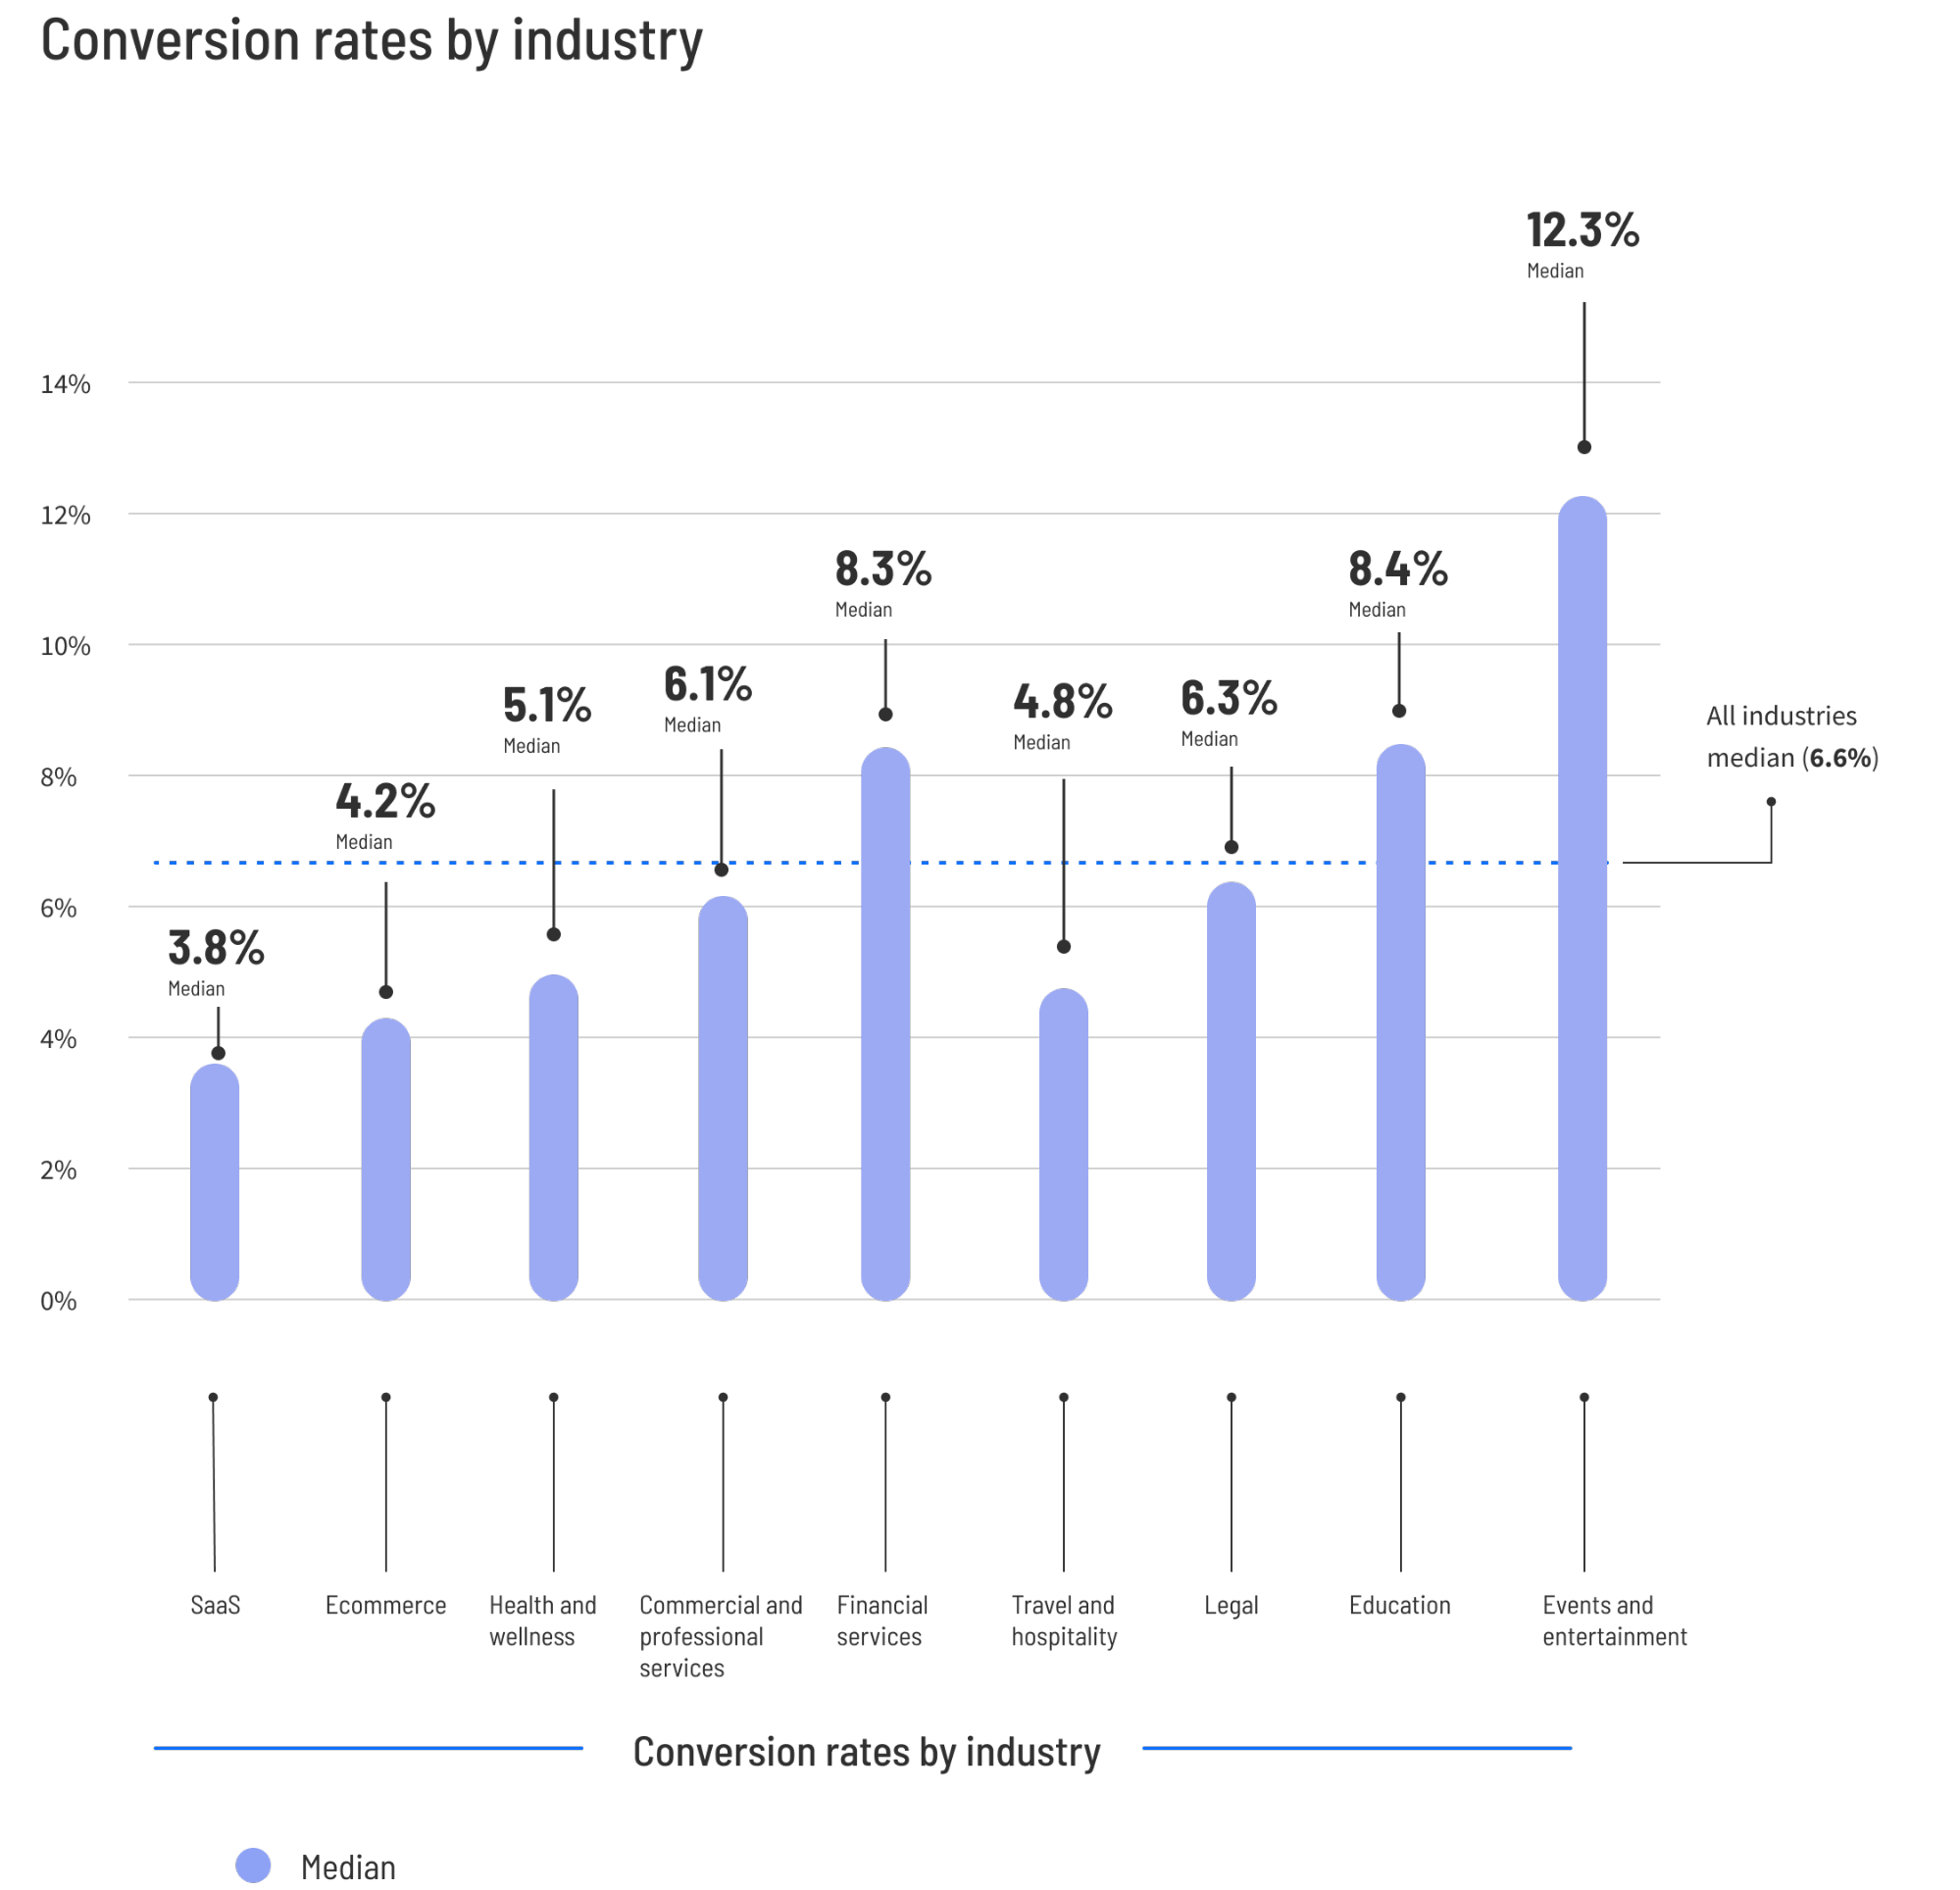
In statistics, the average can be heavily skewed by "unicorn" pages—outliers that convert at 90%—or struggling pages that convert at near-zero. Using the median provides a true "middle-of-the-pack" figure. With a median conversion rate of 6.6% across all industries, this number serves as a baseline, but it is not a target. Much like the average height of a human being, knowing the global median provides little value when you are trying to optimize for a specific demographic.
Industry-Specific Deep Dives: Where Do You Stand?
The gap between a "standard" conversion rate and a "top-tier" rate is where the real business growth happens. To join the top 25% of performers in any given industry, you must clear specific, elevated benchmarks.
1. Ecommerce: The High-Volume Game
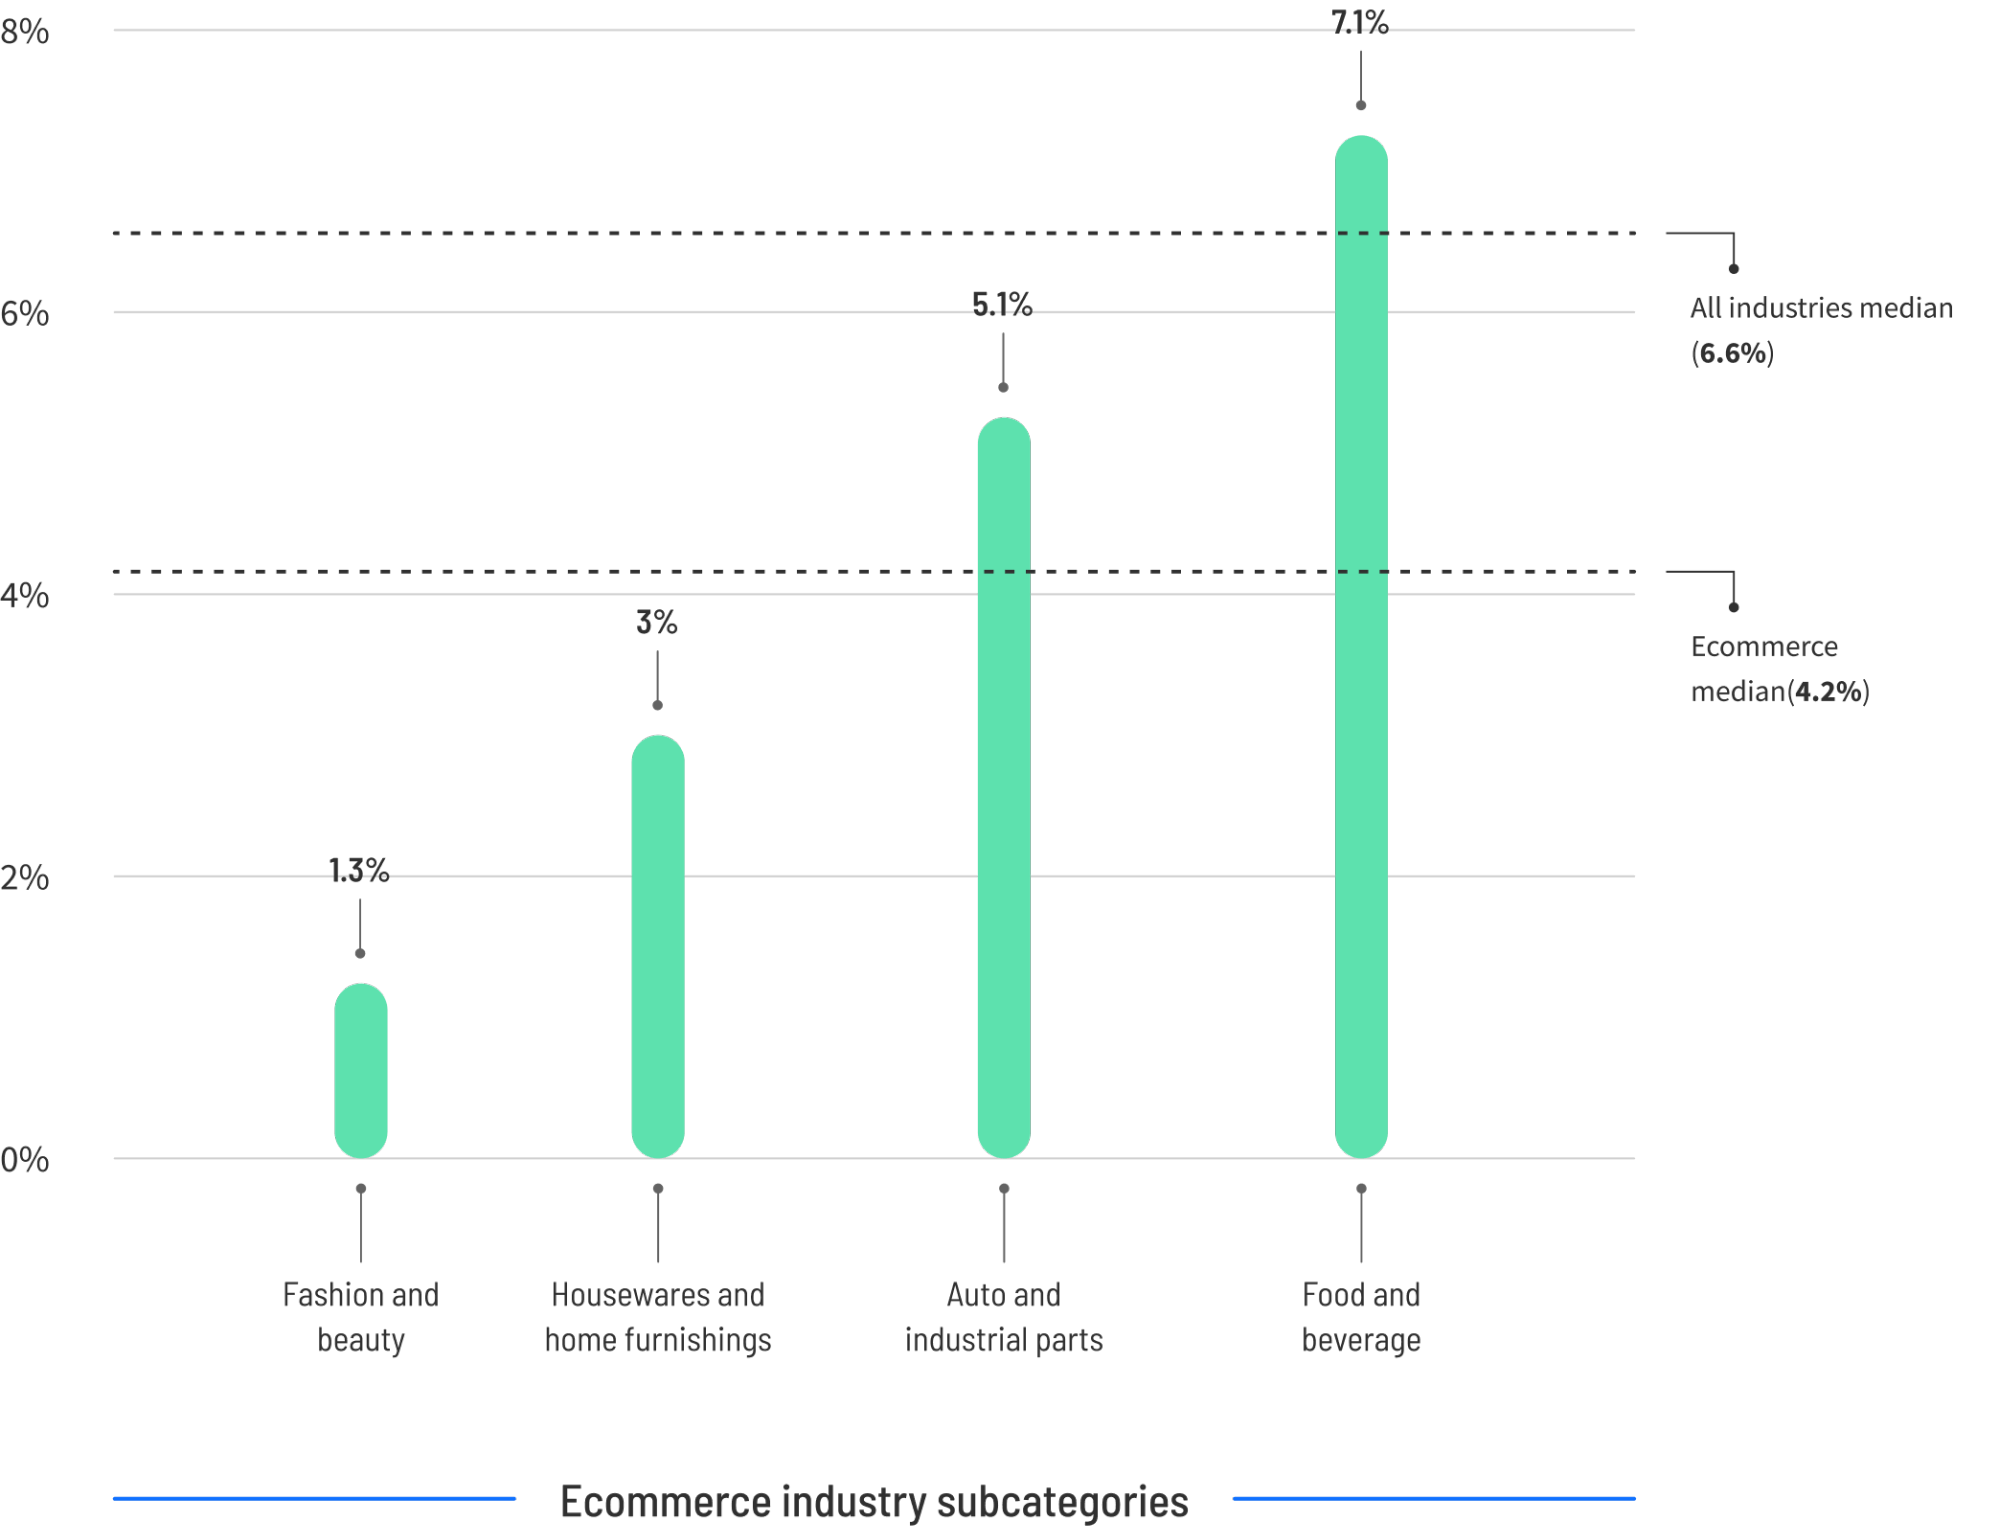
Ecommerce landing pages see a median conversion rate of 4.2%. However, the top 25% of performers in the space are achieving rates of 11.4% or higher—nearly triple the median.
- The Implication: For an ecommerce store receiving 10,000 visitors per month, the leap from the median to the top quartile translates to an additional 720 conversions. If your average order value is $75, that’s $54,000 in additional monthly revenue simply by optimizing for better performance.
2. SaaS: Navigating Complex Sales Cycles
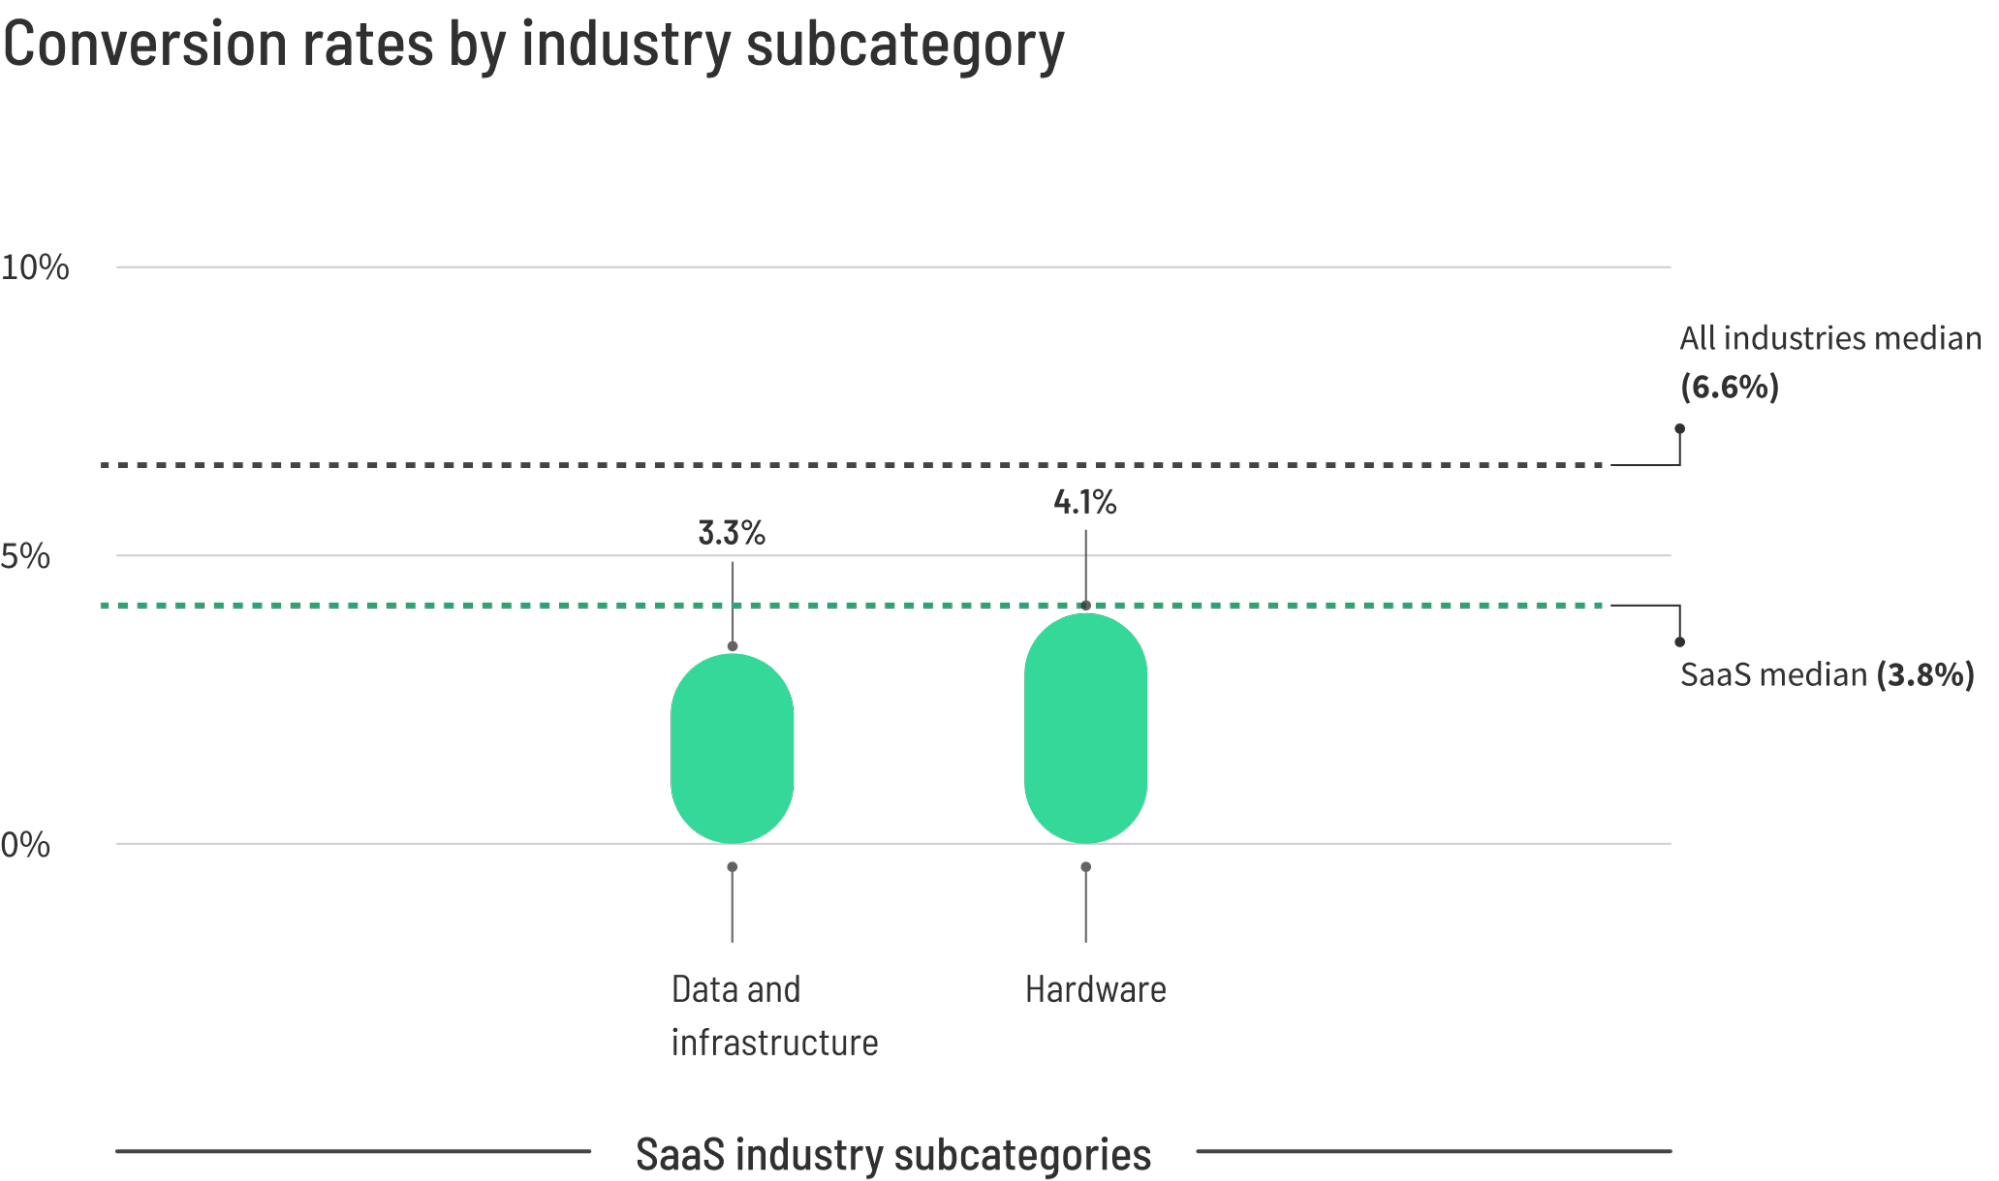
SaaS companies face a median conversion rate of 3.8%. The lower baseline compared to the all-industry average is largely due to the complexity of the offer. Whether it is a free trial, a demo request, or a gated whitepaper, SaaS visitors often require more education. To break into the top 25% of SaaS pages, your site needs to convert at 11.6% or higher.
3. Professional Services: Building Trust
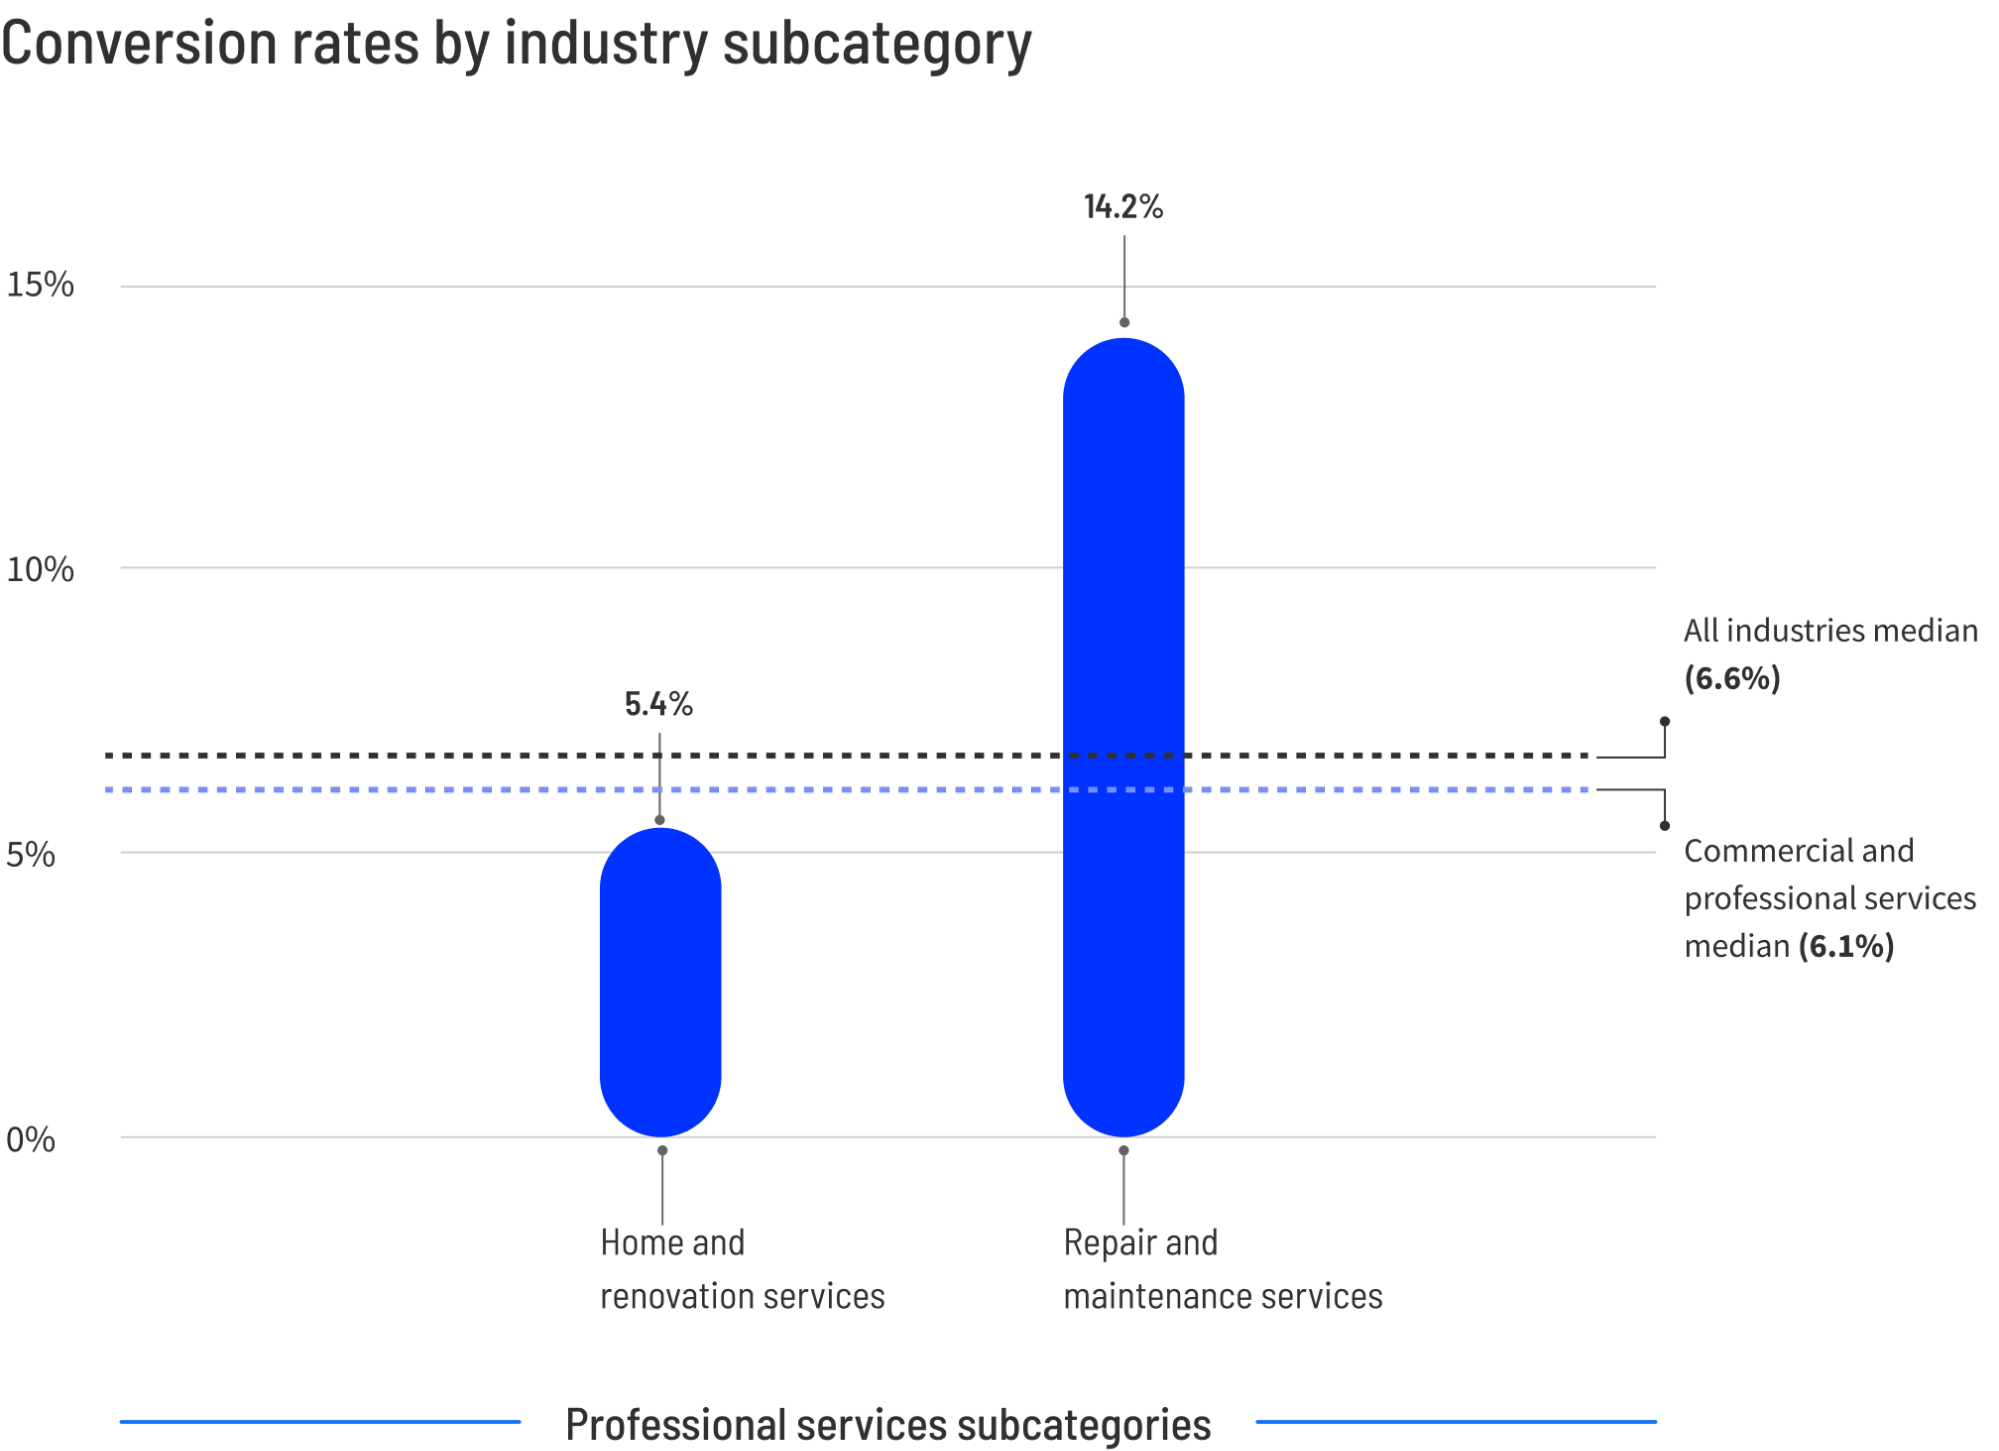
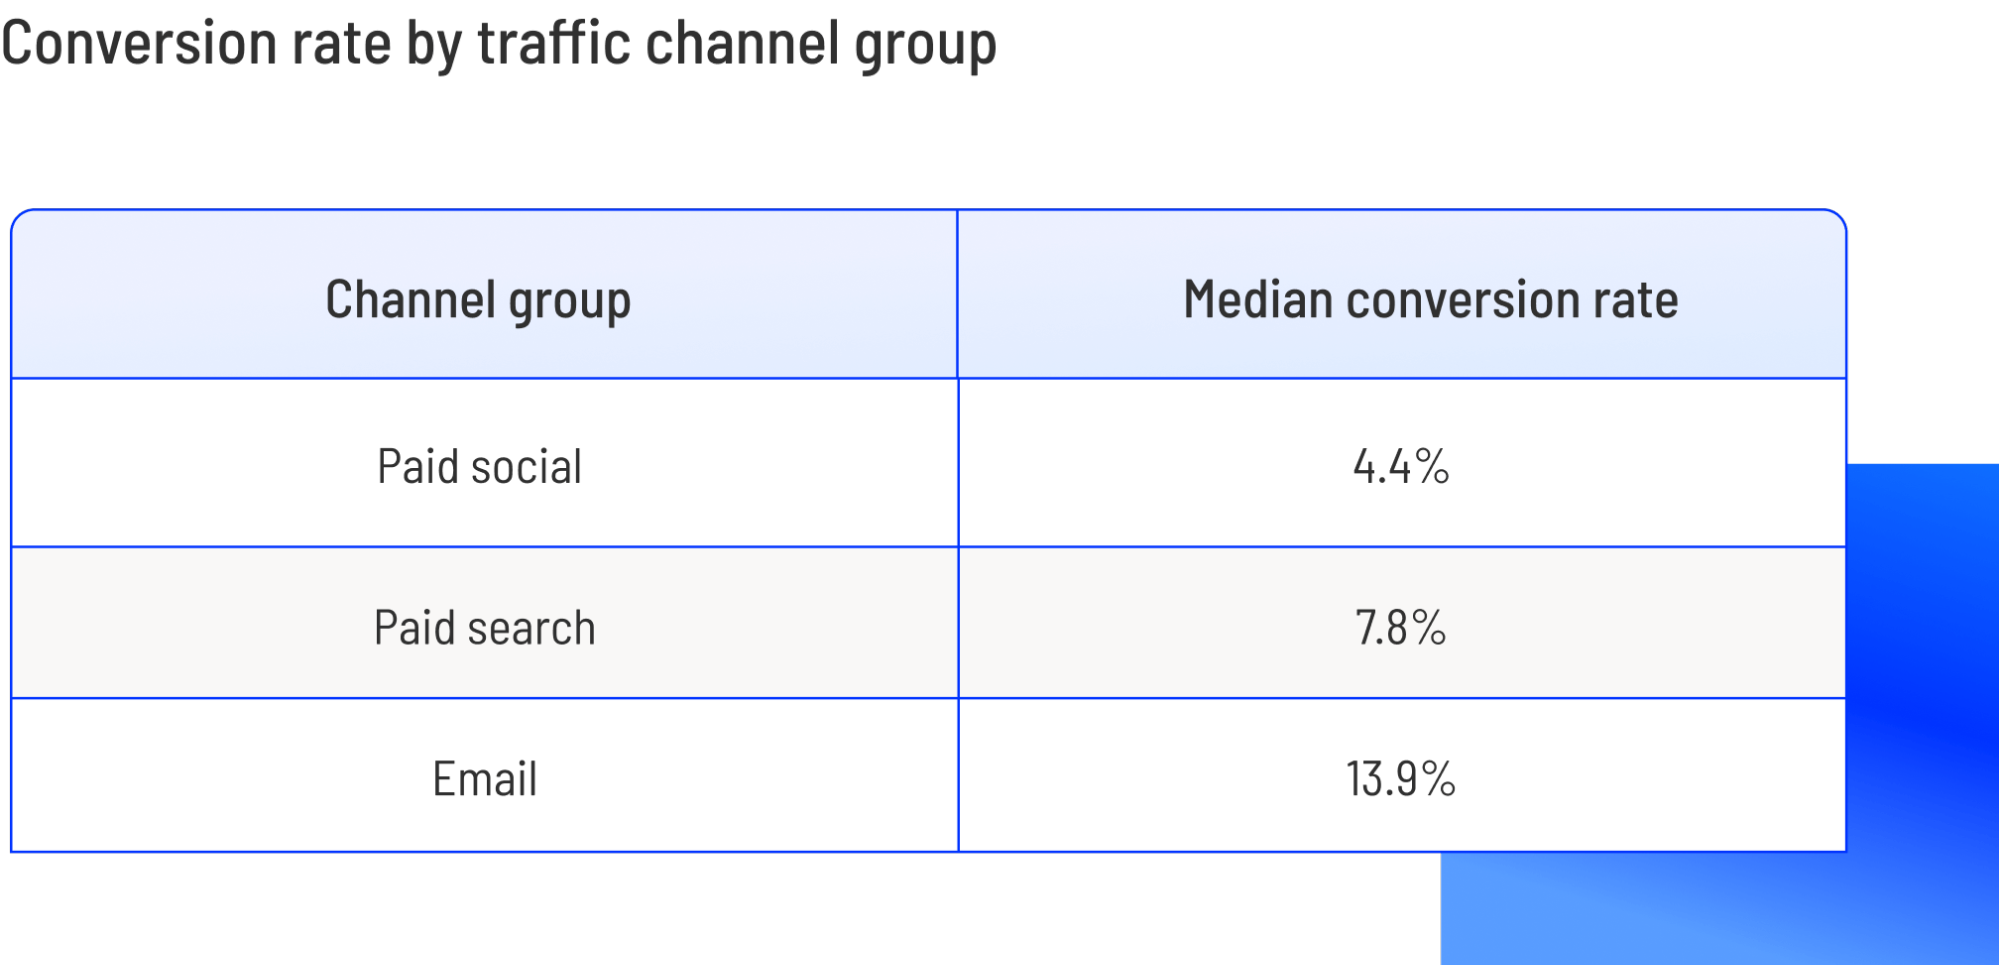
This category is incredibly diverse, ranging from local maintenance services to high-end consulting. The median sits at 6.1%, but the top performers hit 14.1%. A critical insight here is the role of traffic sources: email traffic in professional services converts at nearly 14%, while paid social lags at 4.4%. This highlights the necessity of nurturing existing leads rather than relying solely on cold traffic.
4. Financial Services: High Intent, High Stakes
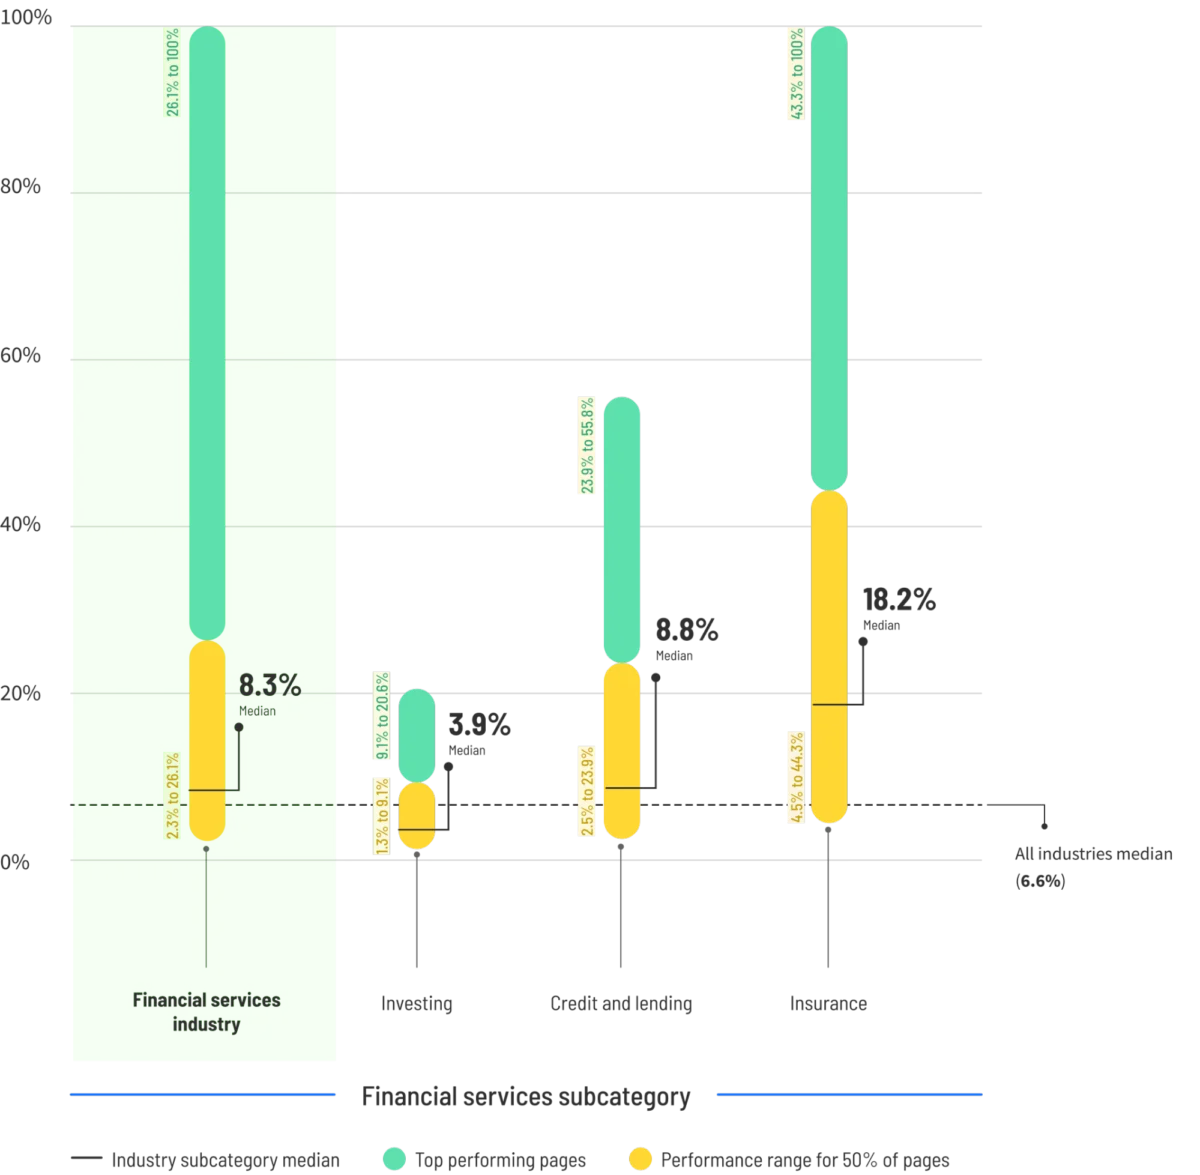
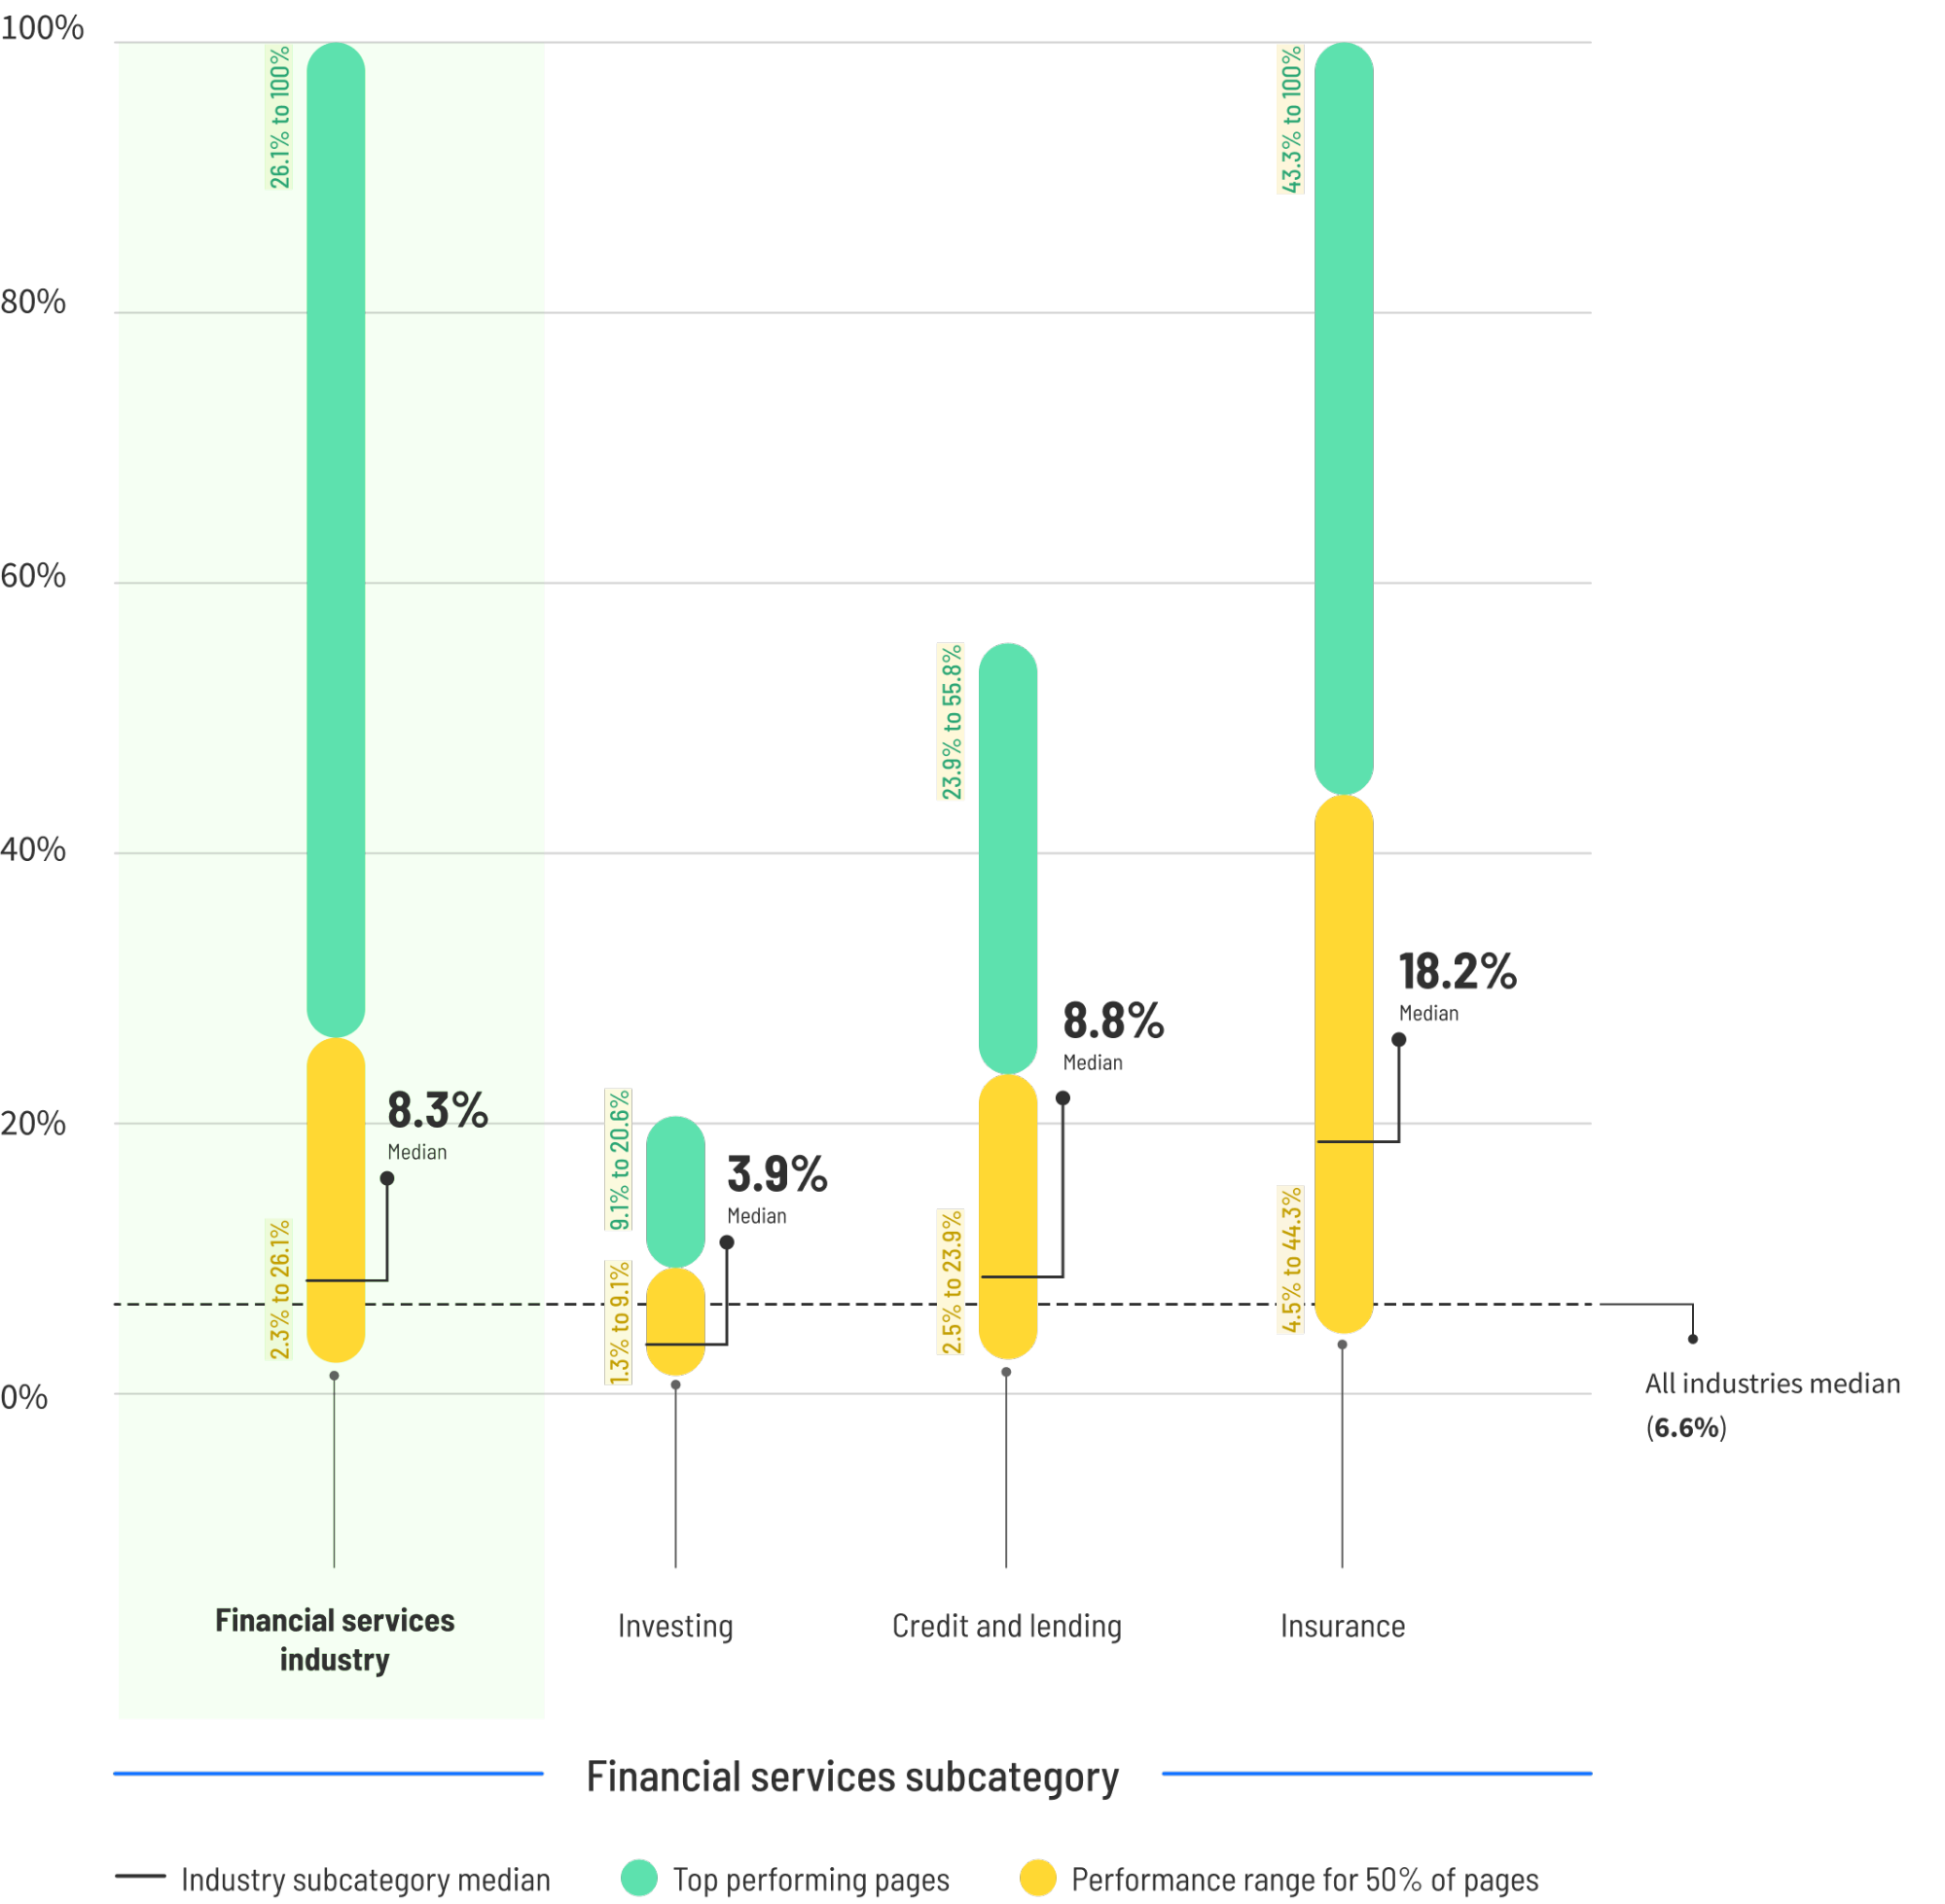
Financial services boast a strong median conversion rate of 8.3%. Interestingly, this industry defies the standard "desktop-first" preference; mobile traffic actually converts 27.8% better than desktop in this sector. This suggests that users are often performing urgent, mobile-based research for insurance or financial products.
5. Legal: The Urgency Factor
Legal landing pages show a median of 6.3%, but top-performing pages reach 13.1%. Similar to finance, mobile conversion for legal services is exceptionally strong at 21%. The data suggests that legal services are often a "distress purchase"—a user has just had an accident or received a notice and is searching frantically for an immediate solution.
6. Education: The Power of Transformation
Education marketers are seeing a median of 6.3%, with the elite tier reaching 20%. Online course providers are leading the pack, likely because they sell clear, immediate transformations (e.g., "Learn Python in 30 days") rather than abstract concepts.
7. Entertainment: The "Sweepstakes" Outlier
Entertainment landing pages show a median of 13%, but this is heavily influenced by high-volume, low-friction pages like sweepstakes, which can convert at nearly 48%. It is a stark reminder that the "ask" determines the conversion rate; asking for an email address is vastly different from asking for a credit card commitment.
Chronology of Conversion: Why Strategy Must Evolve
The data suggests that the most successful companies are not those that guess, but those that iterate. The chronology of a high-converting page usually follows this path:
- Baseline Audit: Establish your current performance against the industry median.
- Intent Alignment: Analyze whether your landing page copy matches the visitor’s state of mind (e.g., are they ready to buy, or are they still researching?).
- Friction Removal: Identifying and removing unnecessary form fields or navigation distractions.
- A/B Testing: Running continuous tests on CTAs, imagery, and value propositions.
Five Proven Tactics for Optimization
If you find yourself lagging behind these benchmarks, the following five data-backed tactics can help you bridge the gap:
- Simplify Your Copy: Pages written at a 5th-7th grade reading level convert at 11.1%—significantly higher than those using complex, professional jargon.
- A/B Test Everything: Don’t overhaul your page. Test one variable at a time—button color, headline length, or form structure—to isolate what works.
- Strategic Social Proof: Don’t bury your testimonials. Place reviews, logos, and success metrics directly near the conversion point.
- Mobile-First Optimization: Given that mobile accounts for 83% of landing page traffic, if your page isn’t mobile-optimized, you are effectively ignoring the vast majority of your audience.
- Remove Distractions: Every link on your landing page that isn’t your primary Call to Action is a "leaky pipe." Strip away navigation menus and social links to keep the visitor focused.
The Bottom Line: Moving From Average to Excellent
Benchmarks are useful for orientation, but they are not the destination. The companies that dominate their respective markets are those that treat conversion rate optimization as a permanent, systematic process rather than a one-time project.
The difference between the median (the average) and the 75th percentile (the excellent) is massive. Whether you are in SaaS, ecommerce, or legal services, the gap represents millions of dollars in unrealized revenue. By focusing on clarity, reducing friction, and constantly testing against your specific industry benchmarks, you can transform your landing pages from static brochures into high-velocity engines for growth.
As the 2024 data makes clear, the winners are not the ones with the largest budgets; they are the ones who are most rigorous about testing and most honest about the context of their users’ intent. Start today—your next 720 conversions might be just one A/B test away.