Main Facts: The 2026 Ecommerce Rebound
The United States digital retail sector is experiencing a formidable resurgence. According to data released by the U.S. Census Bureau, U.S. ecommerce sales achieved a second consecutive quarter of double-digit year-over-year growth in 2026, pointing toward a stabilization of consumer habits that closely mirror predictable, pre-pandemic patterns.
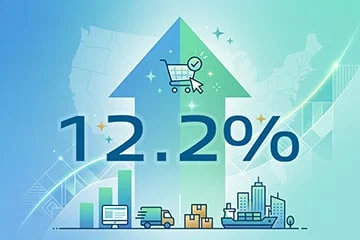
Seasonally adjusted retail ecommerce sales for the second quarter (Q2) of 2026 reached an impressive $340.2 billion. This represents a robust 12.2% increase compared to the same period in 2025. This stellar performance builds directly upon the momentum established earlier in the year, following Q1’s solid year-over-year increase of 10.1%, which recorded $327.9 billion in online transactions. When combined, consumer digital spending for the first half of 2026 totaled an astronomical $668.1 billion, translating to an 11.1% jump over the first half of the previous year.
Crucially, digital sales are outstripping the broader physical retail market. Total U.S. retail sales—comprising both online channels and traditional brick-and-mortar storefronts—grew by a modest 6.7% year-over-year in Q2 2026, roughly half the growth rate of ecommerce. Consequently, ecommerce’s share of total retail continued its upward trajectory, climbing to 17.1% from 16.3% a year earlier. Analysts point out that these figures indicate an online retail market capturing genuine structural momentum, rather than merely riding the coattards of generalized, inflation-driven consumer spending surges.
However, industry experts advise viewing the headline numbers through a nuanced lens. The Census Bureau’s retail metrics remain unadjusted for inflation, meaning that rising price tags account for a portion of the nominal revenue expansion. Furthermore, calendar shifts played a notable role in the Q2 spike; Amazon’s strategic decision to move its blockbuster Prime Day event into June significantly accelerated shopping activity, effectively pulling billions of dollars in online consumer spending forward from the third quarter into the second.
Chronology: From Pandemic Disruption to 2026 Acceleration
To understand the weight of the 2026 data, one must examine the tumultuous trajectory of digital retail over the past seven years. The landscape was fundamentally altered by the global public health crisis, transforming online shopping from a convenient alternative into an absolute necessity.
The Pandemic Shockwave (2019–2022)
The seeds of the digital retail boom were sown in late 2019. Reports of the first novel coronavirus cases emerged in China during the waning weeks of Q4 2019—a quarter that saw U.S. retail ecommerce sales jump 16.2% year-over-year, hitting $150.2 billion.
As the virus crossed borders and governments implemented strict lockdowns, closures, and social distancing mandates, physical retail ground to a halt. Ecommerce instantly became the primary lifeline for locked-down consumers seeking goods ranging from household essentials to entertainment.
| Quarter | Ecommerce Sales | QoQ Growth | YoY Growth |
|---|---|---|---|
| 2019 Q2 | $135.5B | 4.10% | 10.20% |
| 2019 Q3 | $144.1B | 6.30% | 14.60% |
| 2019 Q4 | $150.2B | 4.20% | 16.20% |
| 2020 Q1 | $156.9B | 4.40% | 20.50% |
| 2020 Q2 | $208.1B | 32.60% | 53.50% |
| 2020 Q3 | $212.4B | 2.00% | 47.30% |
| 2020 Q4 | $217.2B | 2.30% | 44.50% |
| 2021 Q1 | $227.9B | 5.00% | 45.30% |
| 2021 Q2 | $236.0B | 3.50% | 13.40% |
| 2021 Q3 | $232.2B | -1.60% | 9.30% |
| 2021 Q4 | $239.8B | 3.30% | 10.40% |
| 2022 Q1 | $244.0B | 1.70% | 7.00% |
| 2022 Q2 | $248.0B | 1.60% | 5.10% |
As illustrated by the data, Q2 2020 experienced an unprecedented, jaw-dropping 53.5% year-over-year surge, pushing quarterly online sales past the $200 billion mark for the first time. For the subsequent three quarters, year-over-year growth hovered comfortably above 40%.
Yet, this hyper-accelerated trajectory could not last forever. By Q2 2022, as society reopened and consumers returned to physical malls, restaurants, and entertainment venues, annual U.S. ecommerce growth crashed back down to earth, slowing to a modest 5.1%.
The Gradual Climb and 2025 Acceleration
Following the post-pandemic hangover, digital retail entered a prolonged period of single-digit, stabilizing growth. Throughout 2023 and 2024, online merchants adjusted to supply chain normalizations, changing consumer debt levels, and shifting macroeconomic headwinds.
The turning point toward our current reality occurred quietly in 2025. Online sales growth began a steady, deliberate re-acceleration: posting 5.0% year-over-year growth in Q2 2025, ticking up to 5.3% in Q3, and reaching 5.9% in Q4. This consistent upward trajectory served as the runway for the double-digit breakthroughs observed throughout the first half of 2026.
| Quarter | Ecommerce Sales | QoQ Growth | YoY Growth |
|---|---|---|---|
| 2025 Q2 | $303.3B | 1.9% | 5.0% |
| 2025 Q3 | $310.8B | 2.5% | 5.3% |
| 2025 Q4 | $318.0B | 2.3% | 5.9% |
| 2026 Q1 | $327.9B | 3.1% | 10.1% |
| 2026 Q2 | $340.2B | 3.8% | 12.2% |
Supporting Data: Dissecting Category-Level Performance
While a 12.2% headline growth figure for Q2 2026 paints a picture of uniform industry health, a deeper dive into product categories reveals a fragmented marketplace. Performance varied drastically depending on what consumers were buying.
Furthermore, retail analysts emphasize a critical distinction: a category’s percentage growth rate does not necessarily reflect its monetary contribution to overall ecommerce expansion.
Consider the stark contrast between percentage gains and absolute dollar additions:
- Clothing and accessories, a massive staple of online shopping, grew by a sluggish 3.8% year-over-year in Q2 2026. However, because of its colossal market baseline, that modest percentage translated into an additional $592 million in sales.
- Health and personal care products surged at more than twice that rate—posting a healthy 9.3% year-over-year growth rate—yet this only added $220 million to the digital economy due to its smaller base.
- General merchandise, spanning warehouse clubs, department store inventories, and broad multi-category online giants, exploded with a 21.6% year-over-year growth rate, single-handedly generating roughly $8.3 billion in new sales volume.
Q2 2026 Category Breakdown Comparison
| Category | Q2 2025 Ecommerce | Q2 2026 Ecommerce | Growth (%) | Added Sales ($) |
|---|---|---|---|---|
| General merchandise | $38.5B | $46.9B | 21.60% | +$8.3B |
| Building materials & garden | $12.3B | $13.7B | 11.50% | +$1.4B |
| Food & beverage | $9.6B | $10.3B | 8.10% | +$775M |
| Sporting goods, hobby, books | $3.3B | $4.0B | 20.40% | +$673M |
| Clothing & accessories | $15.5B | $16.1B | 3.80% | +$592M |
| Health & personal care | $2.4B | $2.6B | 9.30% | +$220M |
As the data proves, a relatively slow-growing category (such as general merchandise or building materials) can represent a massive and rapidly expanding financial market. Conversely, a fast-growing category may register impressive percentages while contributing relatively few actual sales dollars. Market size, therefore, dictates true economic impact.
Official Responses and Market Perspectives
Retail executives, economists, and marketplace analysts have greeted the U.S. Census Bureau’s latest numbers with a mixture of cautious optimism and strategic re-evaluation.
Industry analysts note that individual retail businesses can diverge sharply from broad category averages. Variances in product mix, pricing models, multi-channel marketplace strategies, regional geography, and targeted consumer demographics mean that a merchant’s personal P&L statement may look vastly different from macroeconomic trends.
Logistics providers and retail tech firms have also weighed in on the operational implications of the 2026 rebound. With digital sales accounting for an ever-larger piece of the pie (17.1% and climbing), supply chain operators are monitoring capacity constraints closely. Executives point out that the unexpected June scheduling of major promotional calendar events like Prime Day forced logistics networks to handle peak-season volume pressures months ahead of the traditional Q4 holiday rush, testing warehouse automation and last-mile delivery resilience.
Implications: What the 2026 Rebound Means for the Future
The return to double-digit ecommerce growth raises vital strategic questions for retailers, brands, and institutional investors alike.
1. Investment and Capital Allocation
A healthier, steadily growing ecommerce market provides the financial justification needed to unlock capital expenditure. For years following the post-pandemic cooldown, brands adopted conservative fiscal postures, cutting back on speculative inventory builds, pulling back on aggressive customer acquisition spend, and deferring technology upgrades. The sustained strength seen across the first half of 2026 may greenlight renewed investments in:
- Advanced automated inventory management and predictive forecasting systems.
- Omnichannel customer acquisition tools driven by predictive artificial intelligence.
- Fulfillment capacity expansion to reduce delivery windows and mitigate supply chain bottlenecks.
2. Strategic Channel Management
The stark divergence in category performance proves that a rising digital tide does not lift all boats equally. Brands operating in slower-moving niches (such as apparel and accessories) must lean heavily on differentiation, brand loyalty, and personalized shopping experiences to combat sluggish baseline growth. Meanwhile, categories riding explosive waves—such as general merchandise and home/building materials—must scale rapidly to capture shifting consumer demand without letting fulfillment costs erode margins.
3. The Horizon: Outlier or New Baseline?
The immediate test for the U.S. retail ecosystem lies in the upcoming quarters. Industry stakeholders are watching to see whether 2026 marks the beginning of a sustained, long-term acceleration in digital consumption, or if it will ultimately be categorized as a statistical anomaly driven by unadjusted inflationary pressures and aggressive promotional calendar shifts (such as the early Amazon Prime event).
Ultimately, while the macroeconomic data points to an online retail sector regaining its stride, the underlying economics remain intensely competitive and uneven. For businesses navigating this landscape, understanding the intricate split between percentage growth and dollar contribution will be the ultimate differentiator between thriving and merely surviving in the modern digital marketplace.