For decades, the Initial Public Offering (IPO) has been held up as the holy grail of startup milestones. It is the textbook definition of success for founders, the grand finale for venture capitalists, and the golden ticket for early employees. On paper, ringing the bell on Wall Street transforms paper wealth into liquid capital, validating a decade of grueling labor and immense risk.
Yet, beneath the celebratory confetti lies a structural reality that the tech ecosystem rarely talks about openly: the IPO date is not the liquidity date.
While media headlines herald the day a company rings the opening bell, the actual journey of monetizing those shares stretches across years of lock-up periods, regulated trickle-outs, and market volatility. When you trace the timeline from the very first check written by a seed investor to the final share distributed out of a fund, the modern tech IPO is an endurance test spanning well over a decade.
For founders and investors weighing a lucrative M&A buyout against the unpredictable horizon of public markets, the math demands a sobering realization: to justify the risks, dilution, and agonizing wait, an IPO must realistically be worth two to three times the value of a solid cash acquisition offer on the table today.
Main Facts: The Reality of the Modern Cap Table
The anatomy of venture capital dictates a fundamental mismatch in timelines. According to data from PitchBook, the median time it takes for a tech company to reach an IPO has stretched to 11.5 years. Meanwhile, the standard lifecycle of a venture capital fund is tightly bound to a 10-year term.
This temporal friction creates immense pressure. Roughly 45% of today’s tech "unicorns" have already languished inside VC portfolios for nine years or more, well past the standard expiration date of the funds that birthed them. Furthermore, public listings are remarkably rare. In the first half of 2025, out of 649 US venture-backed exits, only 27 were public listings—accounting for a mere 4% of total exits. Acquisitions and buyouts dominate the landscape, soaking up 96% of exit activity.
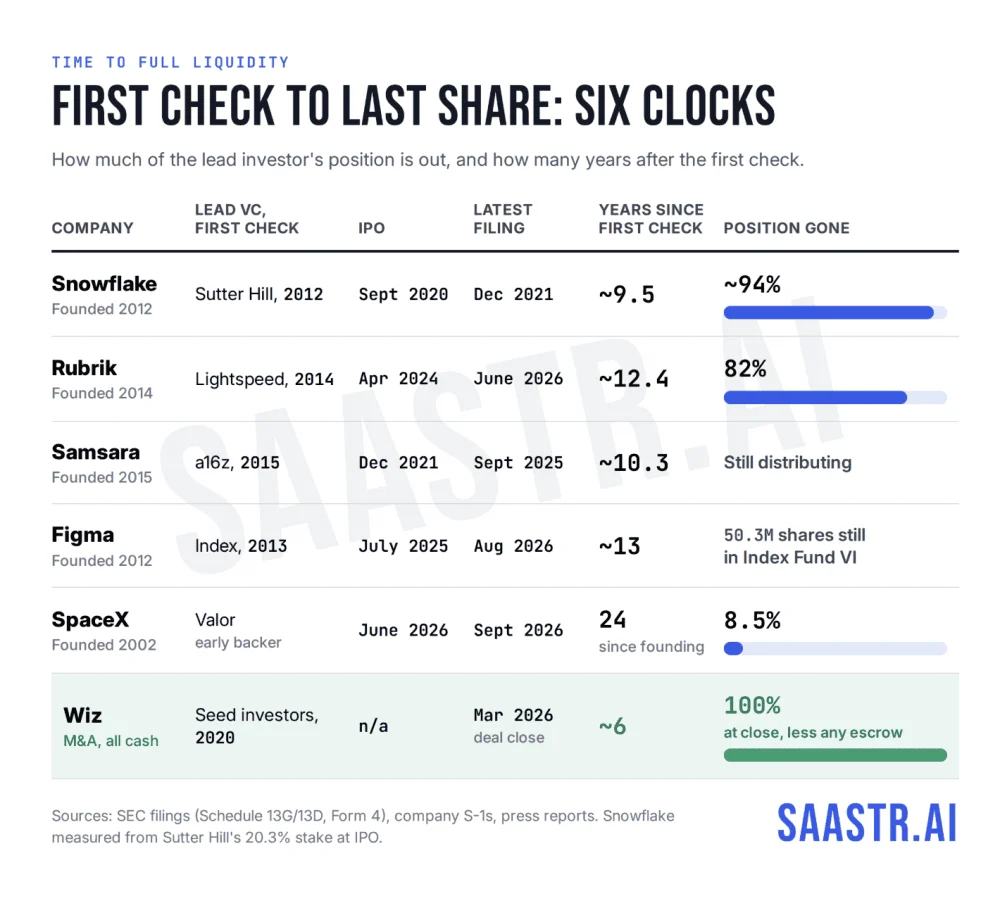
When a company does manage to break through to the public markets, the illusion of instant wealth evaporates quickly. Take SpaceX as a glaring example. Founded in 2002, the aerospace giant finally priced its shares at $135 and began trading publicly on June 12, 2026—a grueling 24-year gestation period. Rather than a standard 180-day lock-up cliff, SpaceX implemented a staggered release schedule. Months after going public, private investors and early funds found that roughly 40% of their shares were distributable, leaving the vast majority locked up and subject to the violent gravitational pull of public market corrections.
Chronology: From the First Check to the Last Share
To truly understand how long capital remains trapped, one must map out the timeline across several modern IPO milestones. The path from inception to complete liquidity is rarely a sprint; it is an ultra-marathon.
Snowflake: The Best-Case Scenario
Snowflake represents one of the fastest and cleanest examples of near-complete VC liquidity in the modern era. It took the company eight years to reach an IPO, followed by an aggressive 15-month wind-down window that allowed lead investors to drive their remaining holdings down to just 1.3%. Yet, even in this gold-standard case, the entire cycle—from the initial seed check to structural exit—hovered around 9.5 years.
Rubrik: Over a Decade in the Making
Rubrik paints a more typical picture. Lightspeed, an early backer, sat at 82% out roughly 26 months after the IPO, which itself occurred 12.4 years after their first check. At a steady distribution pace, cleaning out the final 18% of their holdings requires another year and a half.
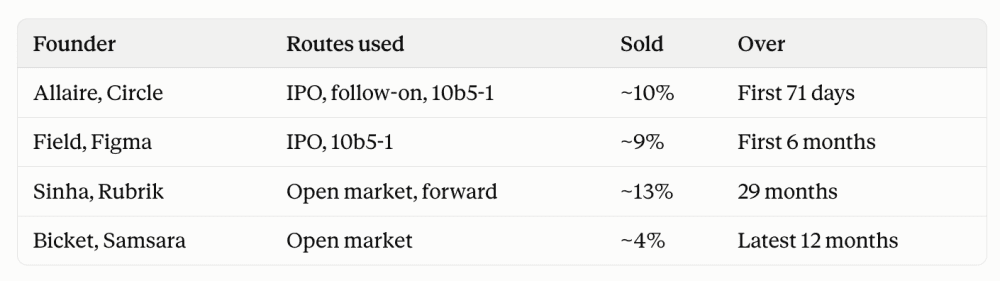
Meanwhile, co-founder Bipul Sinha maintained tight control of his equity. Holding over 12.3 million shares pre-IPO, Sinha still directly retained about 87% of his Class B shares as of September 2026—nearly 12.7 years after founding the company—turning to structured financial instruments like prepaid variable forwards just to extract a fraction of liquidity.
Samsara and Figma: The Slow Trickle of Insiders
- Samsara: Founded in 2015, Samsara went public in December 2021. Yet, institutional distributions ran deep into late 2025—a full decade after the first check. Co-founder John Bicket, 11 years into the journey, reported selling a mere 4% of his massive stake per year.
- Figma: After its highly publicized journey, CEO Dylan Field sold a modest slice of his holdings around the IPO and pre-unlock windows, retaining roughly 90% of his original stake a year into public life. Institutional funds like Index Ventures still held over 50 million shares, demonstrating that early backers remain deeply tethered to the stock long after trading commences.
Supporting Data: M&A Speed vs. IPO Friction
In stark contrast to the drawn-out purgatory of public listings, Merger and Acquisition (M&A) activity offers a radically compressed timeline to liquidity.
Consider the landmark acquisition of Wiz. Founded in 2020, the cloud-security powerhouse agreed to an all-cash $32 billion acquisition by Google signed in March 2025. Despite facing a rigorous 12-month global regulatory review spanning the United States, European Union, Australia, and Israel, the deal successfully closed in March 2026.
Within six years of founding, founders, seed investors, and early employees were all paid out in cold, hard cash on the exact same day. While M&A deals do carry minor friction—such as standard indemnification escrows (averaging 10%, or significantly lower when Representations and Warranties Insurance is deployed)—the speed and certainty of a cash buyout dwarf the execution risk of an IPO.
Furthermore, secondary markets and direct tenders are beginning to rewrite the rules for companies staying private longer.
- Anthropic has utilized aggressive, compressed capital structures and rapid secondary liquidity windows for employees.
- Stripe has consistently run employee and shareholder tender offers approximately every six months, completely bypassing traditional public filings and lock-up cliffs.
Yet, for companies choosing the traditional public route, the data shows that secondary participation is creeping into IPO structures. In 2025, only 86.2% of shares in venture-backed IPOs originated directly from the companies themselves—well below the long-term historical average of 91.5%. Existing insiders are increasingly forced to sell portions of their holdings simply to satisfy market demand for float.
Implications: The Math Behind the 3x Rule
When evaluating whether to pursue a massive M&A cash offer or gamble on an uncertain IPO, executives and cap-table stakeholders must run a rigorous financial model. A cash buyout delivers liquidity in 6 to 12 months. An IPO delivers liquidity incrementally over four or more years, subject to the whims of public market sentiment.
To make an IPO mathematically superior to an immediate cash offer, three primary financial variables must be accounted for:
- Compounding Returns: Cash in hand can be reinvested immediately. Assuming a conservative index-like 10% annual return, cash compounds by roughly 1.46x over a four-year horizon. The IPO path must beat this baseline simply to break even.
- Concentrated Risk Premium: Holding a single, locked-up stock while insiders trickle shares into a thin public float carries massive idiosyncratic risk. Factoring in a healthy risk hurdle rate of 20% to 25% pushes the required multiple to between 2.07x and 2.44x.
- Dilution Over Time: Insiders face continuous dilution and lock-up constraints. Factoring in an average 13% reduction at IPO and subsequent annual equity adjustments means a shareholder often retains roughly 77% of their effective stake, requiring the company’s valuation to expand by at least 1.30x just to maintain parity.
When these factors are multiplied together, an IPO must realistically be worth 2x to tie an alternative index-backed strategy, and 2.7x to 3.2x to adequately compensate stakeholders for the sheer risk of public market volatility.
Conclusion: Strategic Takeaways for Founders and VCs
An IPO remains the ultimate Plan A for venture-backed startups, providing unmatched brand validation and institutional scale—Snowflake being a prime testament to this glory. However, founders frequently make the critical error of comparing a guaranteed buyout offer against an expected peak IPO valuation.
As the data from Snowflake, Rubrik, Samsara, and Figma demonstrates, the road from the first seed check to complete portfolio liquidation is a decade-long odyssey characterized by strict lock-ups, regulatory hurdles, and agonizingly slow share distribution.
For leadership teams currently sitting on substantial M&A acquisition interest, the strategic takeaway is clear: do the math carefully. Unless an upcoming public debut can realistically clear a valuation hurdle 2.7 to 3.2 times higher than a concrete cash buyout offer, taking the bird in hand is no longer just the safe choice—it is mathematically the smartest financial decision a cap table can make.