
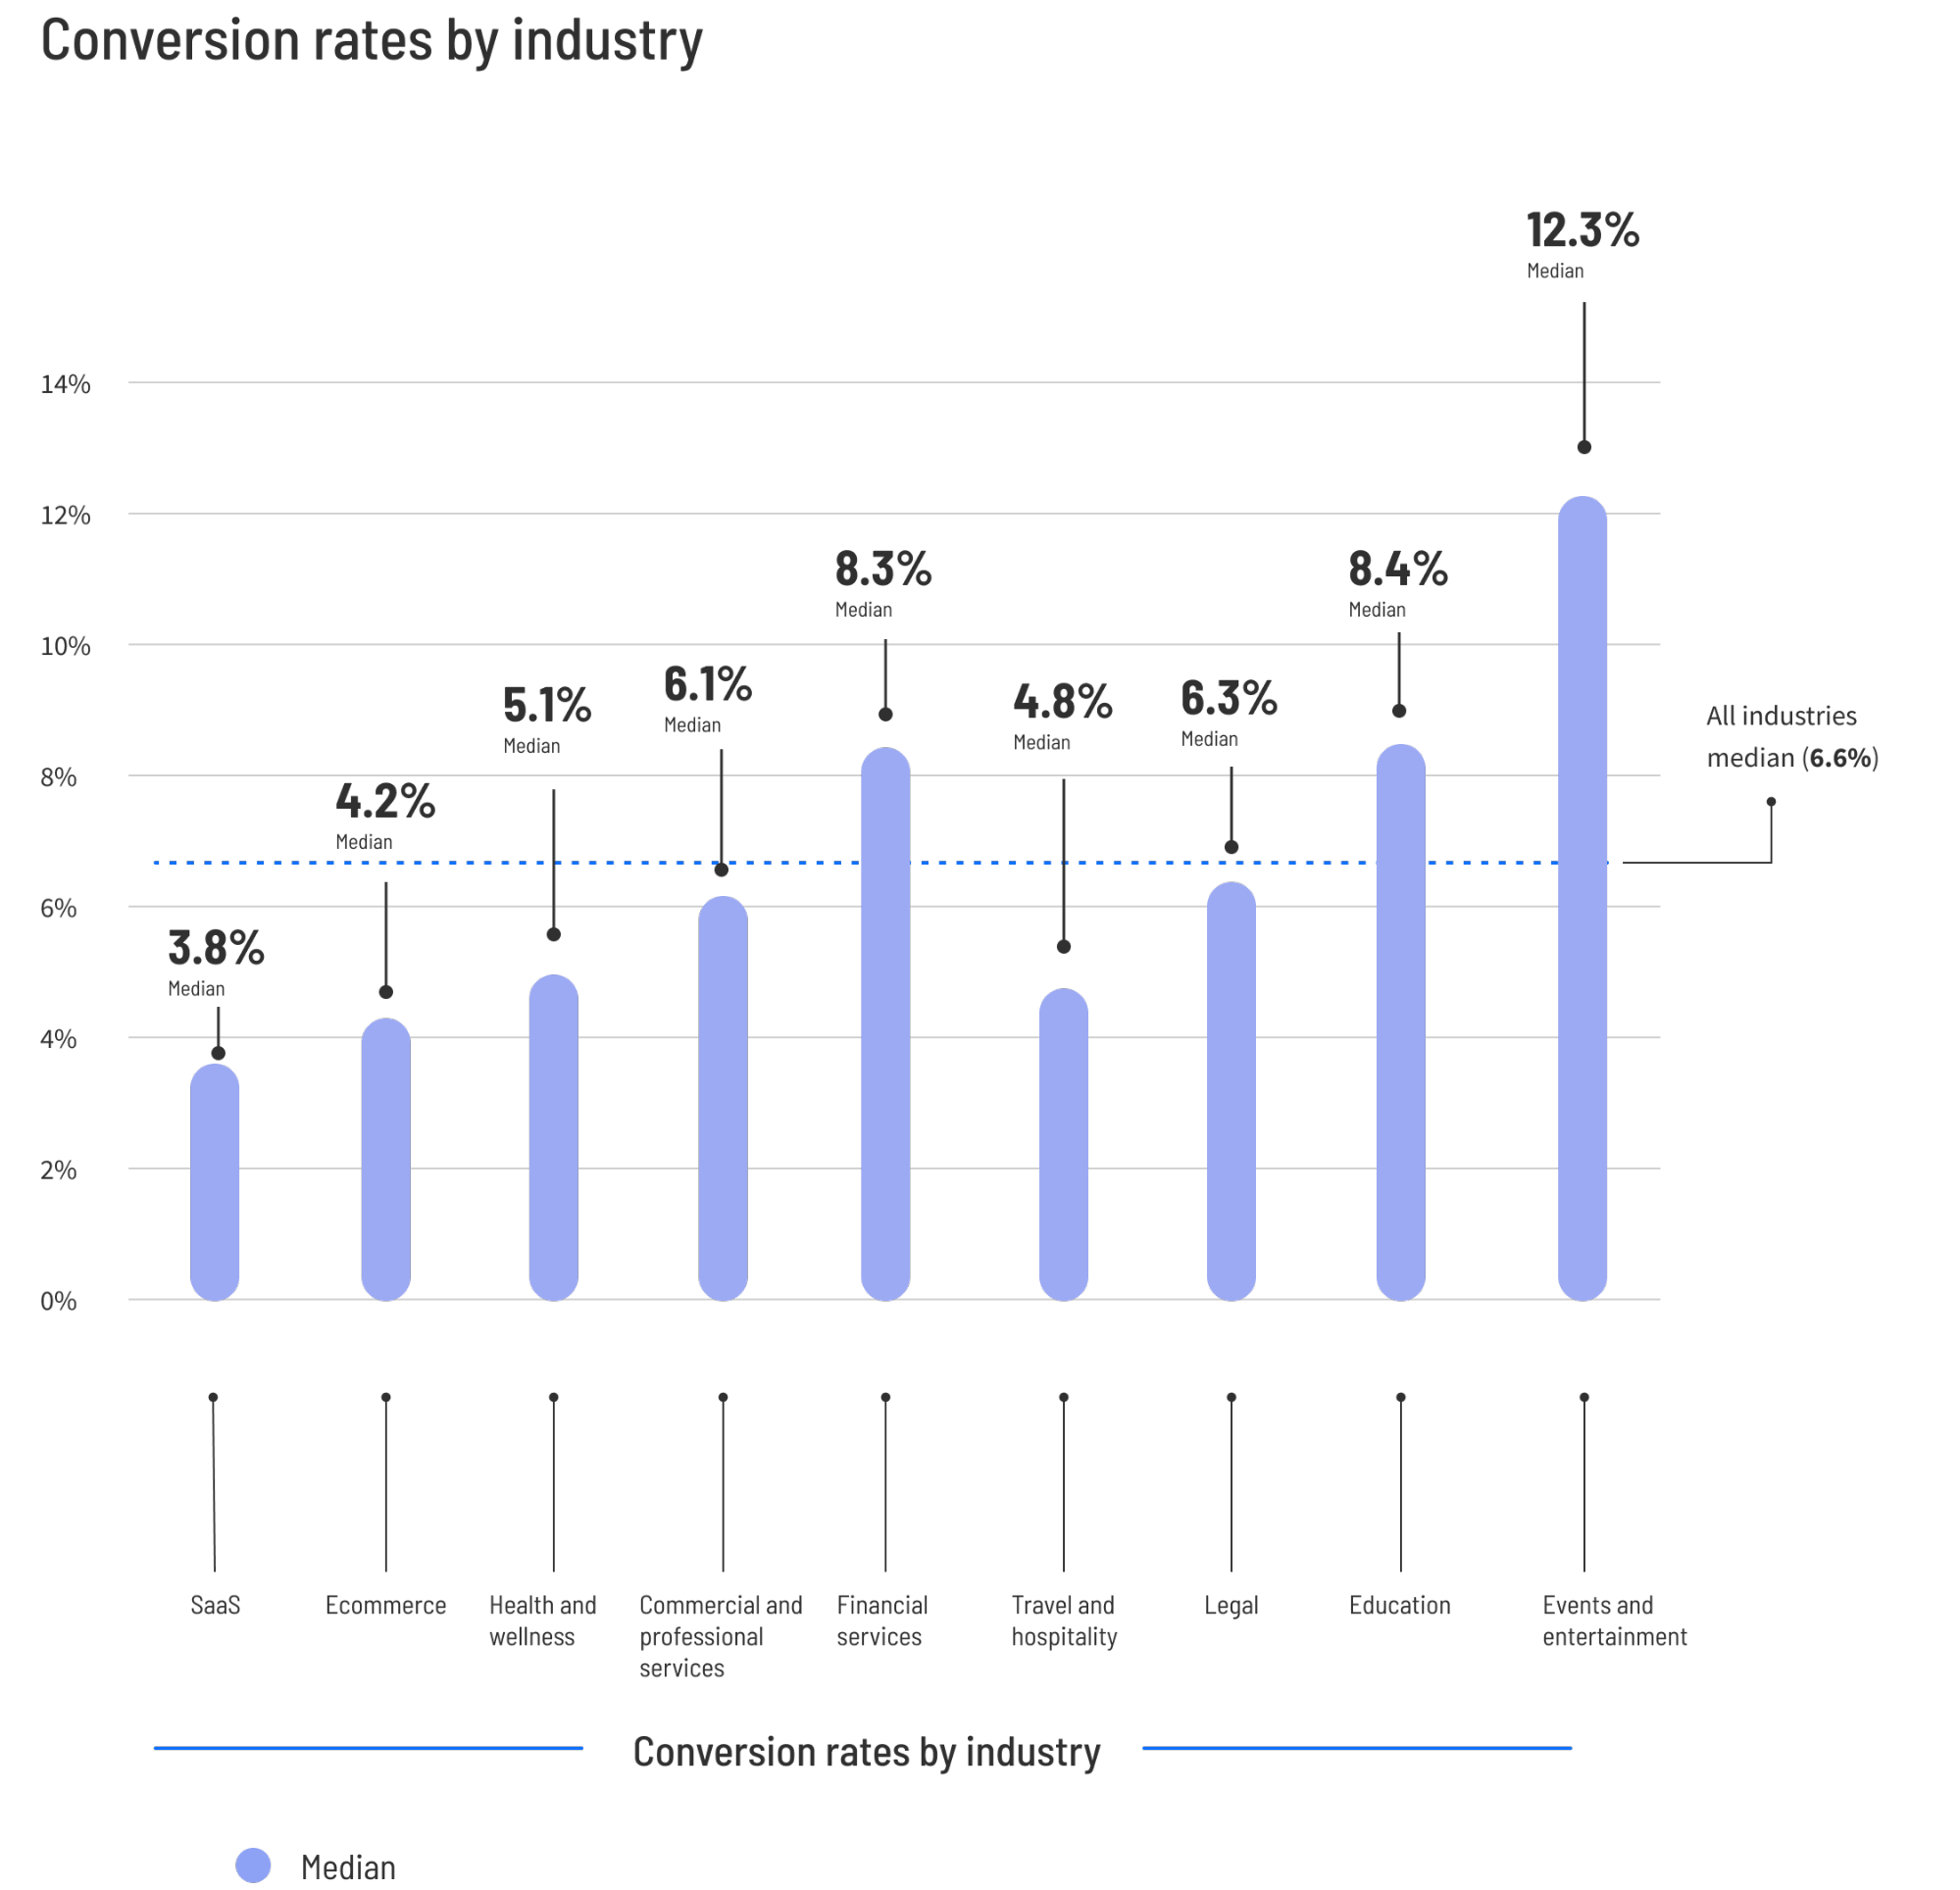
In the high-stakes world of digital marketing, the term "conversion rate" is often treated as a singular, golden metric. Marketers frequently ask, "What is a good conversion rate?" hoping for a universal percentage—a magic number that signals success. However, according to the latest insights from the Unbounce 2024 Conversion Benchmark Report, that search for a one-size-fits-all metric is fundamentally flawed.
Conversion performance is not a static target; it is a dynamic outcome influenced by industry nuances, user intent, and the specific channels through which traffic arrives. With data derived from over 57 million conversions across 41,000 landing pages and 464 million pageviews, the picture of what constitutes "average" is far more complex than the industry has previously assumed.

The Baseline: Understanding the Median vs. The Average
To truly understand performance, we must first address the statistical methodology behind these figures. The industry often conflates "average" with "median," yet they tell very different stories.
If you place a billionaire in a room with ten teachers, the average income in that room is astronomical, skewed by the outlier. The median, however, remains the teacher’s salary—the true middle-of-the-pack reality. Unbounce’s report relies on the median because it avoids the distortion caused by "unicorn" pages that convert at 90% or struggling pages that fail to convert at all.

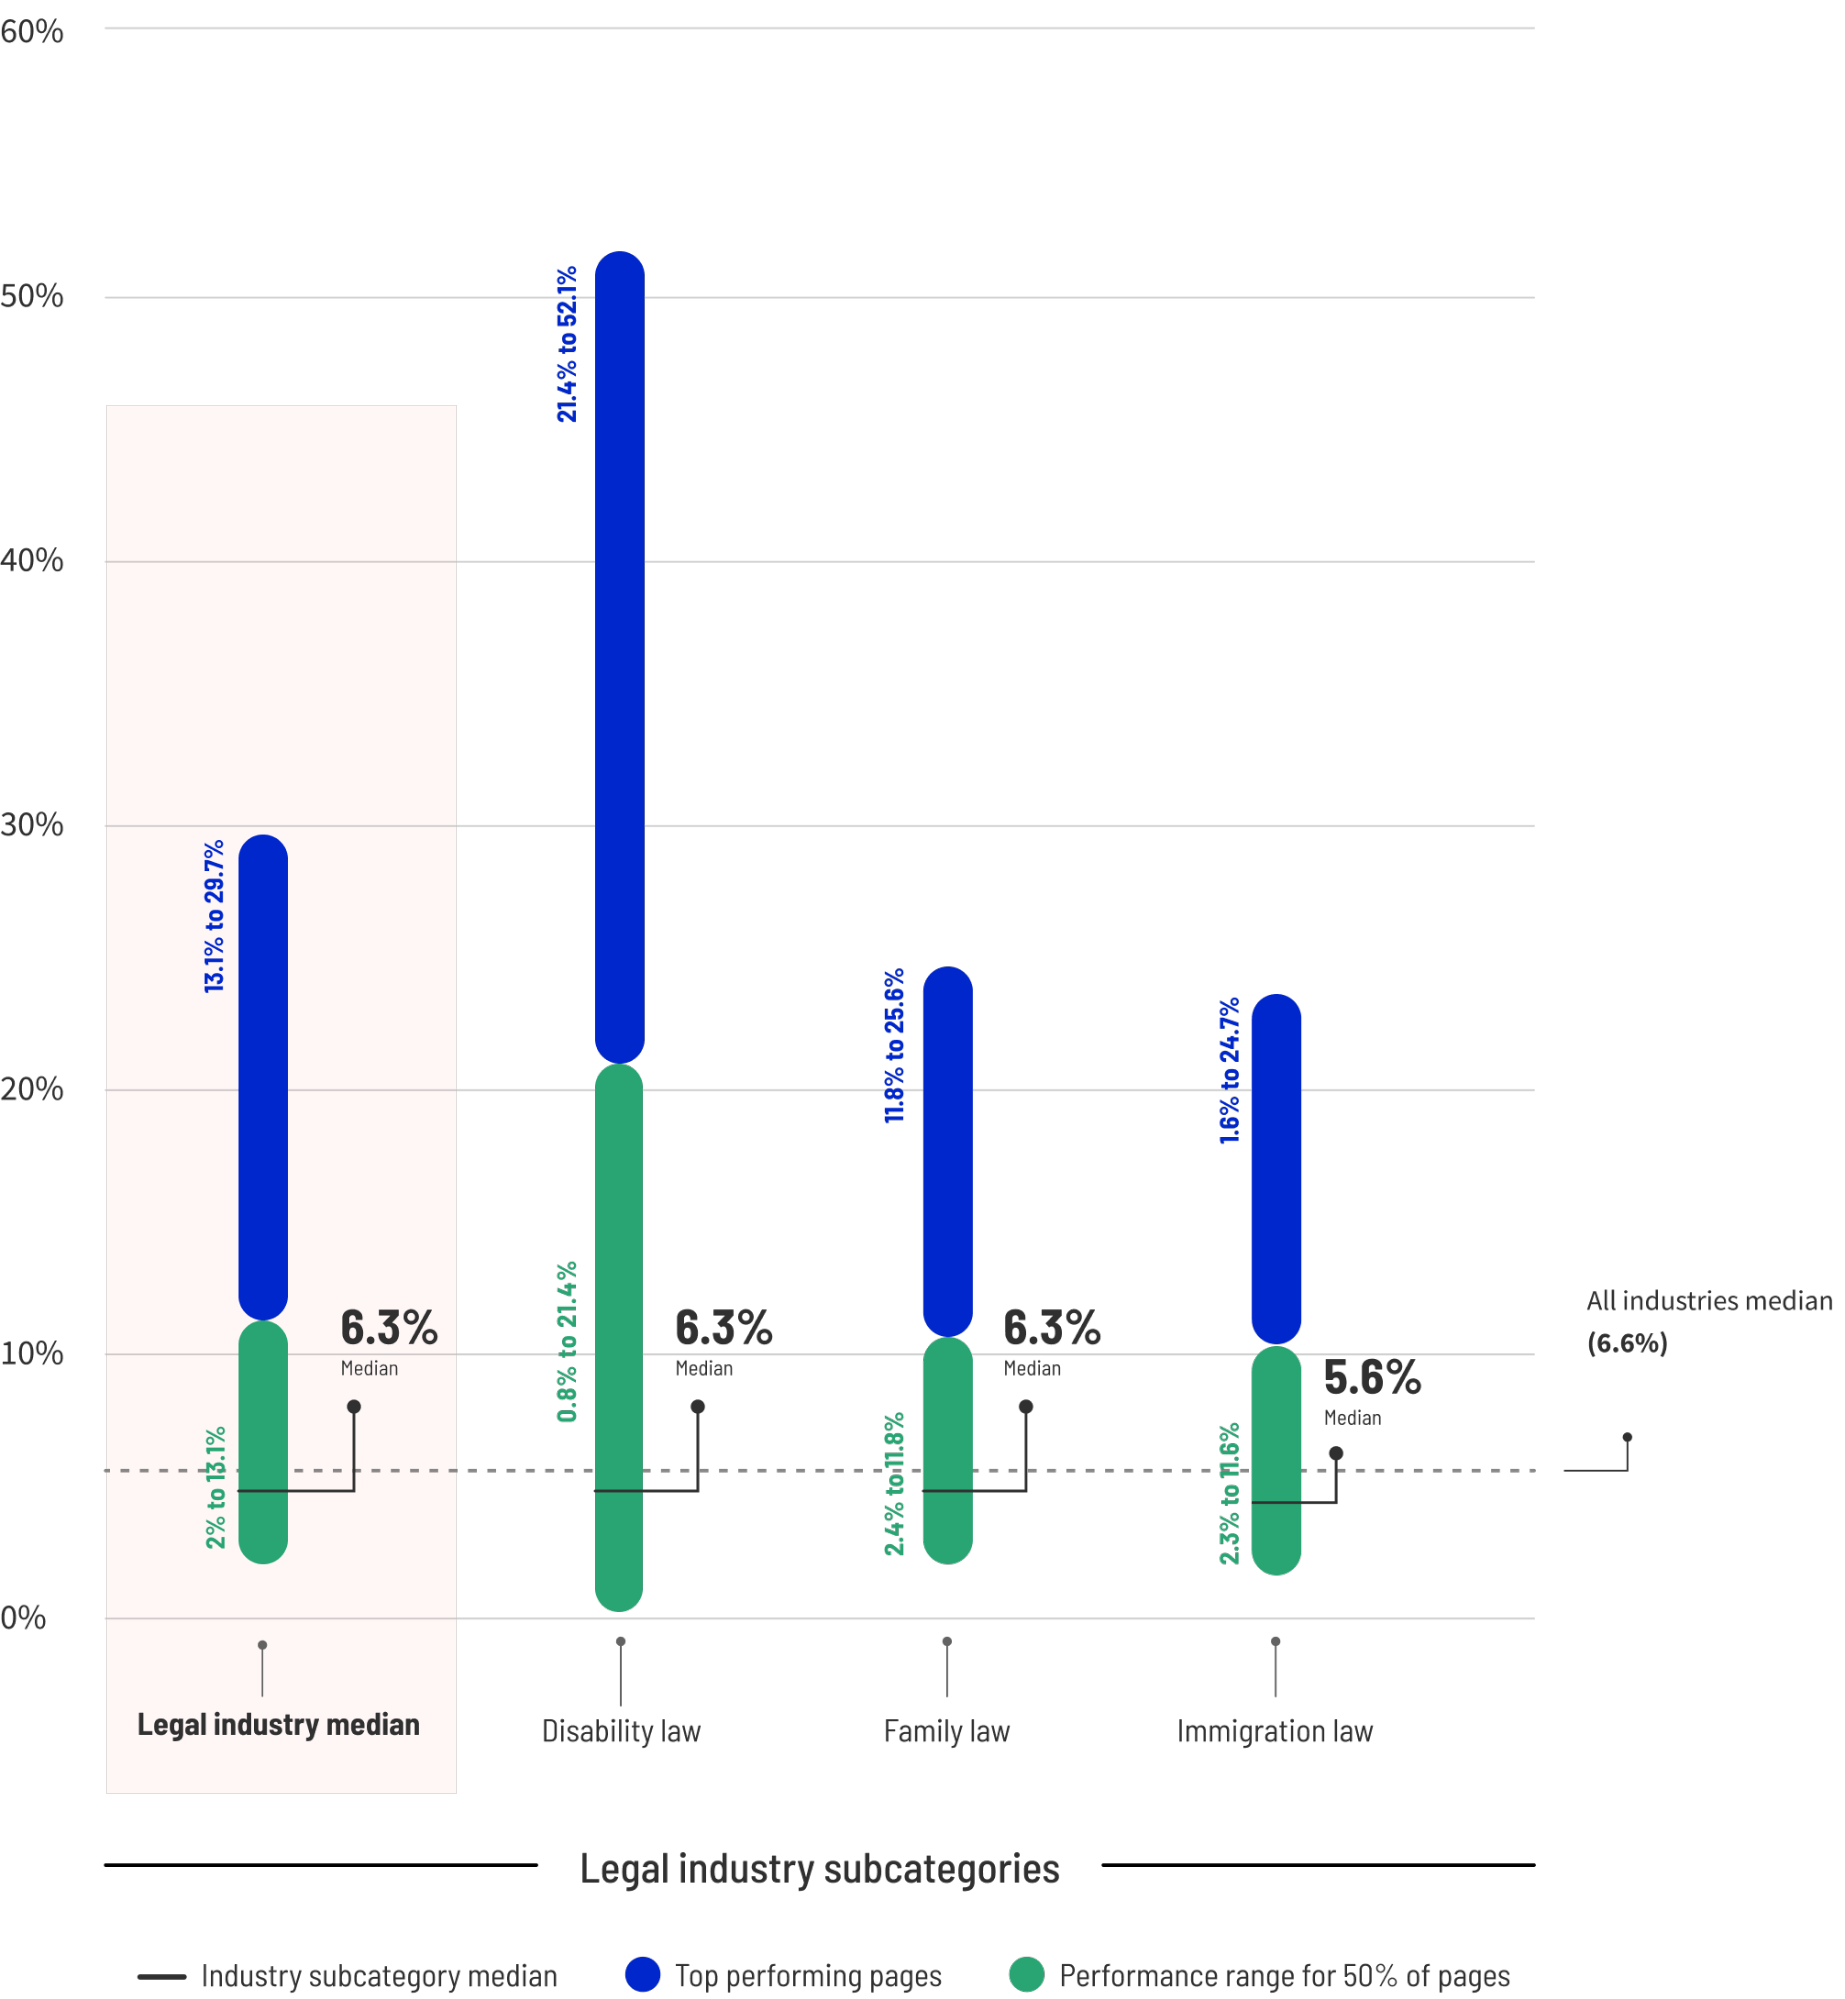
Across all industries, the median conversion rate sits at 6.6%. While this serves as a baseline, it is not a goal. Comparing your performance to this broad number is akin to comparing the average height of a human to the success of a professional basketball player. To achieve true growth, marketers must look to industry-specific benchmarks.
Industry-Specific Performance: A Deep Dive
"Good" is a relative term. To join the top 25% of performers in your field—what experts define as the "good" threshold—you must often exceed the median by a significant margin.
Ecommerce: The Volume Game
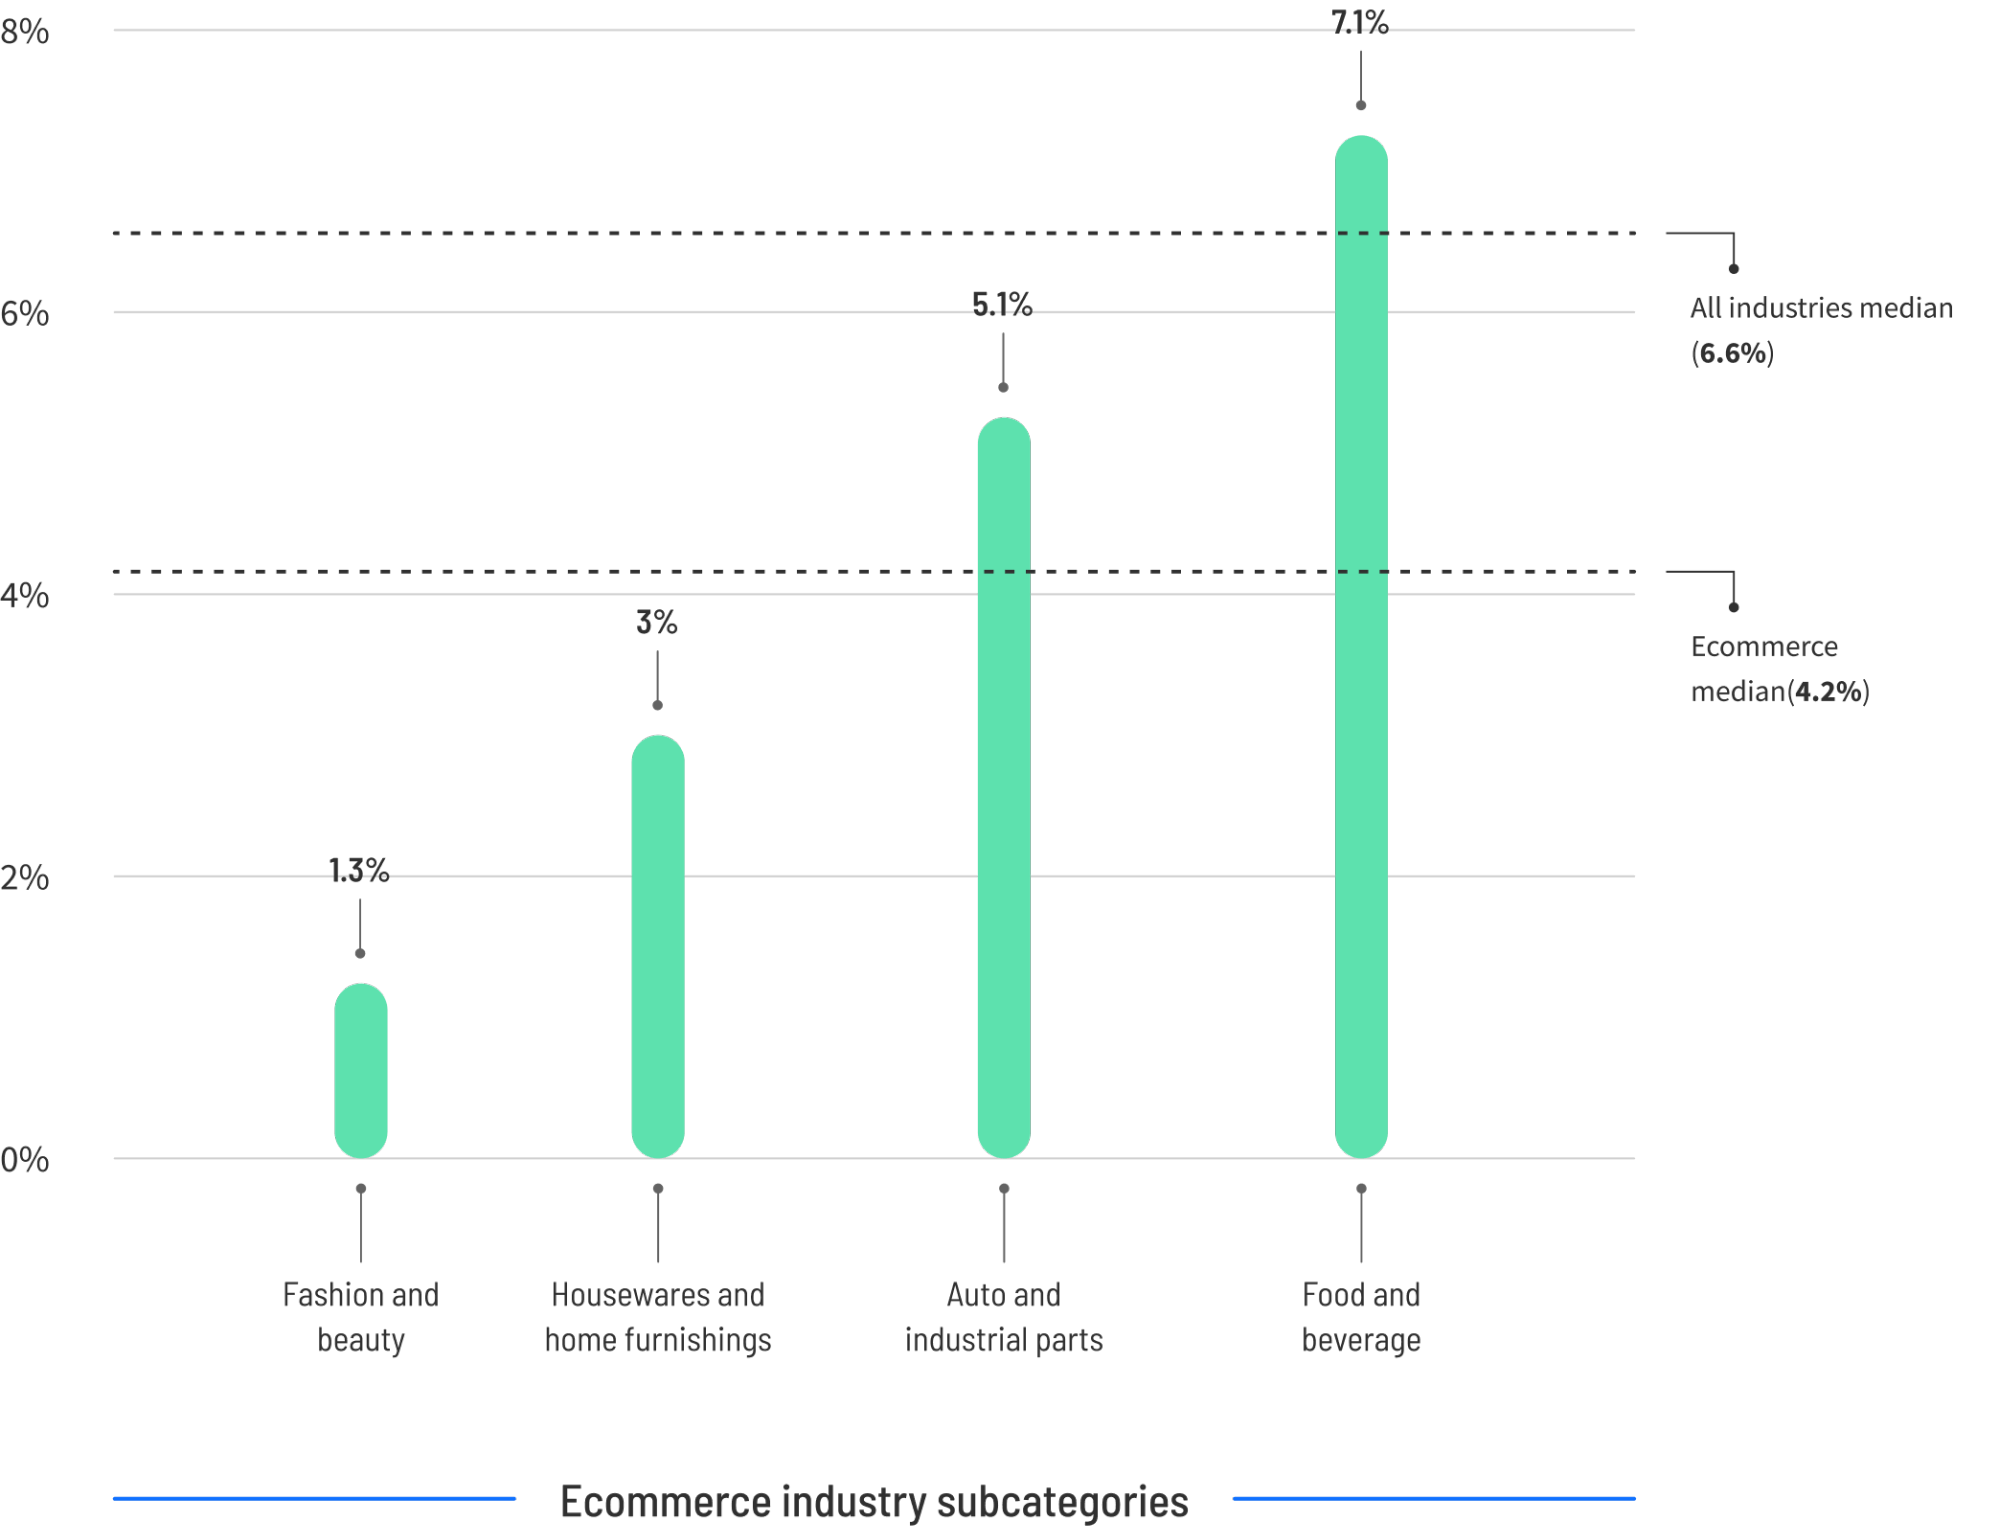
The median conversion rate for ecommerce stands at 4.2%. However, the "good" threshold for top-tier performers jumps to 11.4%. The implications here are massive: for a store receiving 10,000 monthly visitors, increasing a conversion rate from 4.2% to 11.4% could translate to 720 additional orders per month, representing a substantial boost to the bottom line.
SaaS: Navigating Complexity
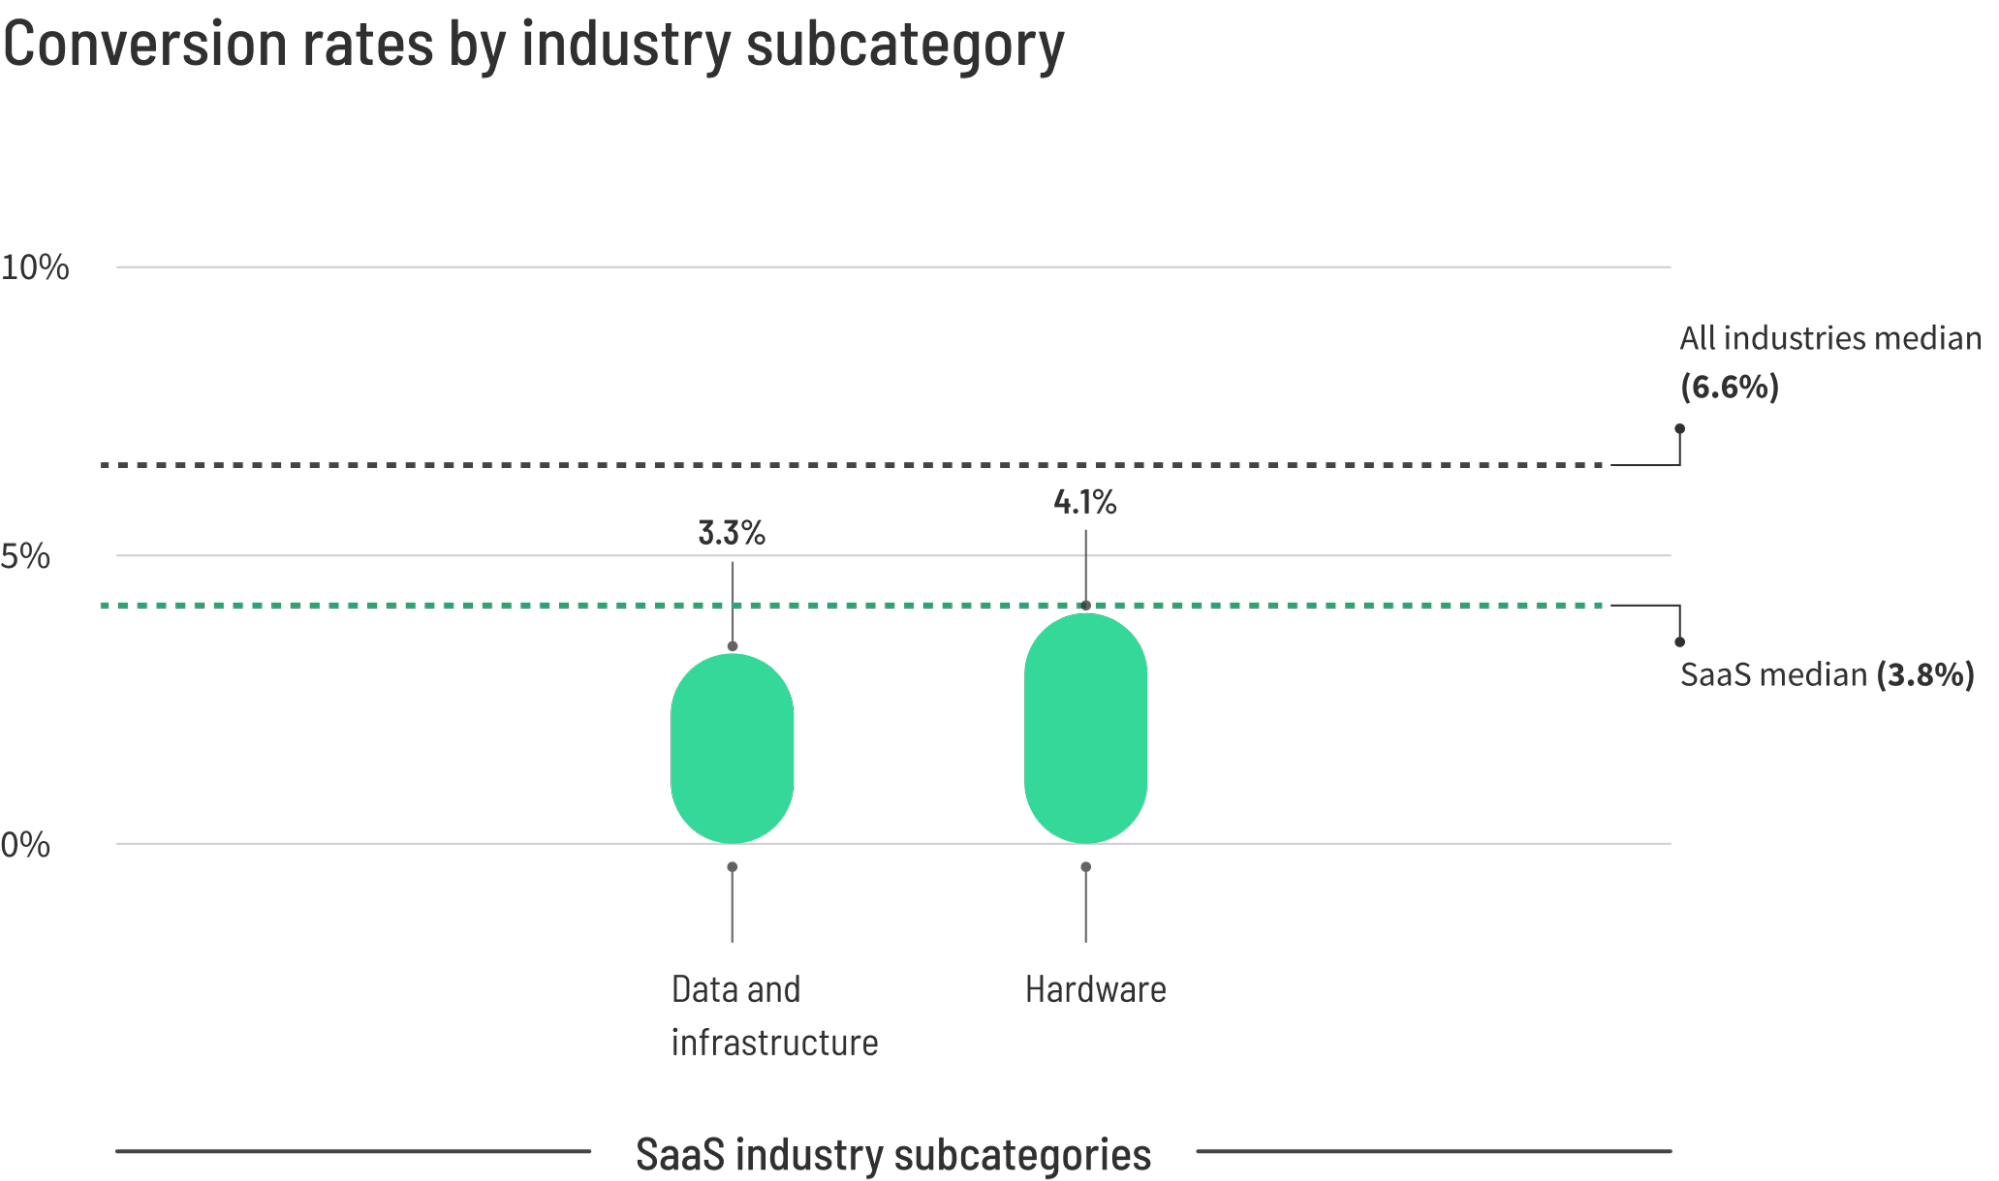
SaaS landing pages face the challenge of explaining complex, high-consideration products. With a median conversion rate of 3.8%, the bar for excellence is high, requiring a 11.6% conversion rate to reach the top quartile. Success in this sector is driven by reducing friction—using no-credit-card trials and clear, pain-point-focused messaging.
Professional Services: The Trust Factor
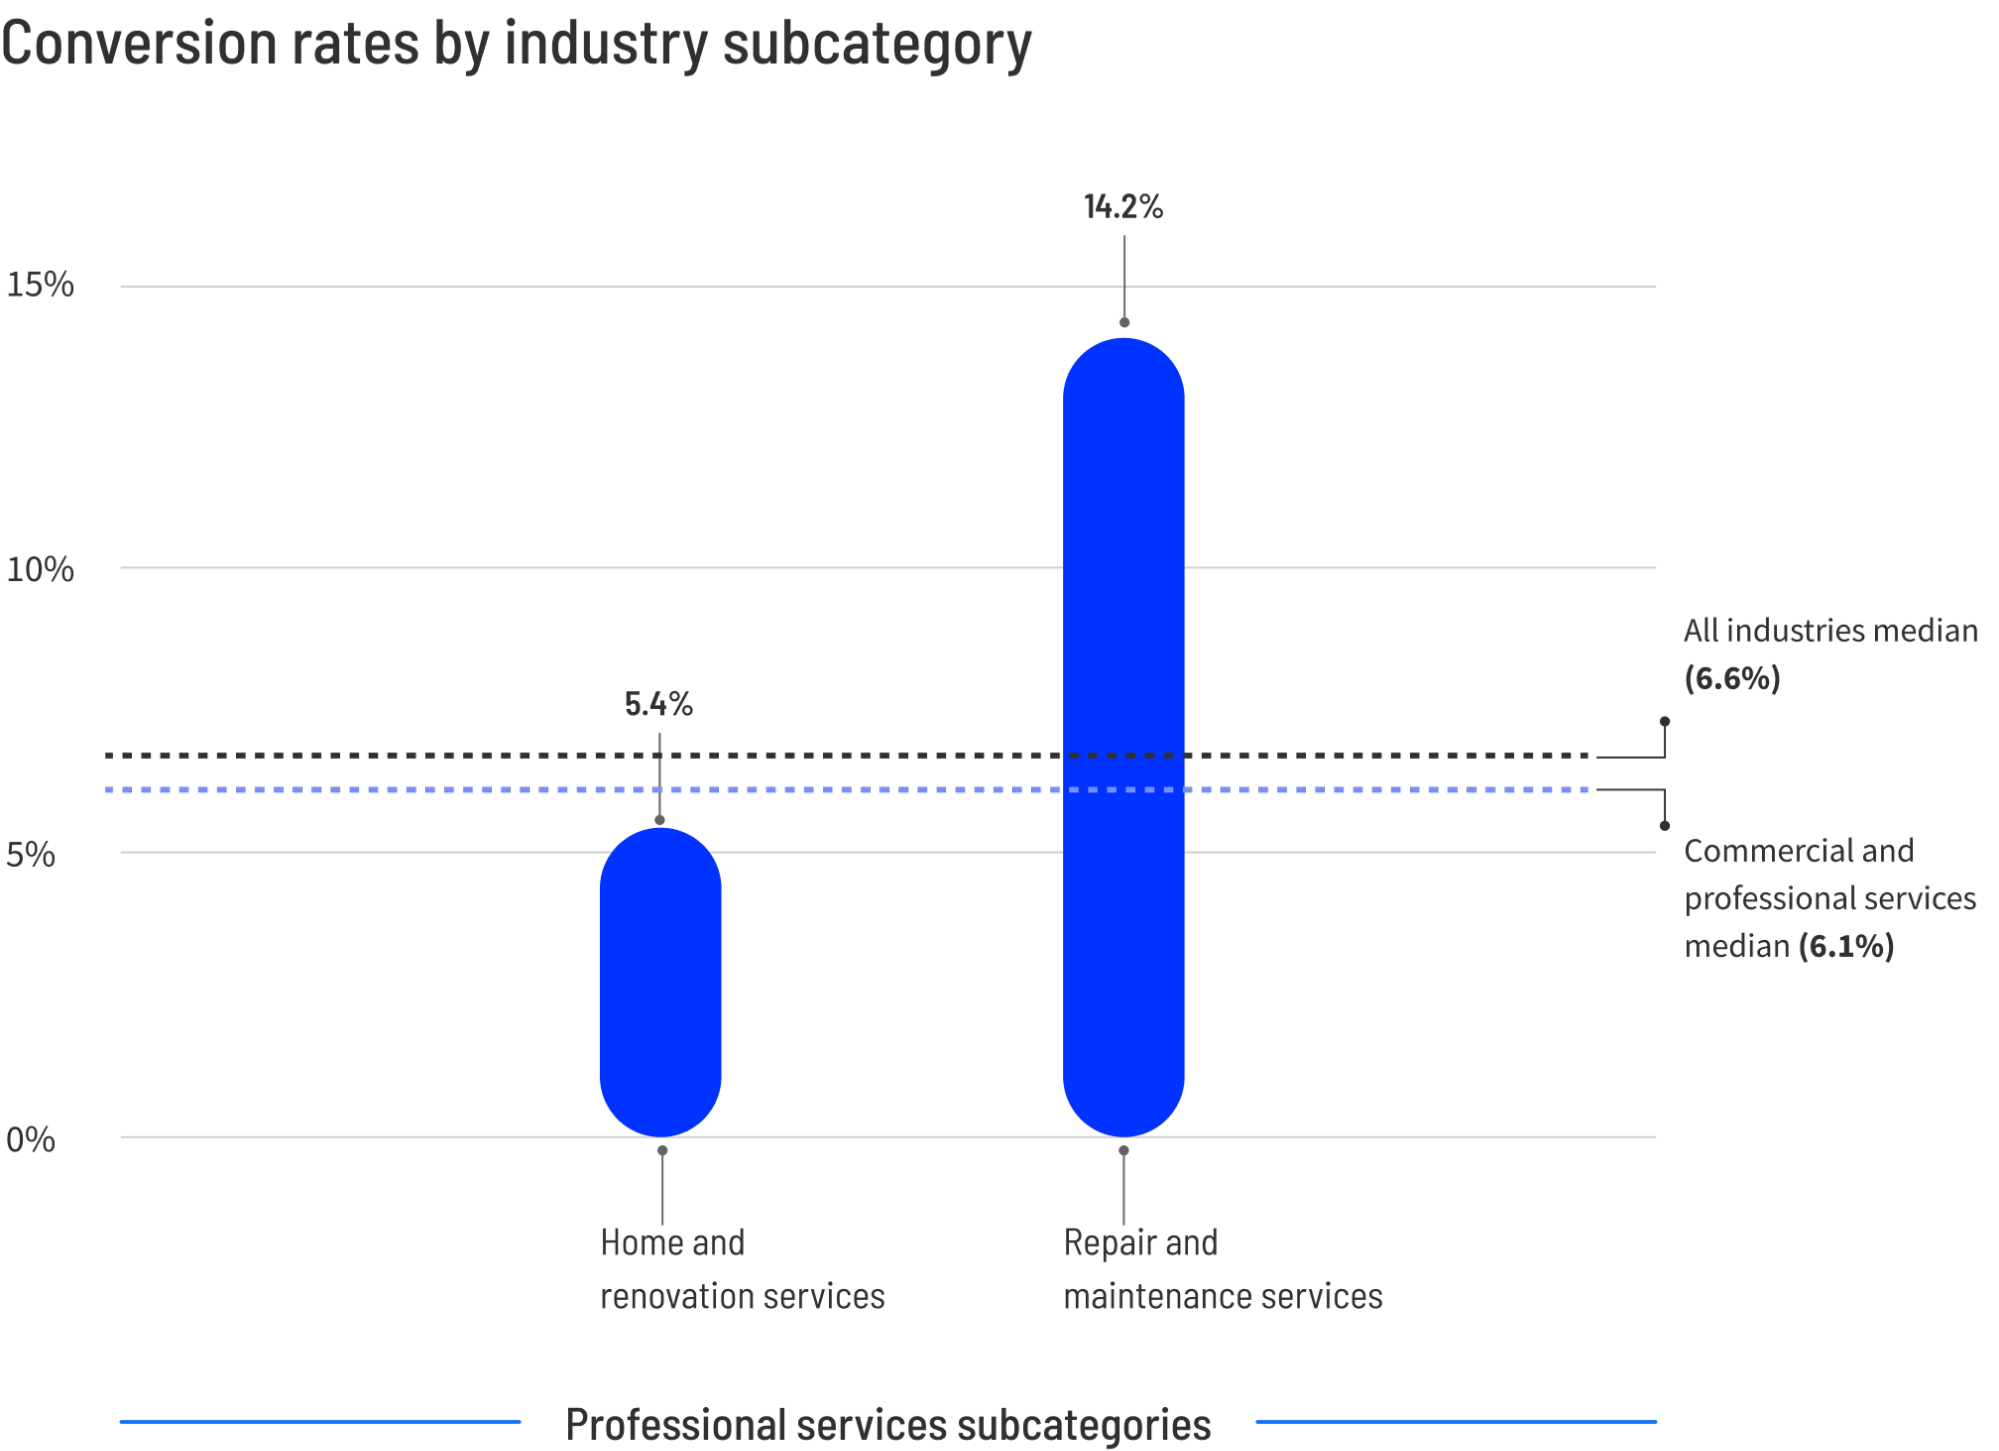
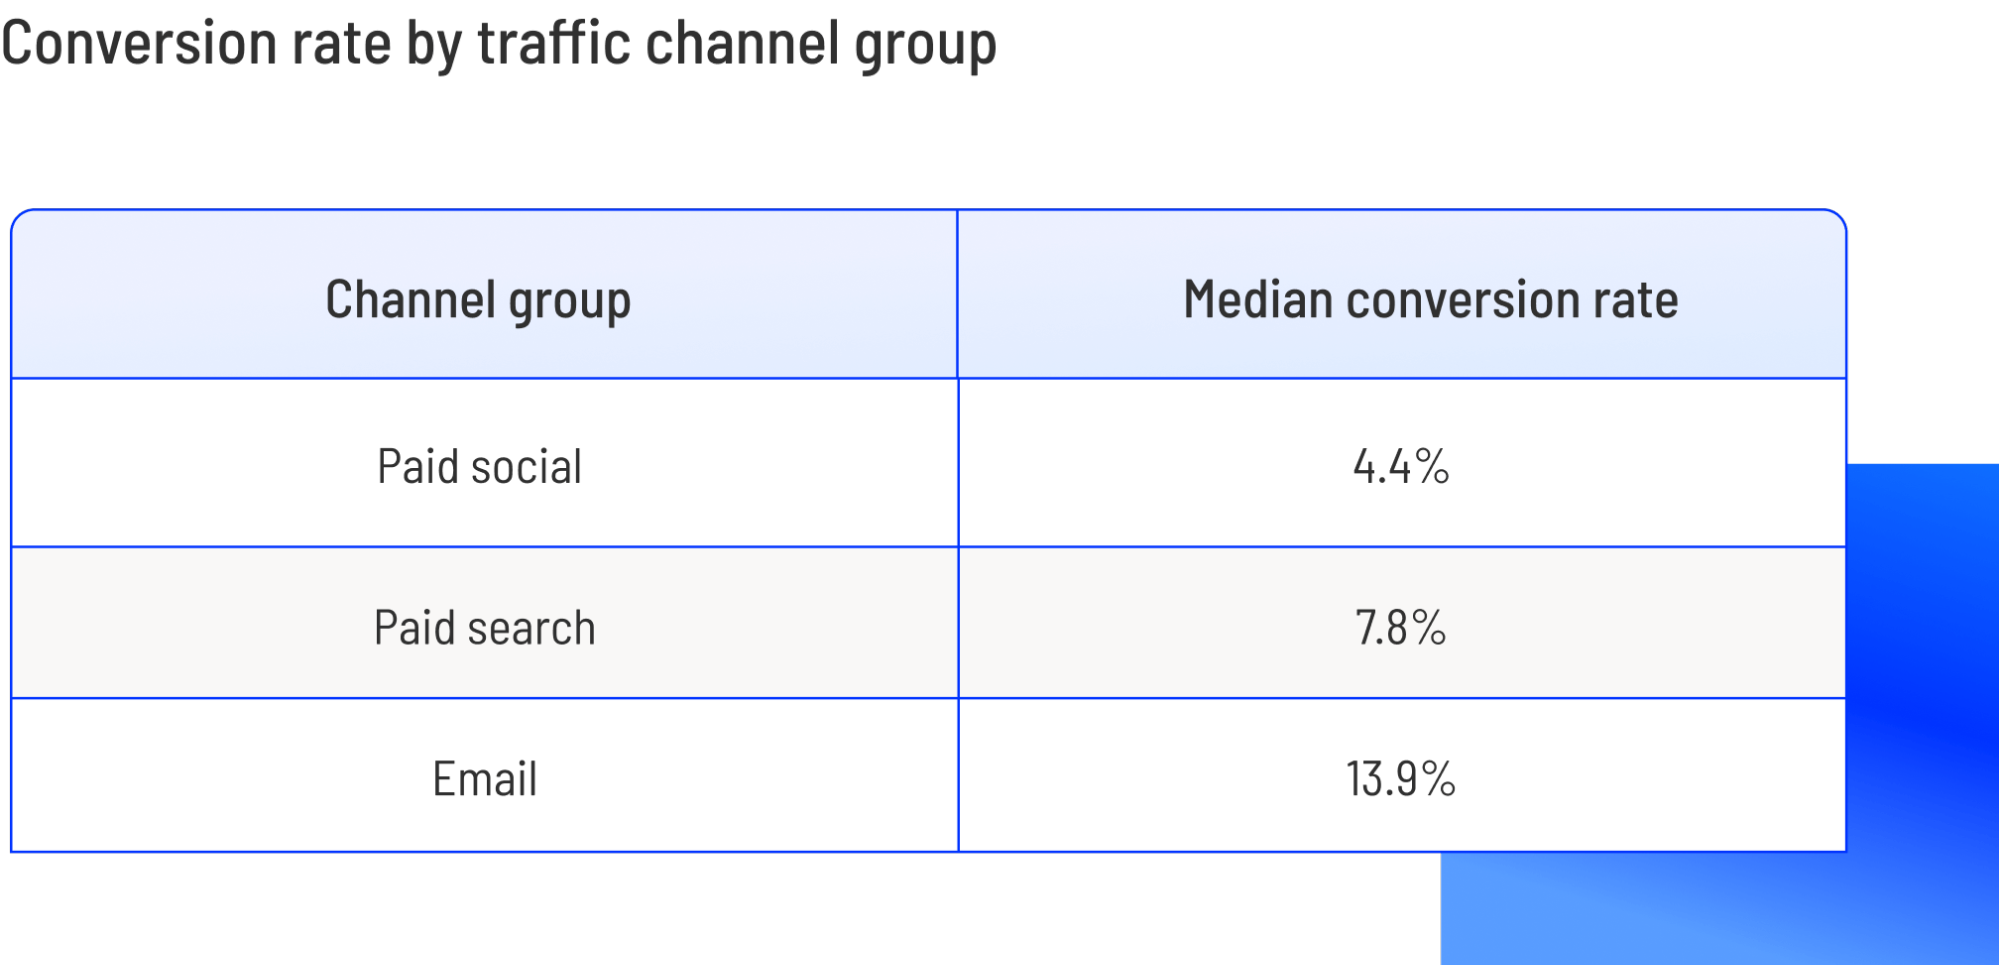
Professional services, ranging from law firms to consulting agencies, see a median of 6.1%, with top performers hitting 14.1%. The data reveals a stark contrast in traffic quality: email traffic, which relies on established trust, converts at nearly 14%, while paid social traffic often struggles to clear 4.4%.
Financial Services and Insurance
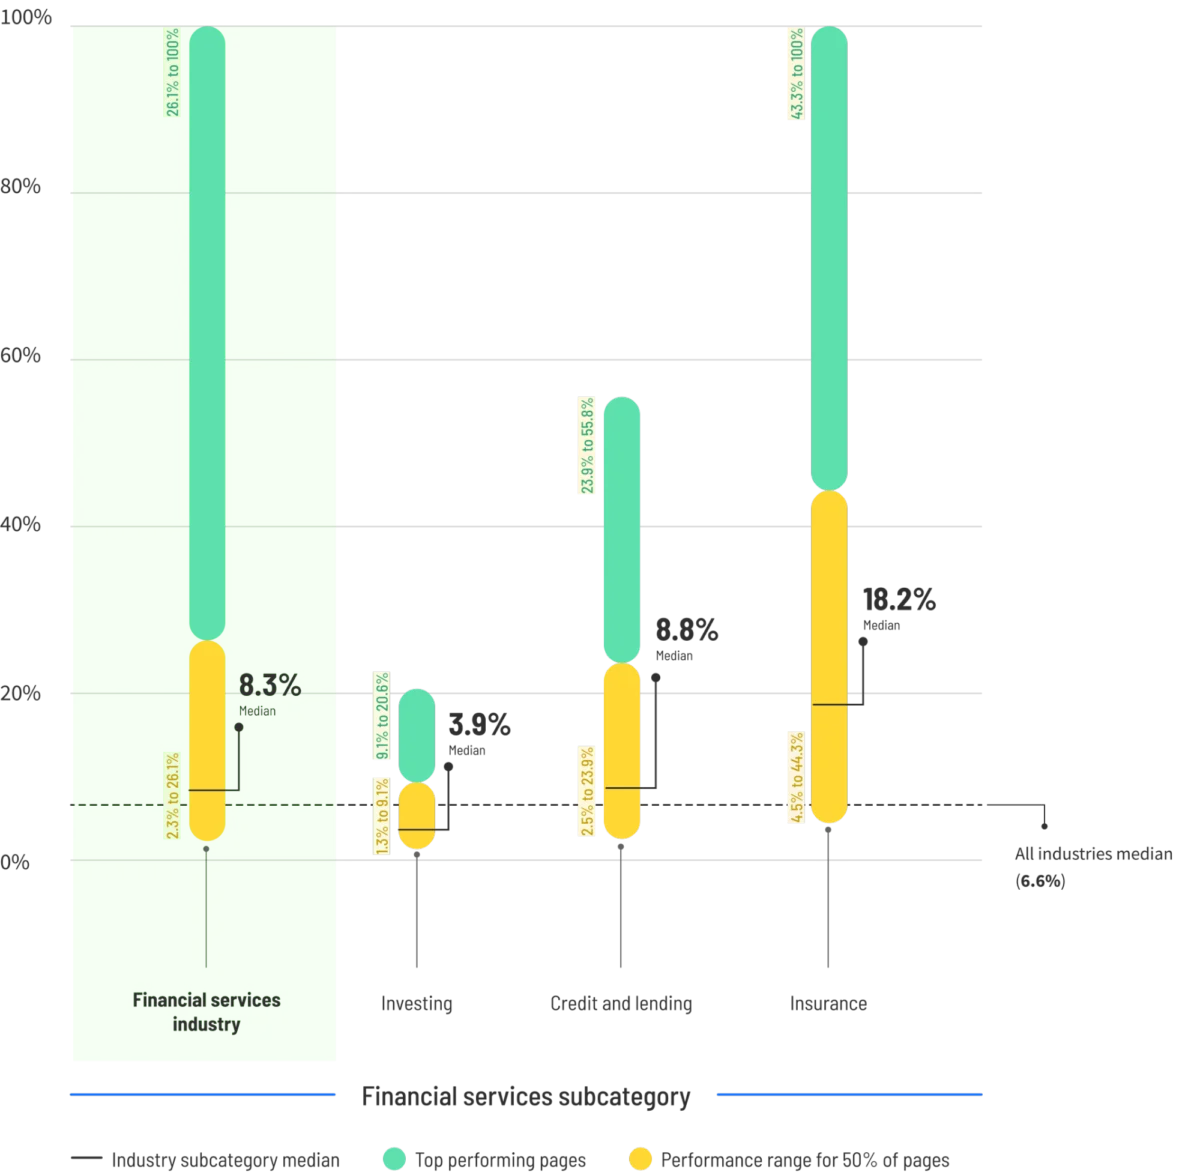
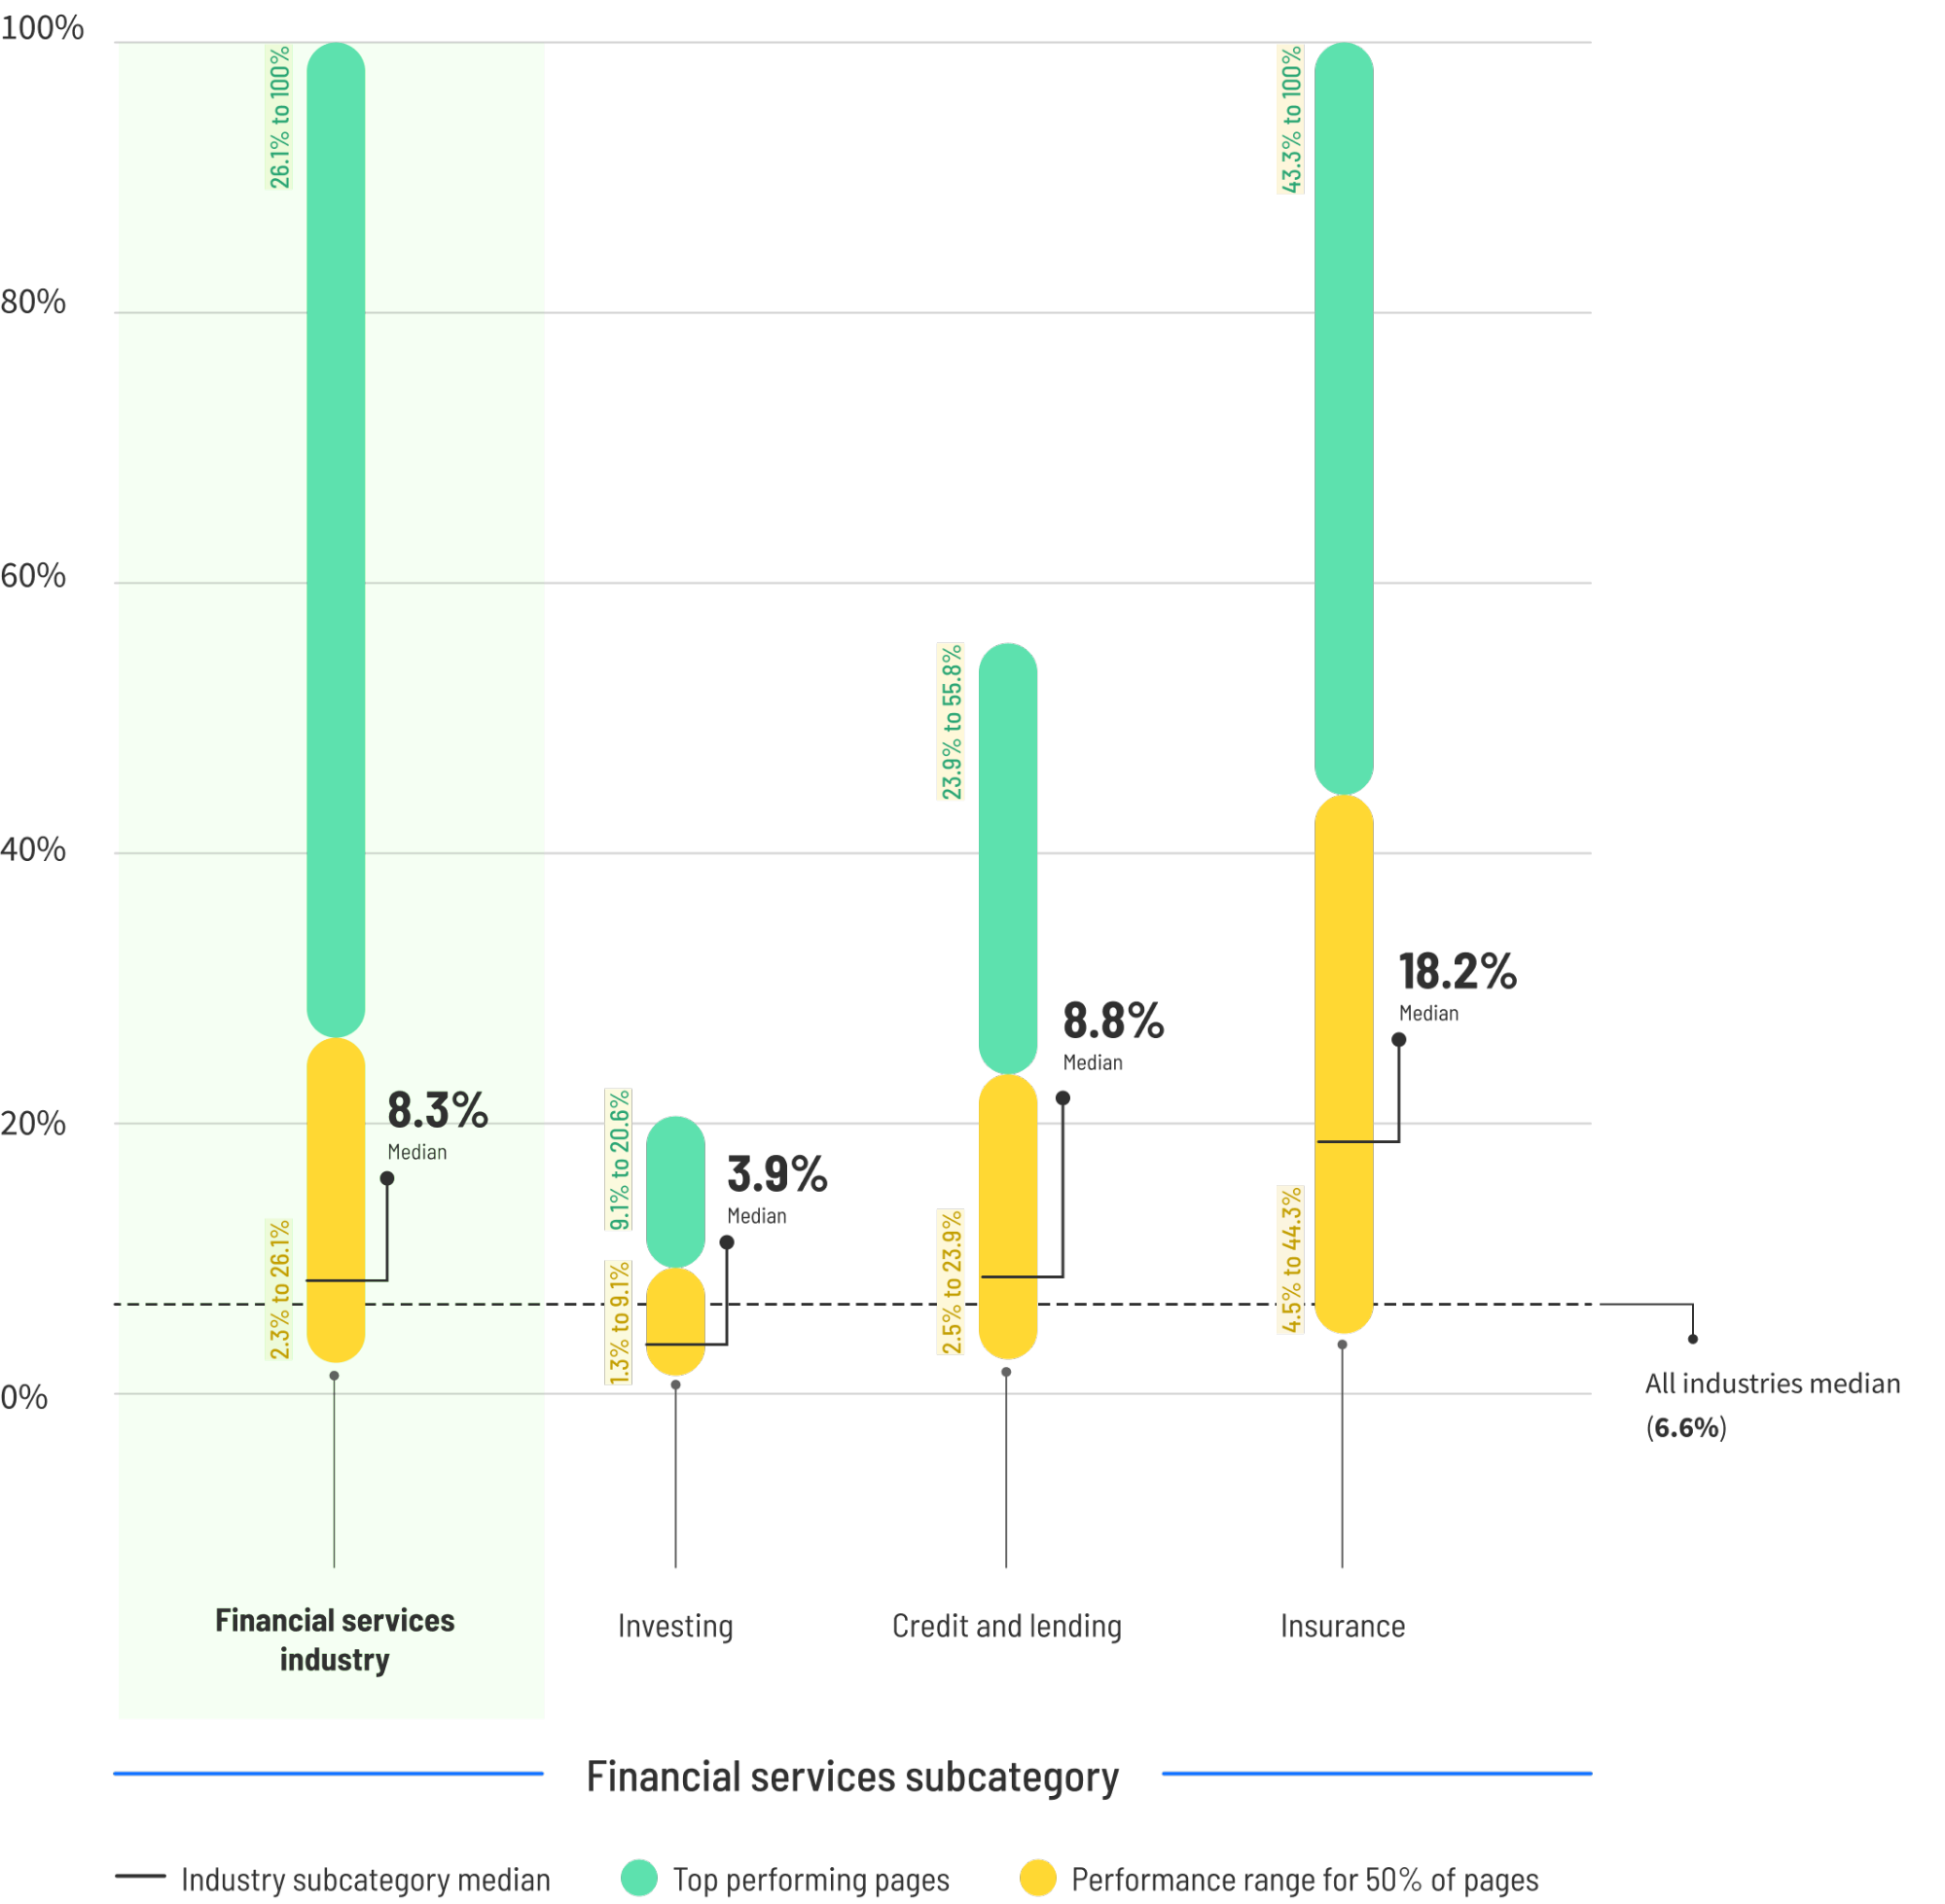
Financial services boast a strong median of 8.3%. Interestingly, this industry defies the conventional "mobile-first" wisdom; in finance, mobile traffic often converts 27.8% better than desktop, likely because users are performing high-intent, immediate searches for insurance or investment solutions while on the go.
Travel and Hospitality
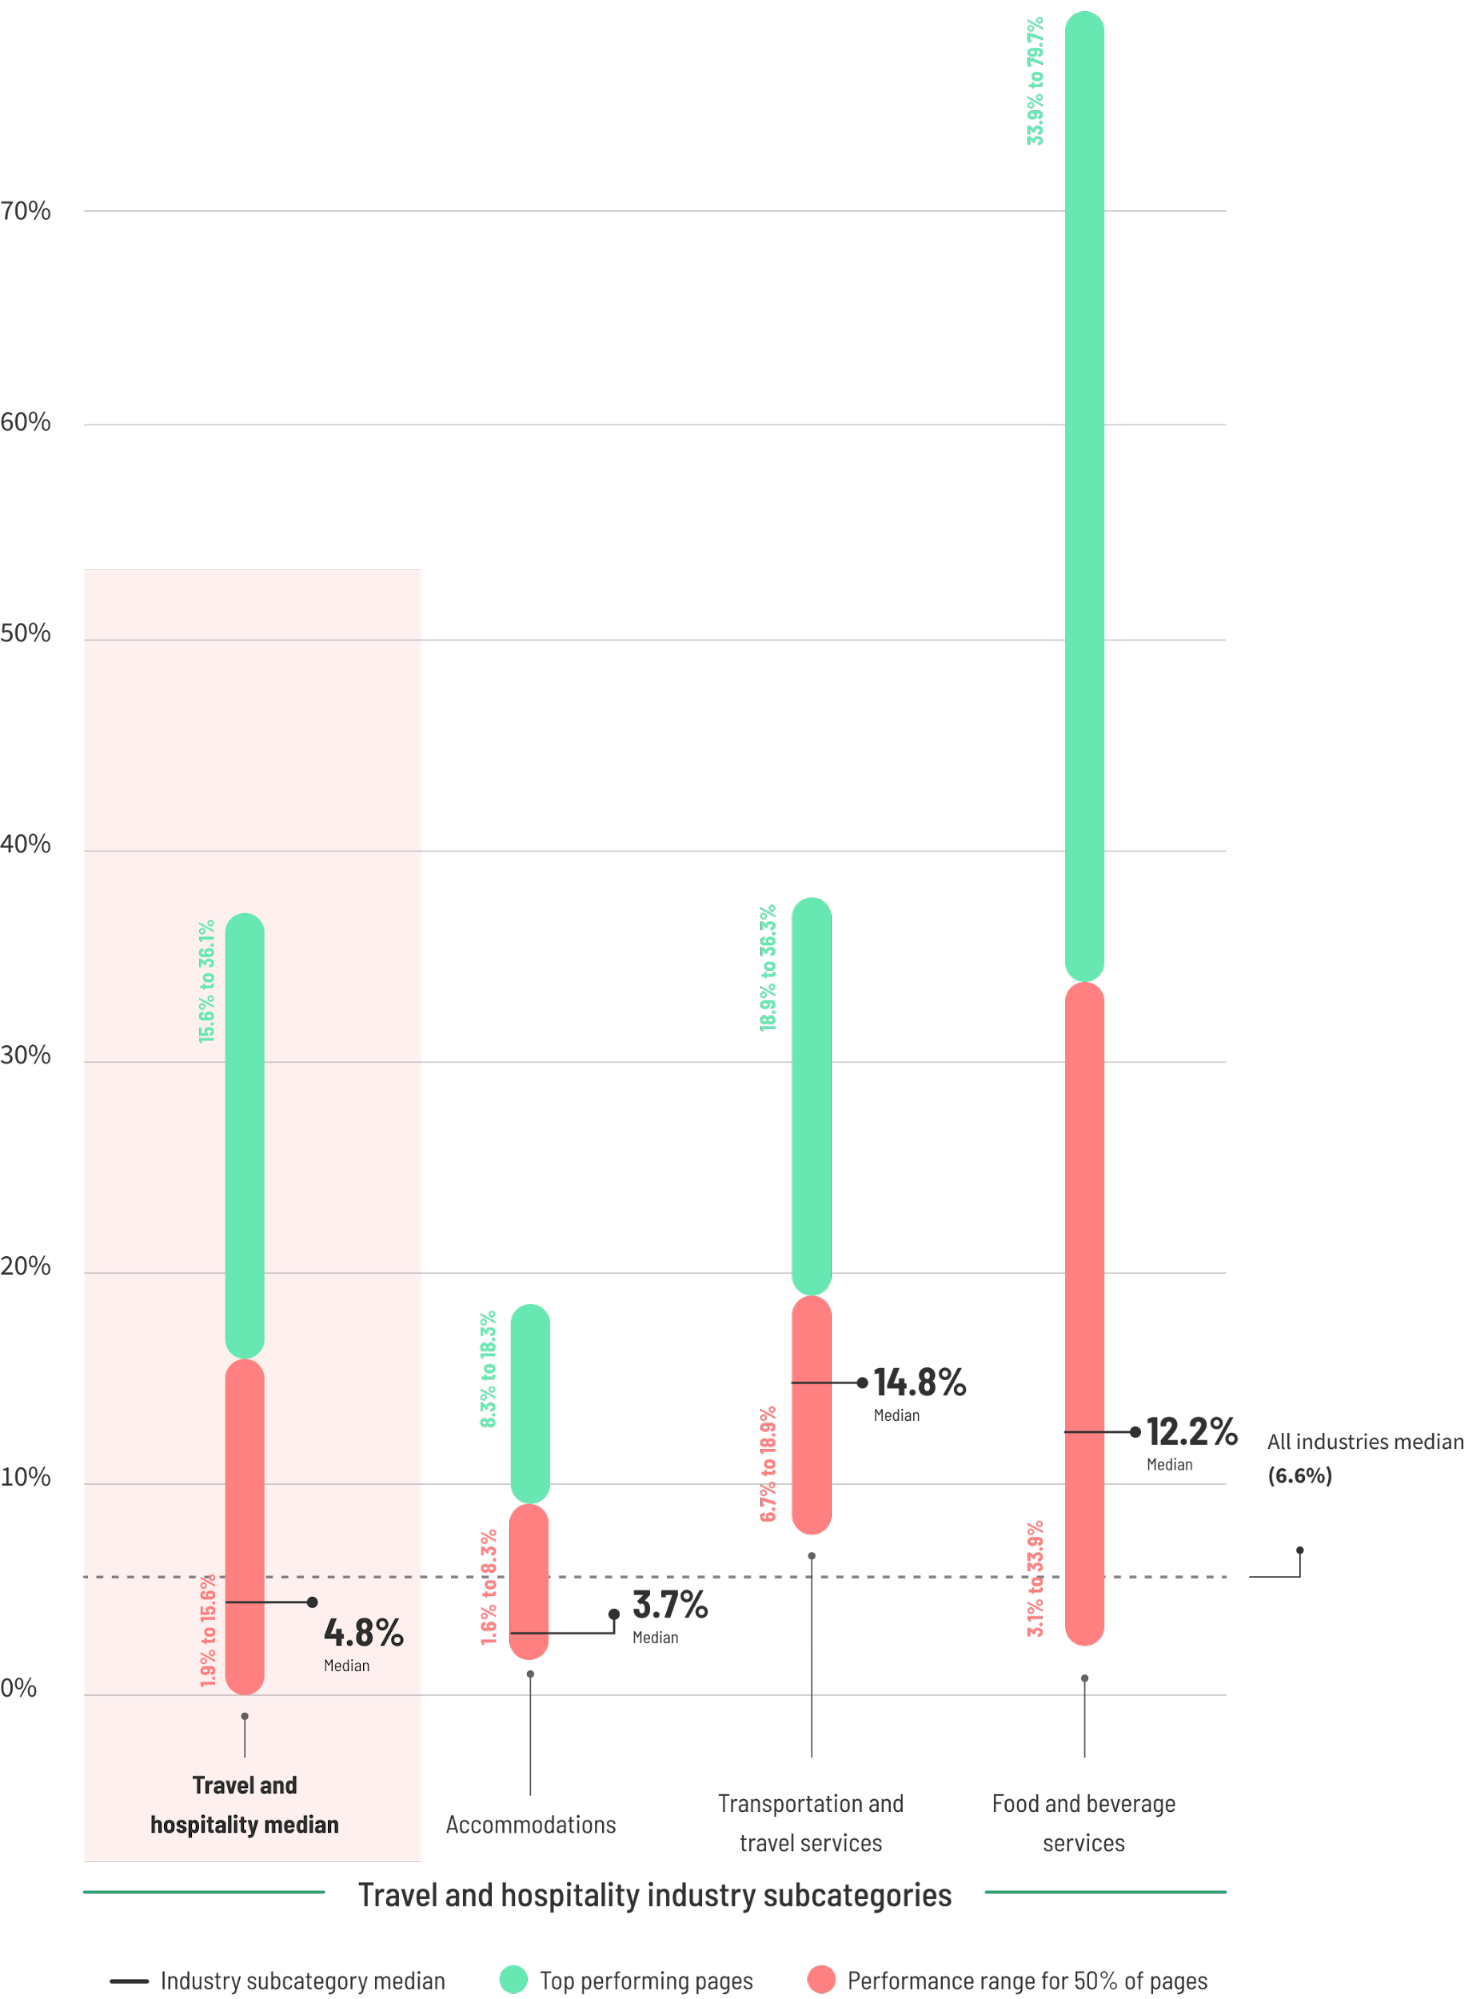
With a median of 4.8% and a top-tier benchmark of 15.6%, travel is a industry defined by seasonality and comparison shopping. The data suggests that while research happens on mobile, the high-consideration nature of booking means that desktop traffic remains the primary driver for final conversions, outperforming mobile by 10.4%.
Chronology of Optimization: The Evolution of Best Practices
The methodology of conversion rate optimization (CRO) has shifted significantly over the last decade. Early in the digital age, CRO was a game of "gut feeling" and broad A/B testing of button colors. Today, the focus has moved toward Intent-Based Marketing.
- Phase 1 (Pre-2015): The era of "best practices." Marketers followed generic rules like "keep forms above the fold."
- Phase 2 (2015–2020): The rise of A/B testing and personalization. Data began to prove that context mattered more than universal rules.
- Phase 3 (2021–Present): The AI and Intent era. Modern tools like Smart Traffic now use machine learning to route visitors to the specific page variant that matches their unique intent, moving beyond manual testing to automated optimization.
Strategic Implications: How to Beat the Benchmarks
Understanding the numbers is only the first step. To move the needle, organizations must adopt a systematic approach to optimization.
1. The 5th-Grade Rule
Data confirms that simplicity wins. Landing pages written at a 5th-to-7th-grade reading level convert at 11.1%—significantly higher than those using complex, "professional" jargon. Clear, concise, and accessible copy reduces the cognitive load on the visitor, making the conversion decision easier.
2. Radical Distraction Removal
The modern landing page should be a "destination," not a doorway. By stripping away navigation menus, social media icons, and non-essential external links, you ensure that the visitor’s focus remains exclusively on the Call to Action (CTA). Every external link is a potential exit; remove them to keep the conversion path clean.
3. The Power of Social Proof
Trust is the currency of the digital age. Placing testimonials, review counts, and recognizable client logos directly adjacent to your CTA creates a "trust anchor." This validation at the moment of decision-making is often the nudge required to turn a hesitant visitor into a lead.
4. Mobile vs. Desktop Strategy
Marketers must stop treating mobile as a secondary experience. Because 83% of landing page visits are mobile, the mobile experience must be optimized for speed and thumb-friendly interactions. If your data shows your mobile conversion rate trailing your desktop rate by more than 20%, your mobile UI/UX is likely your greatest bottleneck.
5. Iterative Testing
CRO is not a project; it is a process. The most successful organizations run continuous A/B tests on singular elements—one variable at a time. Whether it is the wording of a button or the length of a form, incremental improvements compound over time to create a "top-quartile" performance profile.
The Path Forward
The gap between the "average" and the "excellent" is not a result of luck. It is a result of a disciplined, data-driven culture. Companies that reach the 75th percentile of their industry are not just lucky; they are systematic. They invest in understanding their audience’s intent, they prioritize speed and clarity, and they never stop testing.
As we look toward the remainder of 2025, the competitive advantage will go to those who stop chasing the "average" and start building for the "exceptional." By utilizing tools like the Unbounce landing page builder and Smart Traffic, businesses can bridge the gap between where they are and where they want to be, turning every visitor into a meaningful conversion.
In the end, benchmarks are simply a map. They show you where you are, but you are the one holding the compass. The opportunity to outperform your competition is significant—but it requires the courage to test, the patience to iterate, and the wisdom to prioritize your specific audience over generic industry advice.