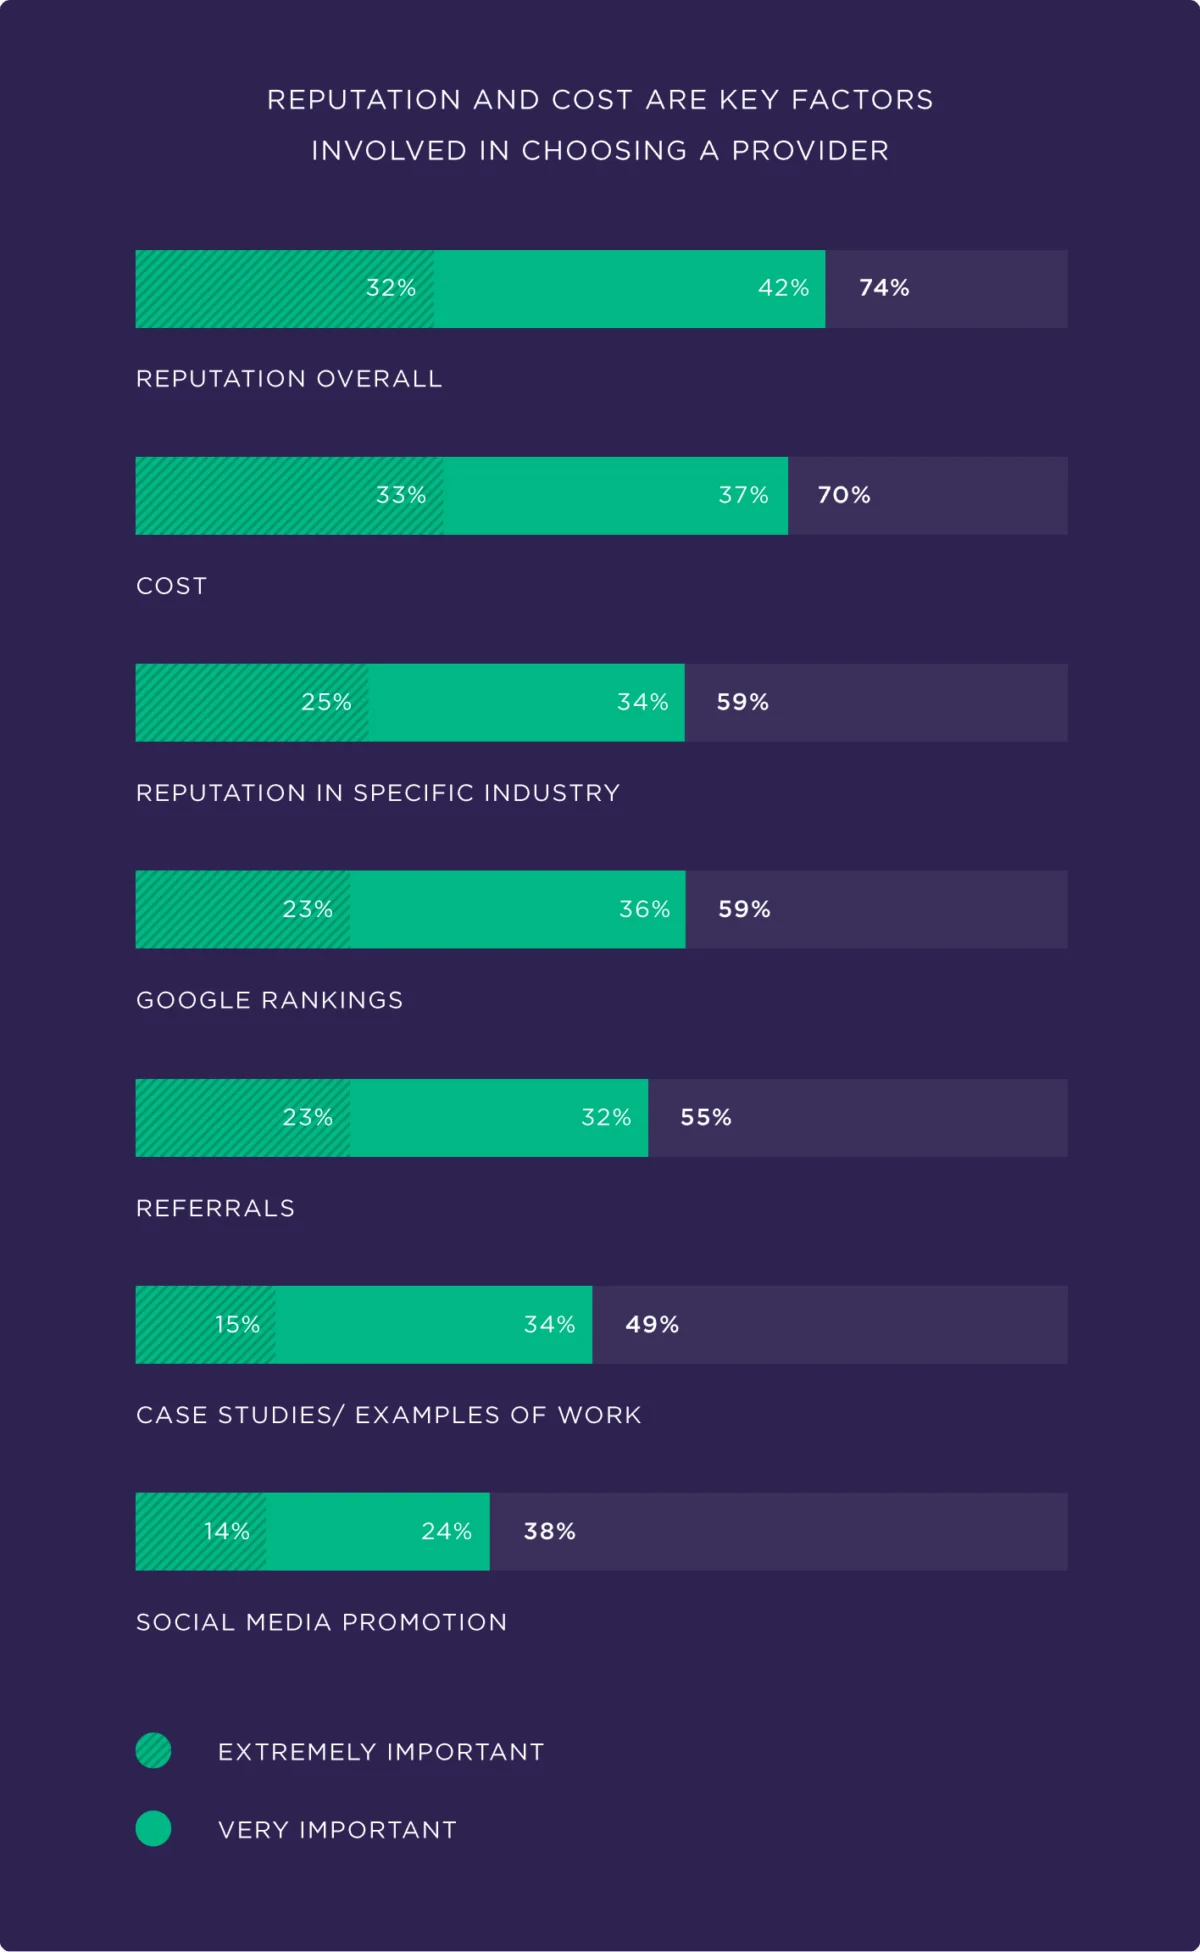

In the fast-evolving landscape of digital marketing, the traditional analytics dashboard is becoming an increasingly incomplete tool. For years, marketers have relied on click-through rates, session counts, and conversion funnels to gauge success. However, these metrics track only the results of a journey, often ignoring the critical discovery phase where brand perception is forged.

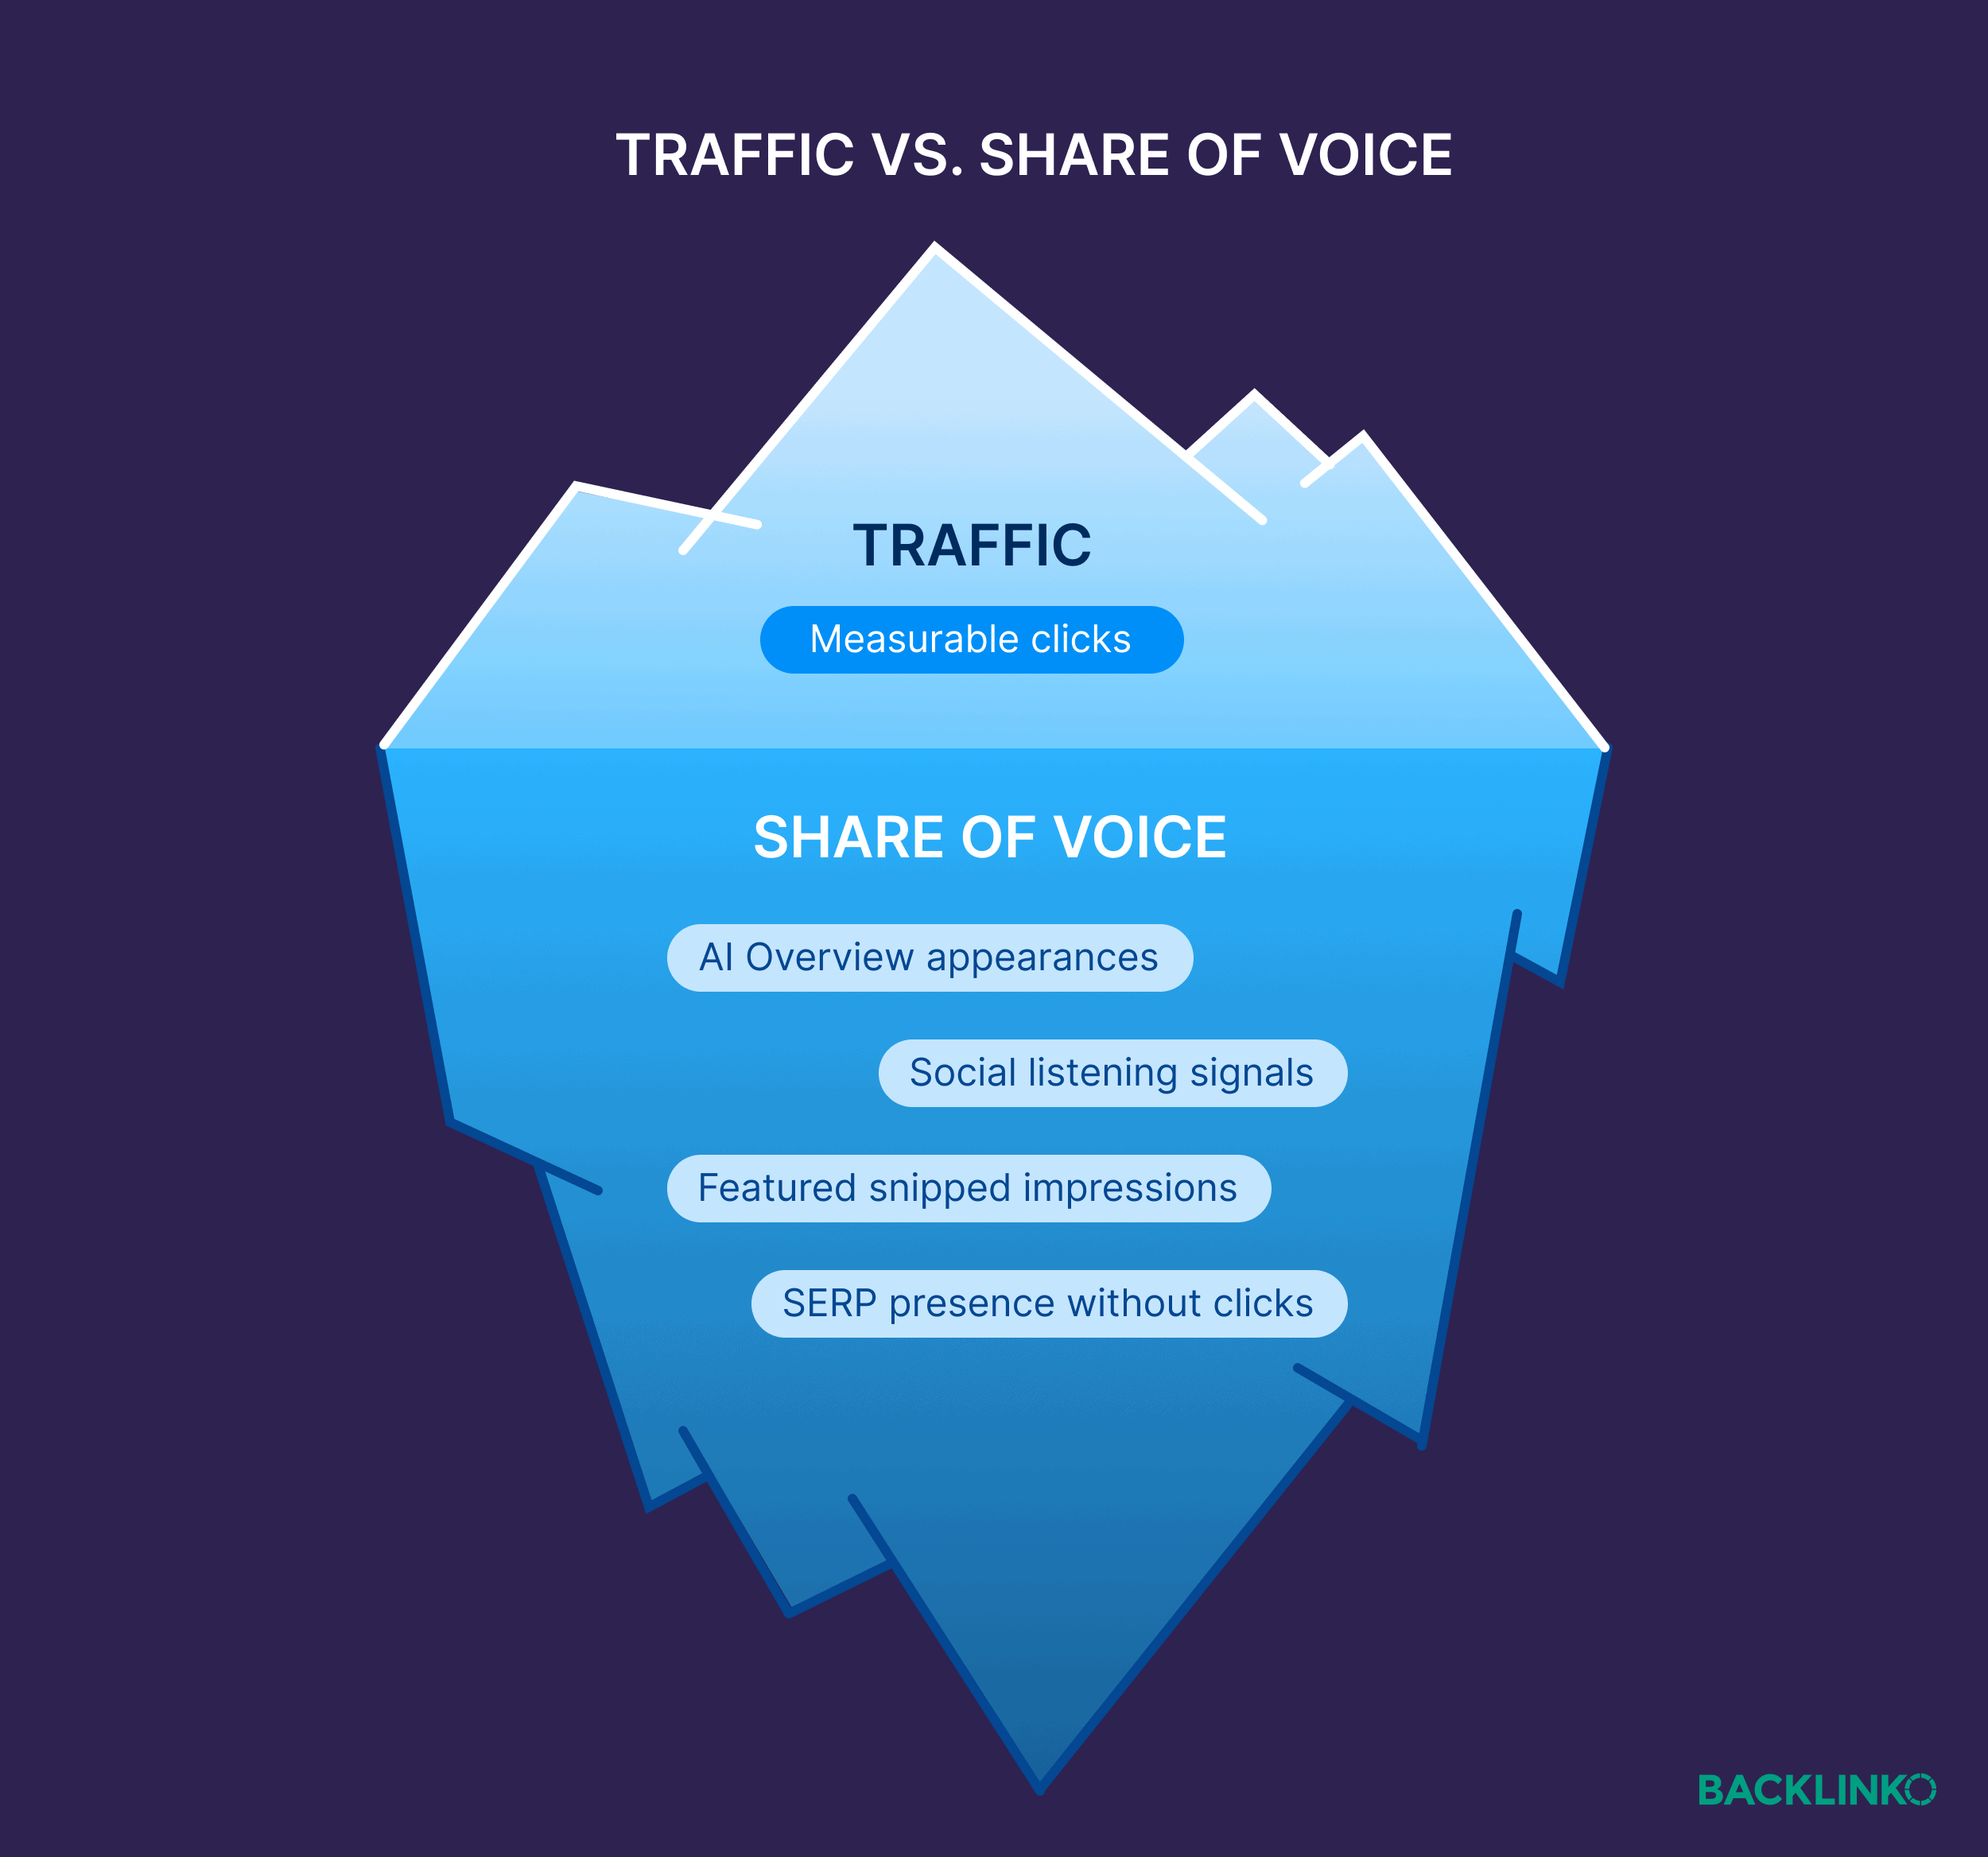
Today, when a prospective buyer reads an AI-generated summary that highlights a competitor, or scrolls through a Reddit thread where your brand is notably absent, you are experiencing "lost visibility." This phenomenon does not trigger a drop in your Google Analytics traffic data, yet it represents a silent erosion of your market position.
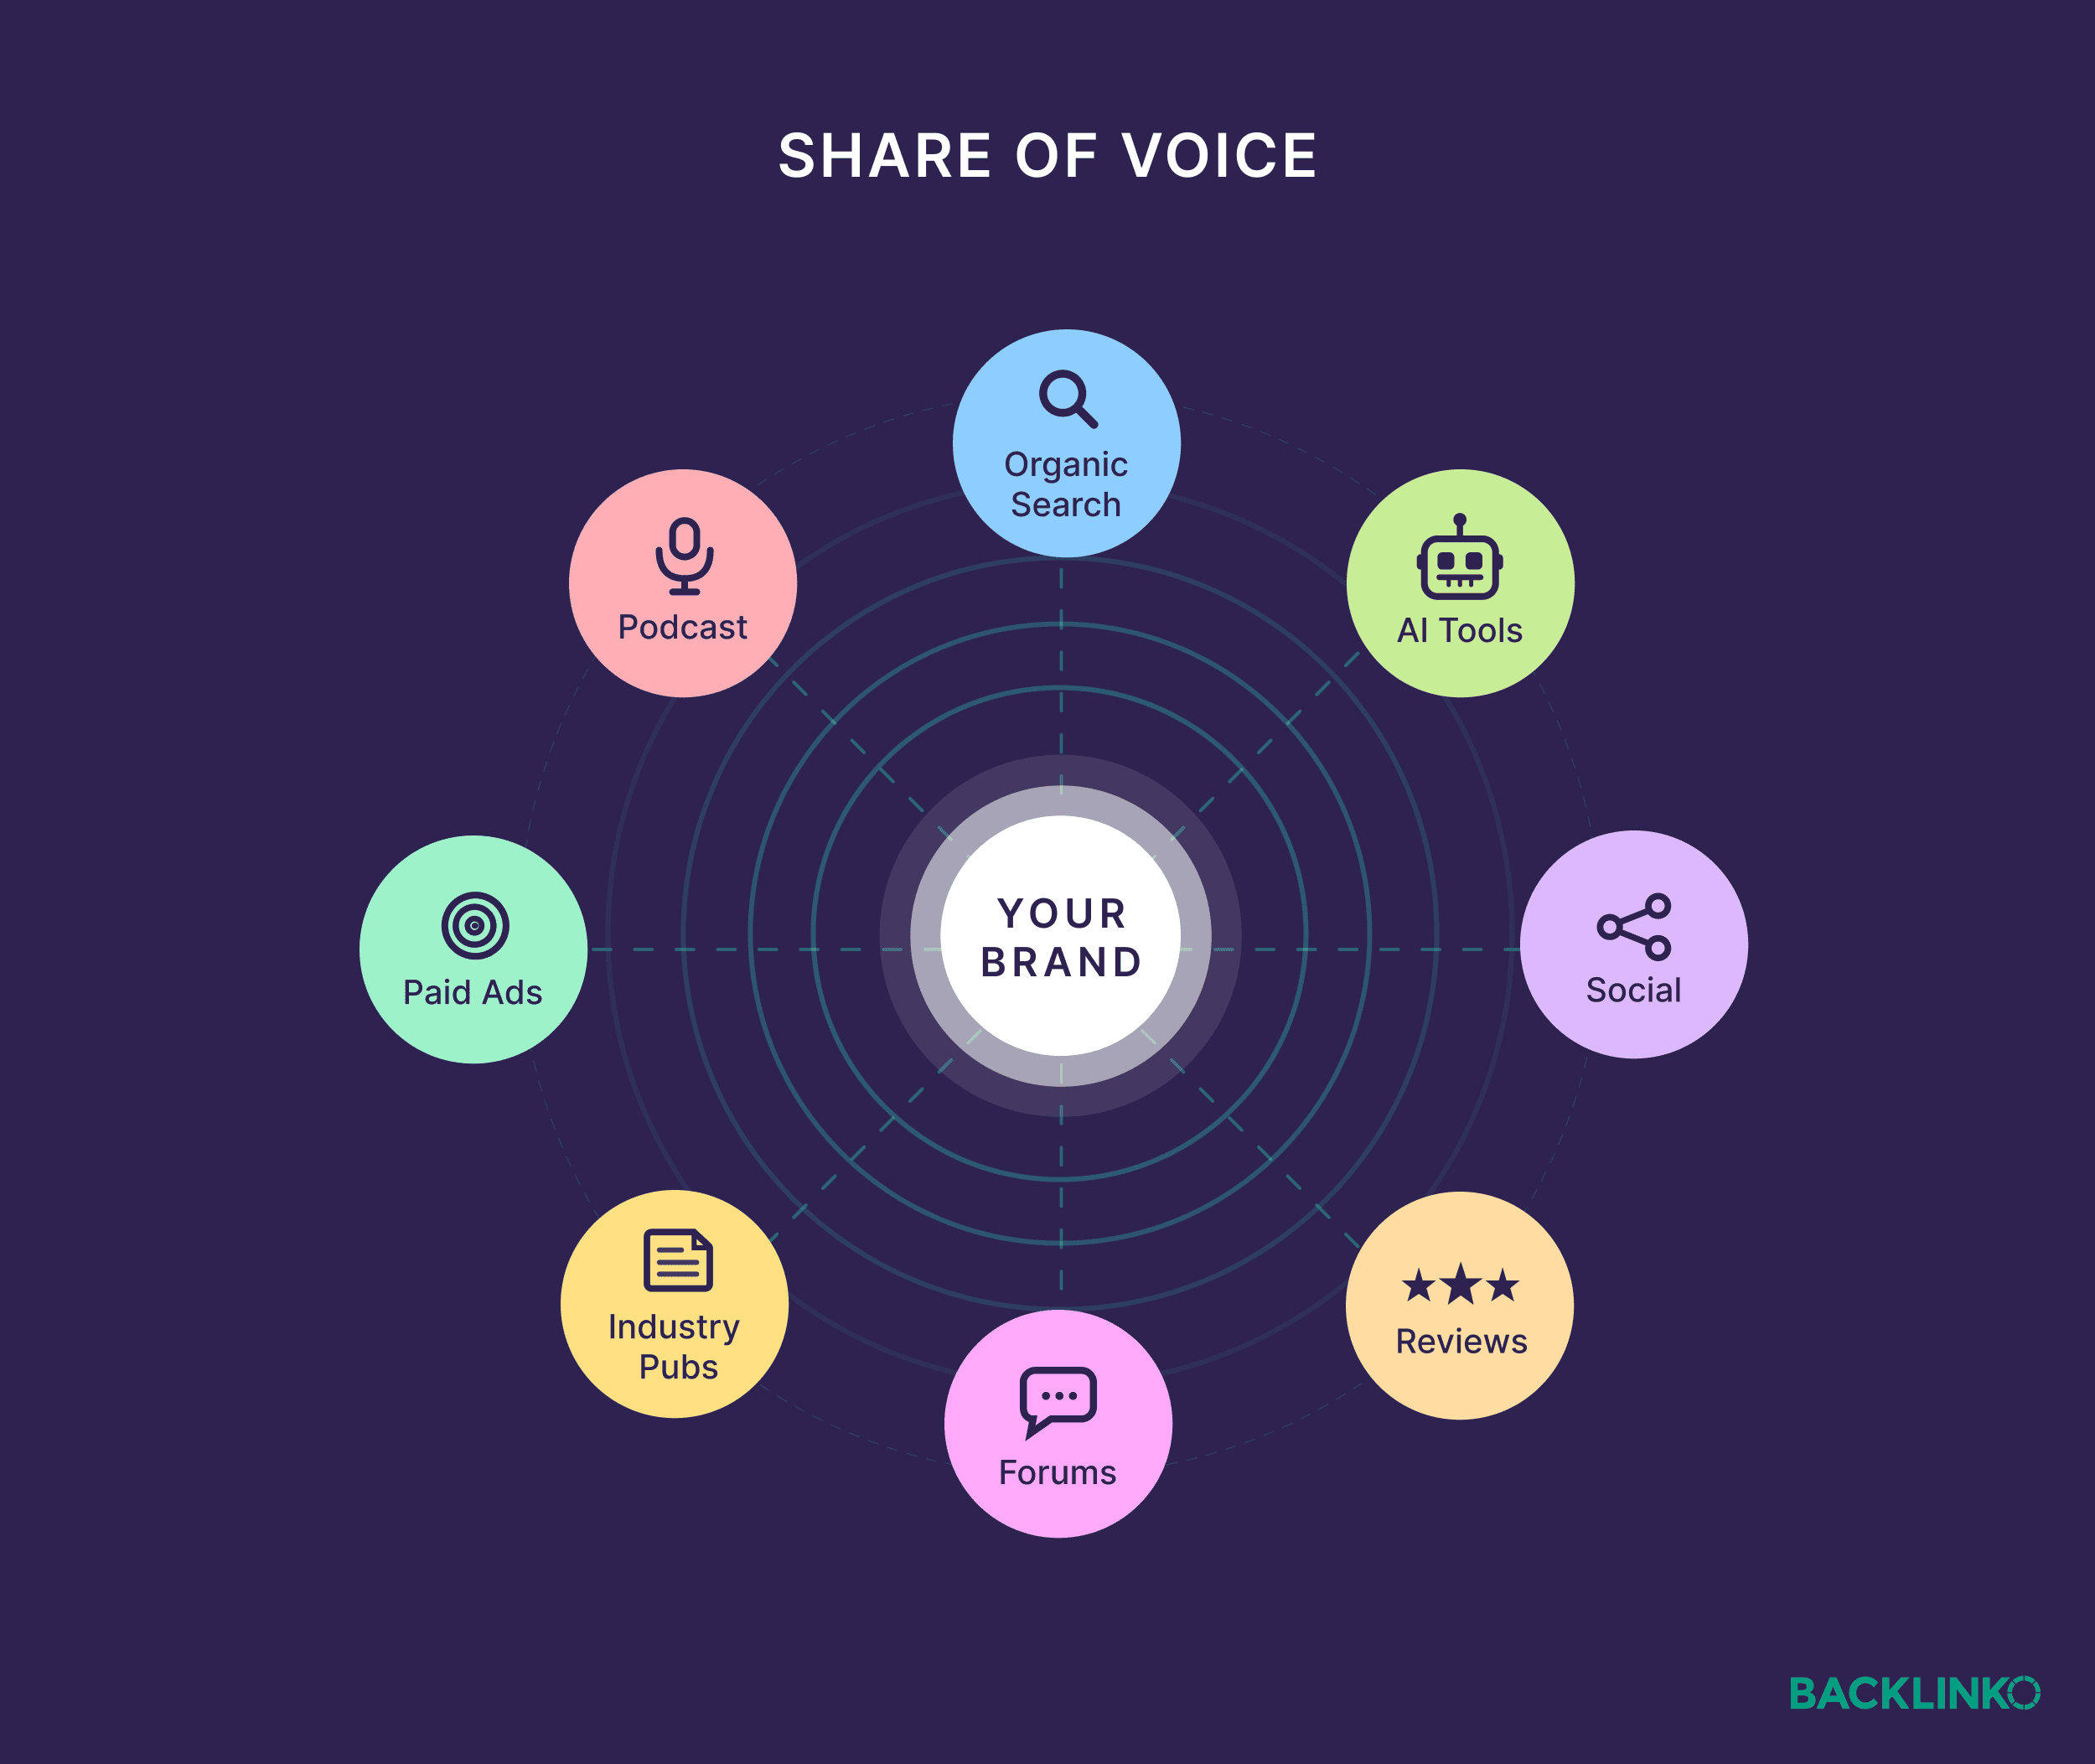
To combat this, savvy marketing teams are shifting their focus toward Share of Voice (SoV). This metric captures the percentage of the conversation your brand owns within its category, providing a comprehensive view of your visibility across the channels where buyers actually research and make decisions.
What Is Share of Voice?
At its core, Share of Voice measures your brand’s visibility relative to competitors across multiple marketing channels, including organic search, AI-driven responses, social media, review platforms, and niche online communities.

Traditionally, SoV was the exclusive domain of advertising, used to track the share of ad spend in a market. In 2026, the definition has evolved. It now represents your brand’s presence at every digital touchpoint where a buyer might form an opinion. If traditional traffic data tells you how many people walked through your front door, SoV tells you how many people saw your sign on the highway, heard your name at a trade show, and caught your mention in a peer recommendation.
Why Search SoV Matters First
While SoV spans PR, social media, and paid media, search—both organic and AI—is the logical starting point. Search remains the channel where buyers with the strongest purchase intent congregate. Furthermore, because search data is structured and measurable, it provides a reliable foundation upon which to layer other, more qualitative channels.
The Chronology of Visibility: Traditional vs. AI Search
The measurement of SoV has split into two distinct, yet complementary, games:
- SEO SoV: This is the legacy model. It calculates your slice of traditional organic search traffic. By tracking a set of target keywords, you determine the total monthly search volume and your portion of the traffic. For example, if your target keywords generate 50,000 monthly visits collectively and your site captures 15,000, your organic SoV is 30%.
- AI SoV: This is the modern frontier. AI visibility measures brand mentions and citations within responses from LLMs like ChatGPT, Perplexity, and Google’s AI Overviews. If you test 100 category-specific prompts and your brand appears in 45 responses, your AI SoV is calculated based on these weighted mentions and citations.
Why SoV is the Essential KPI for 2026
The shift toward SoV is not merely a trend; it is a necessity driven by three major changes in the digital ecosystem.

1. Tracking Beyond the "Click"
Organic traffic data is becoming a lagging indicator. With the rise of "zero-click" searches, where users obtain answers directly from snippets or AI summaries, a significant portion of your visibility is never recorded in Google Analytics. SoV is a leading indicator; it reveals how visible you are in the consideration set, even when users don’t click your link. If you appear in an AI overview for a high-intent query, you are building brand equity even if the user doesn’t visit your site immediately.
2. Eliminating Siloed Metrics
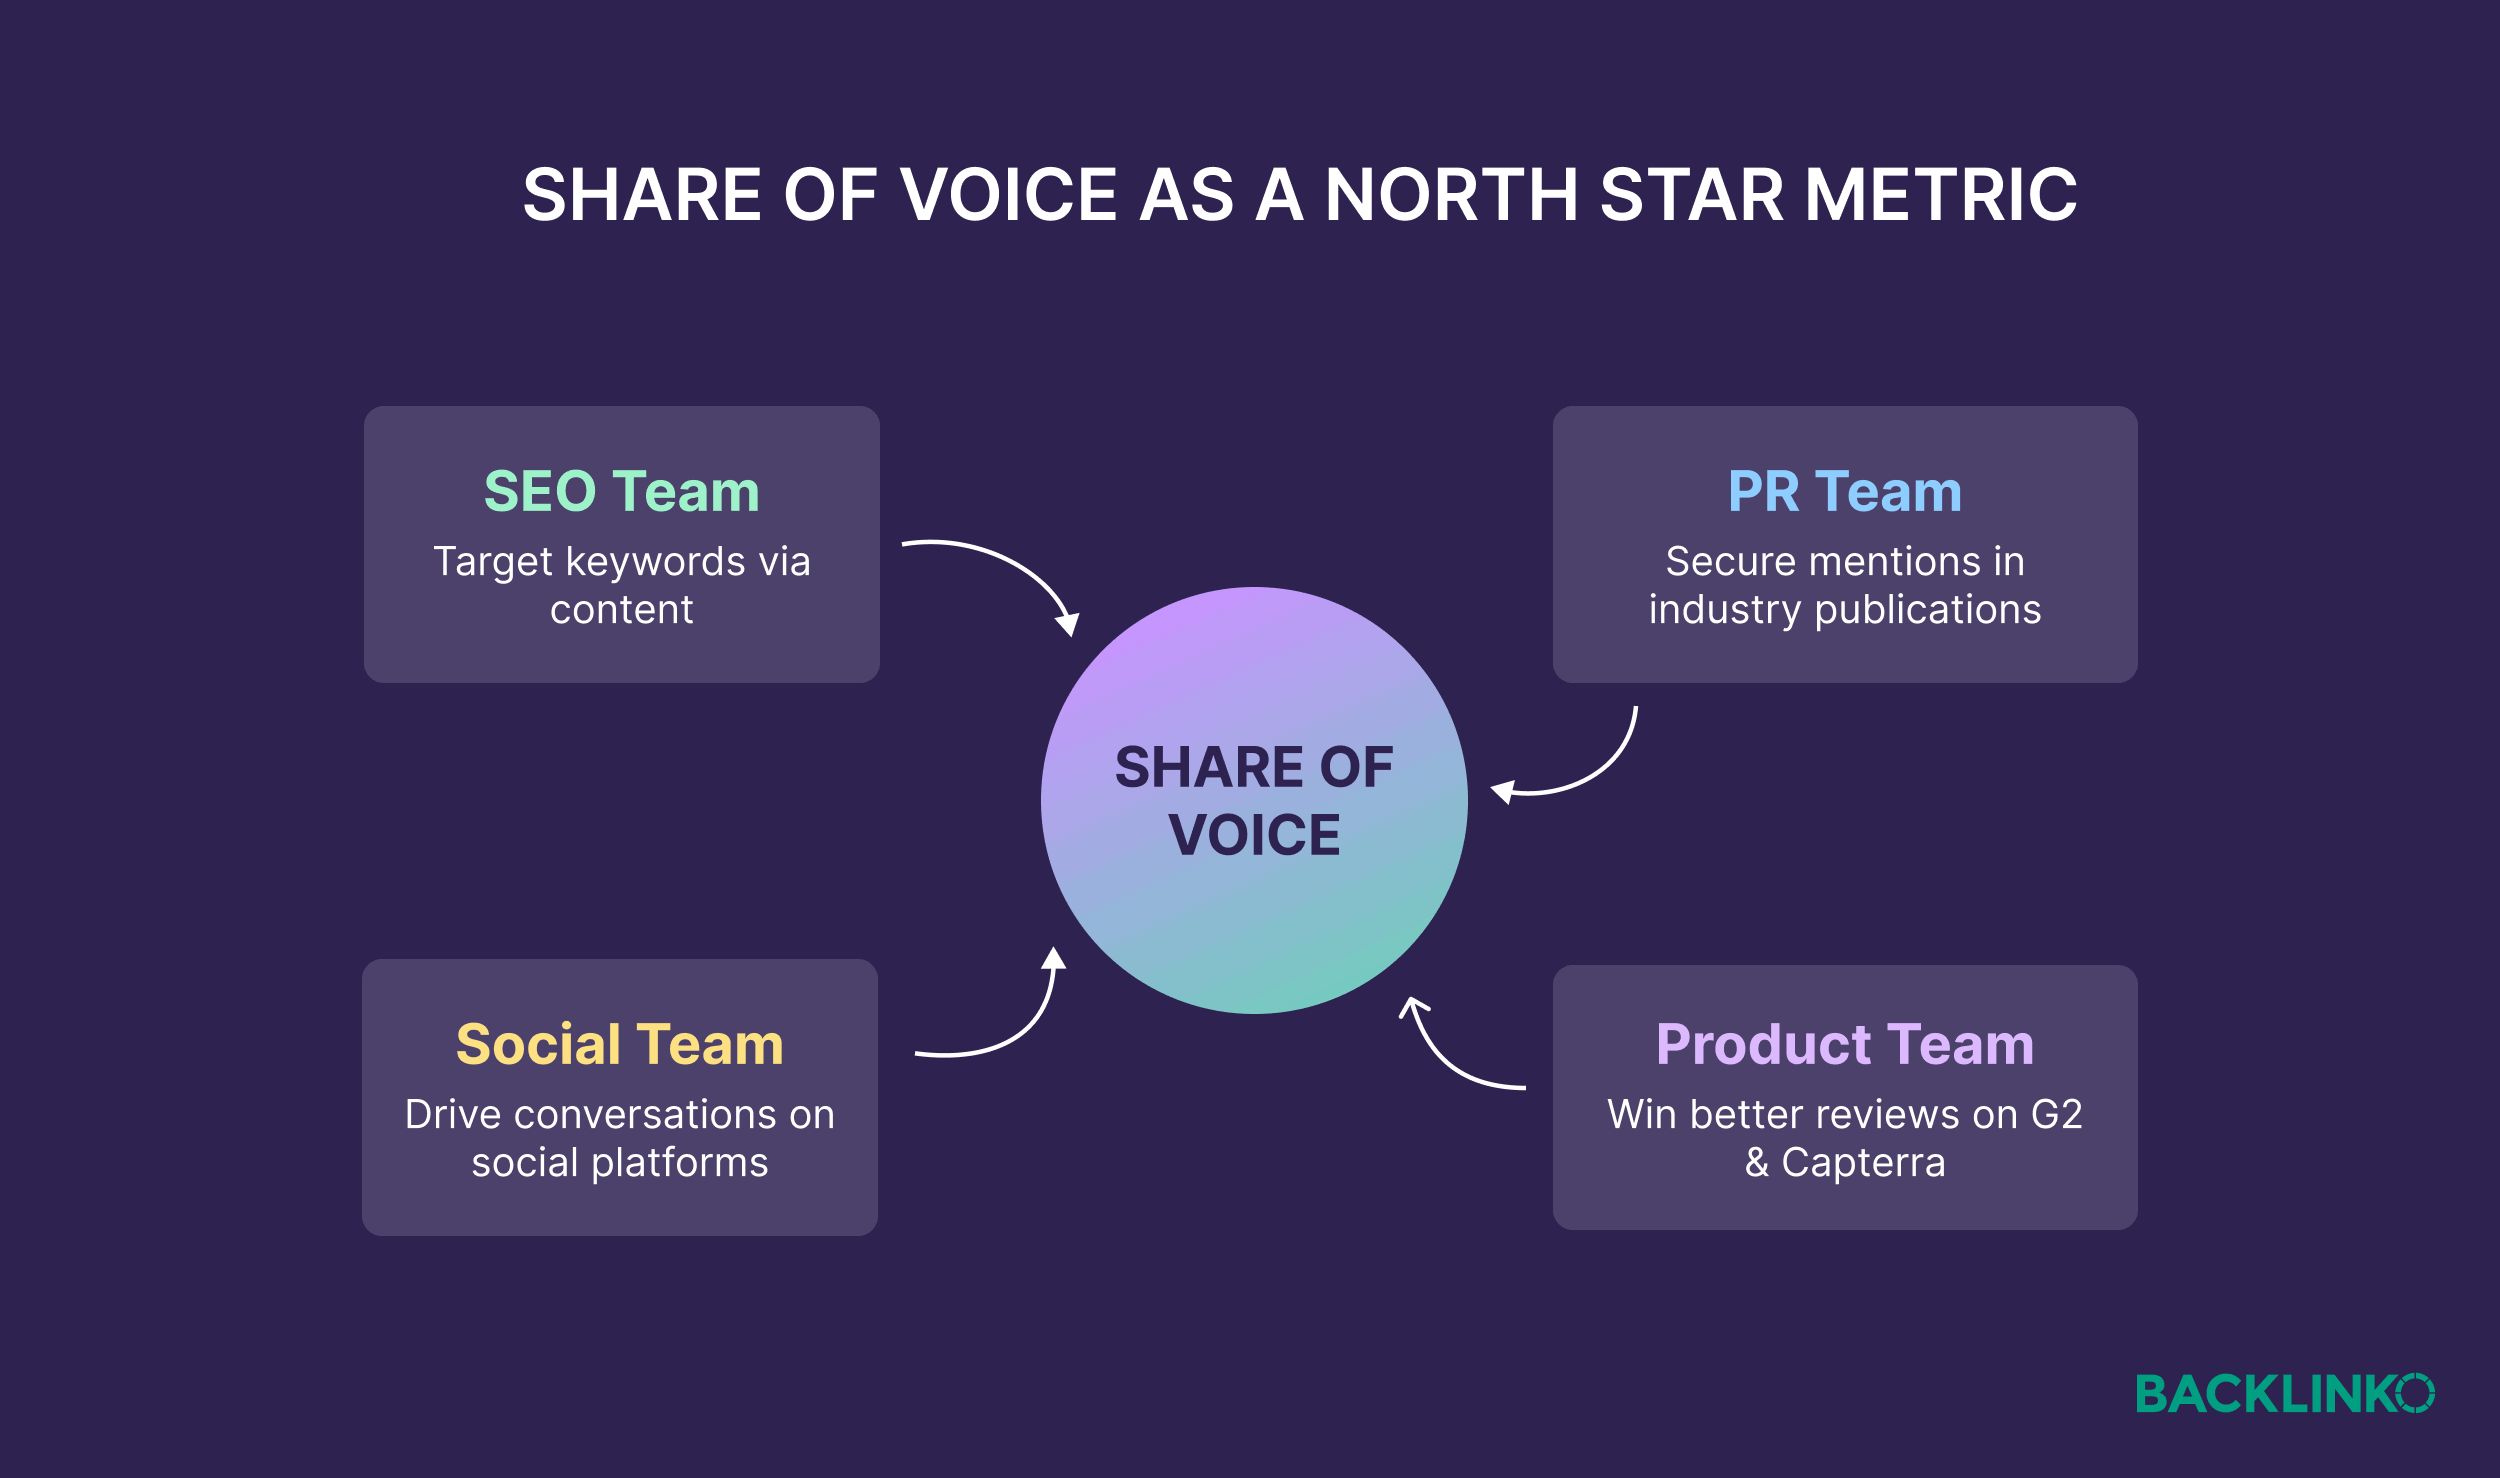
Modern marketing departments often suffer from fragmentation: the SEO team chases traffic, the PR team hunts for media mentions, and the social team prioritizes engagement. These teams often optimize for conflicting outcomes. SoV acts as a "North Star," providing a singular metric that every department can rally behind. When the entire organization understands how their specific output contributes to a unified visibility percentage, collaboration improves.
3. Understanding Market Dynamics
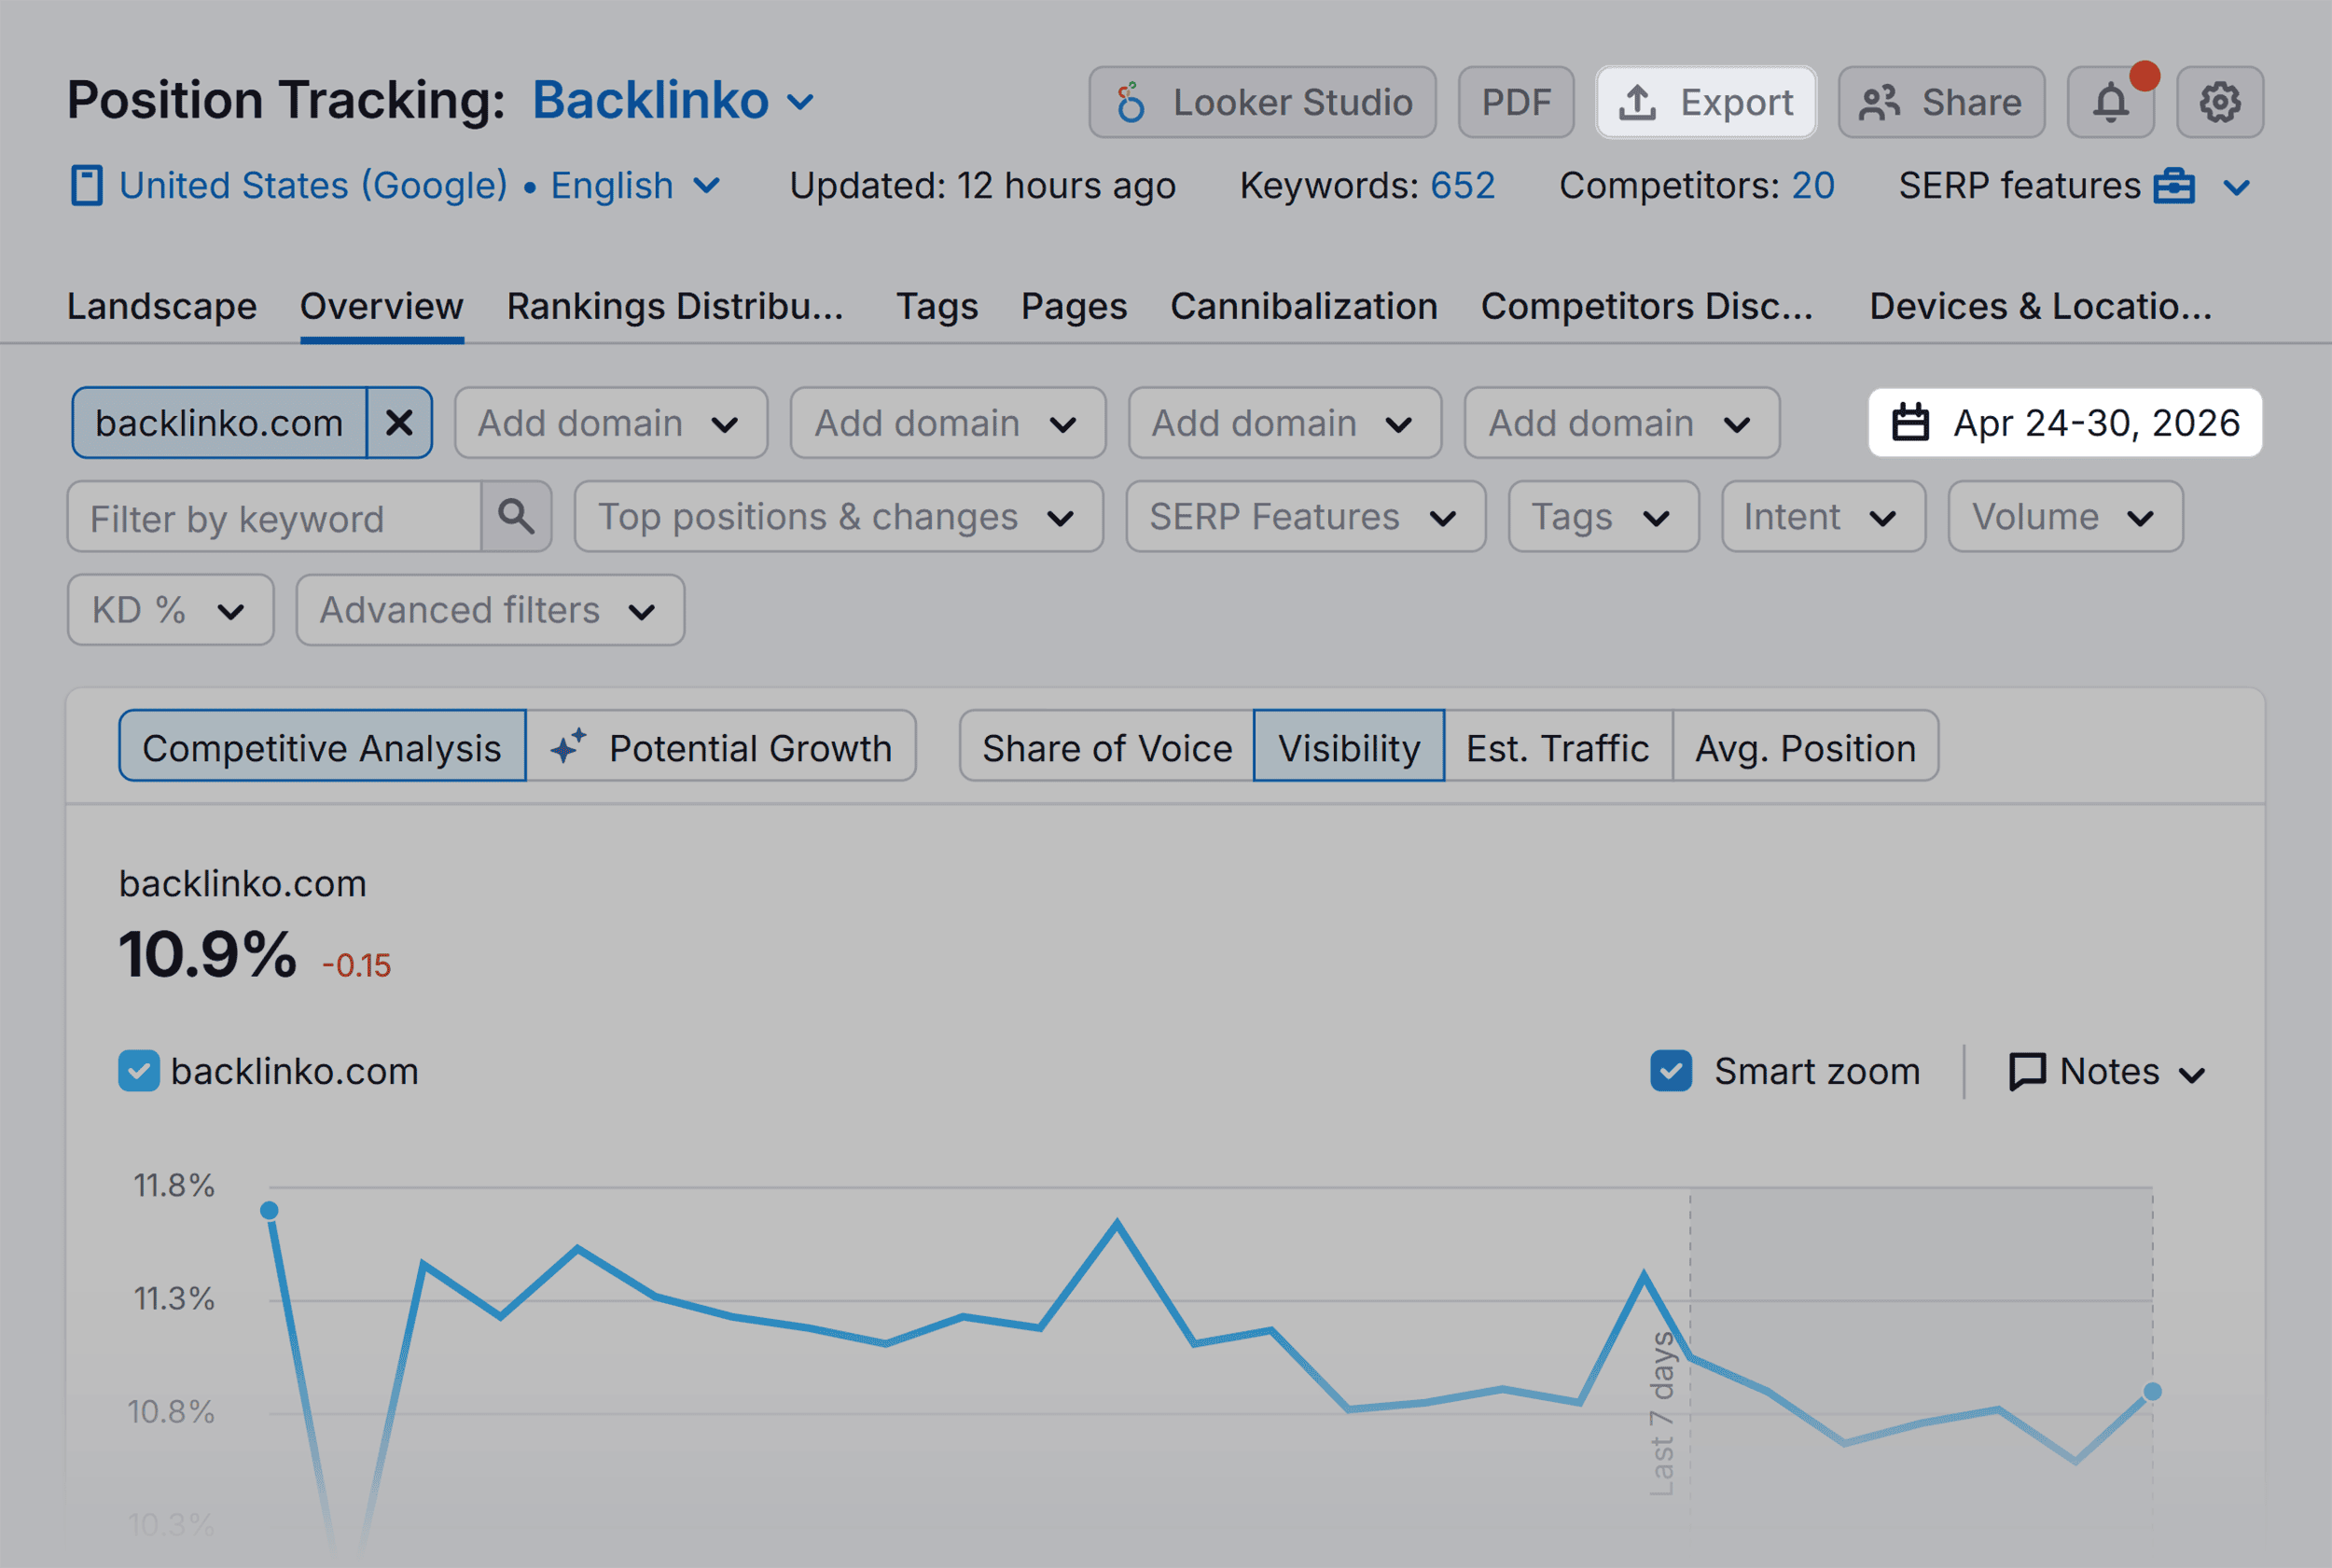
High SoV is only valuable if the market is healthy. A brand might boast a high share of voice in a declining category, which is a vanity metric. The true competitive advantage lies in growing your share of voice while the total category demand expands.
Four Steps to Measuring Your Share of Voice
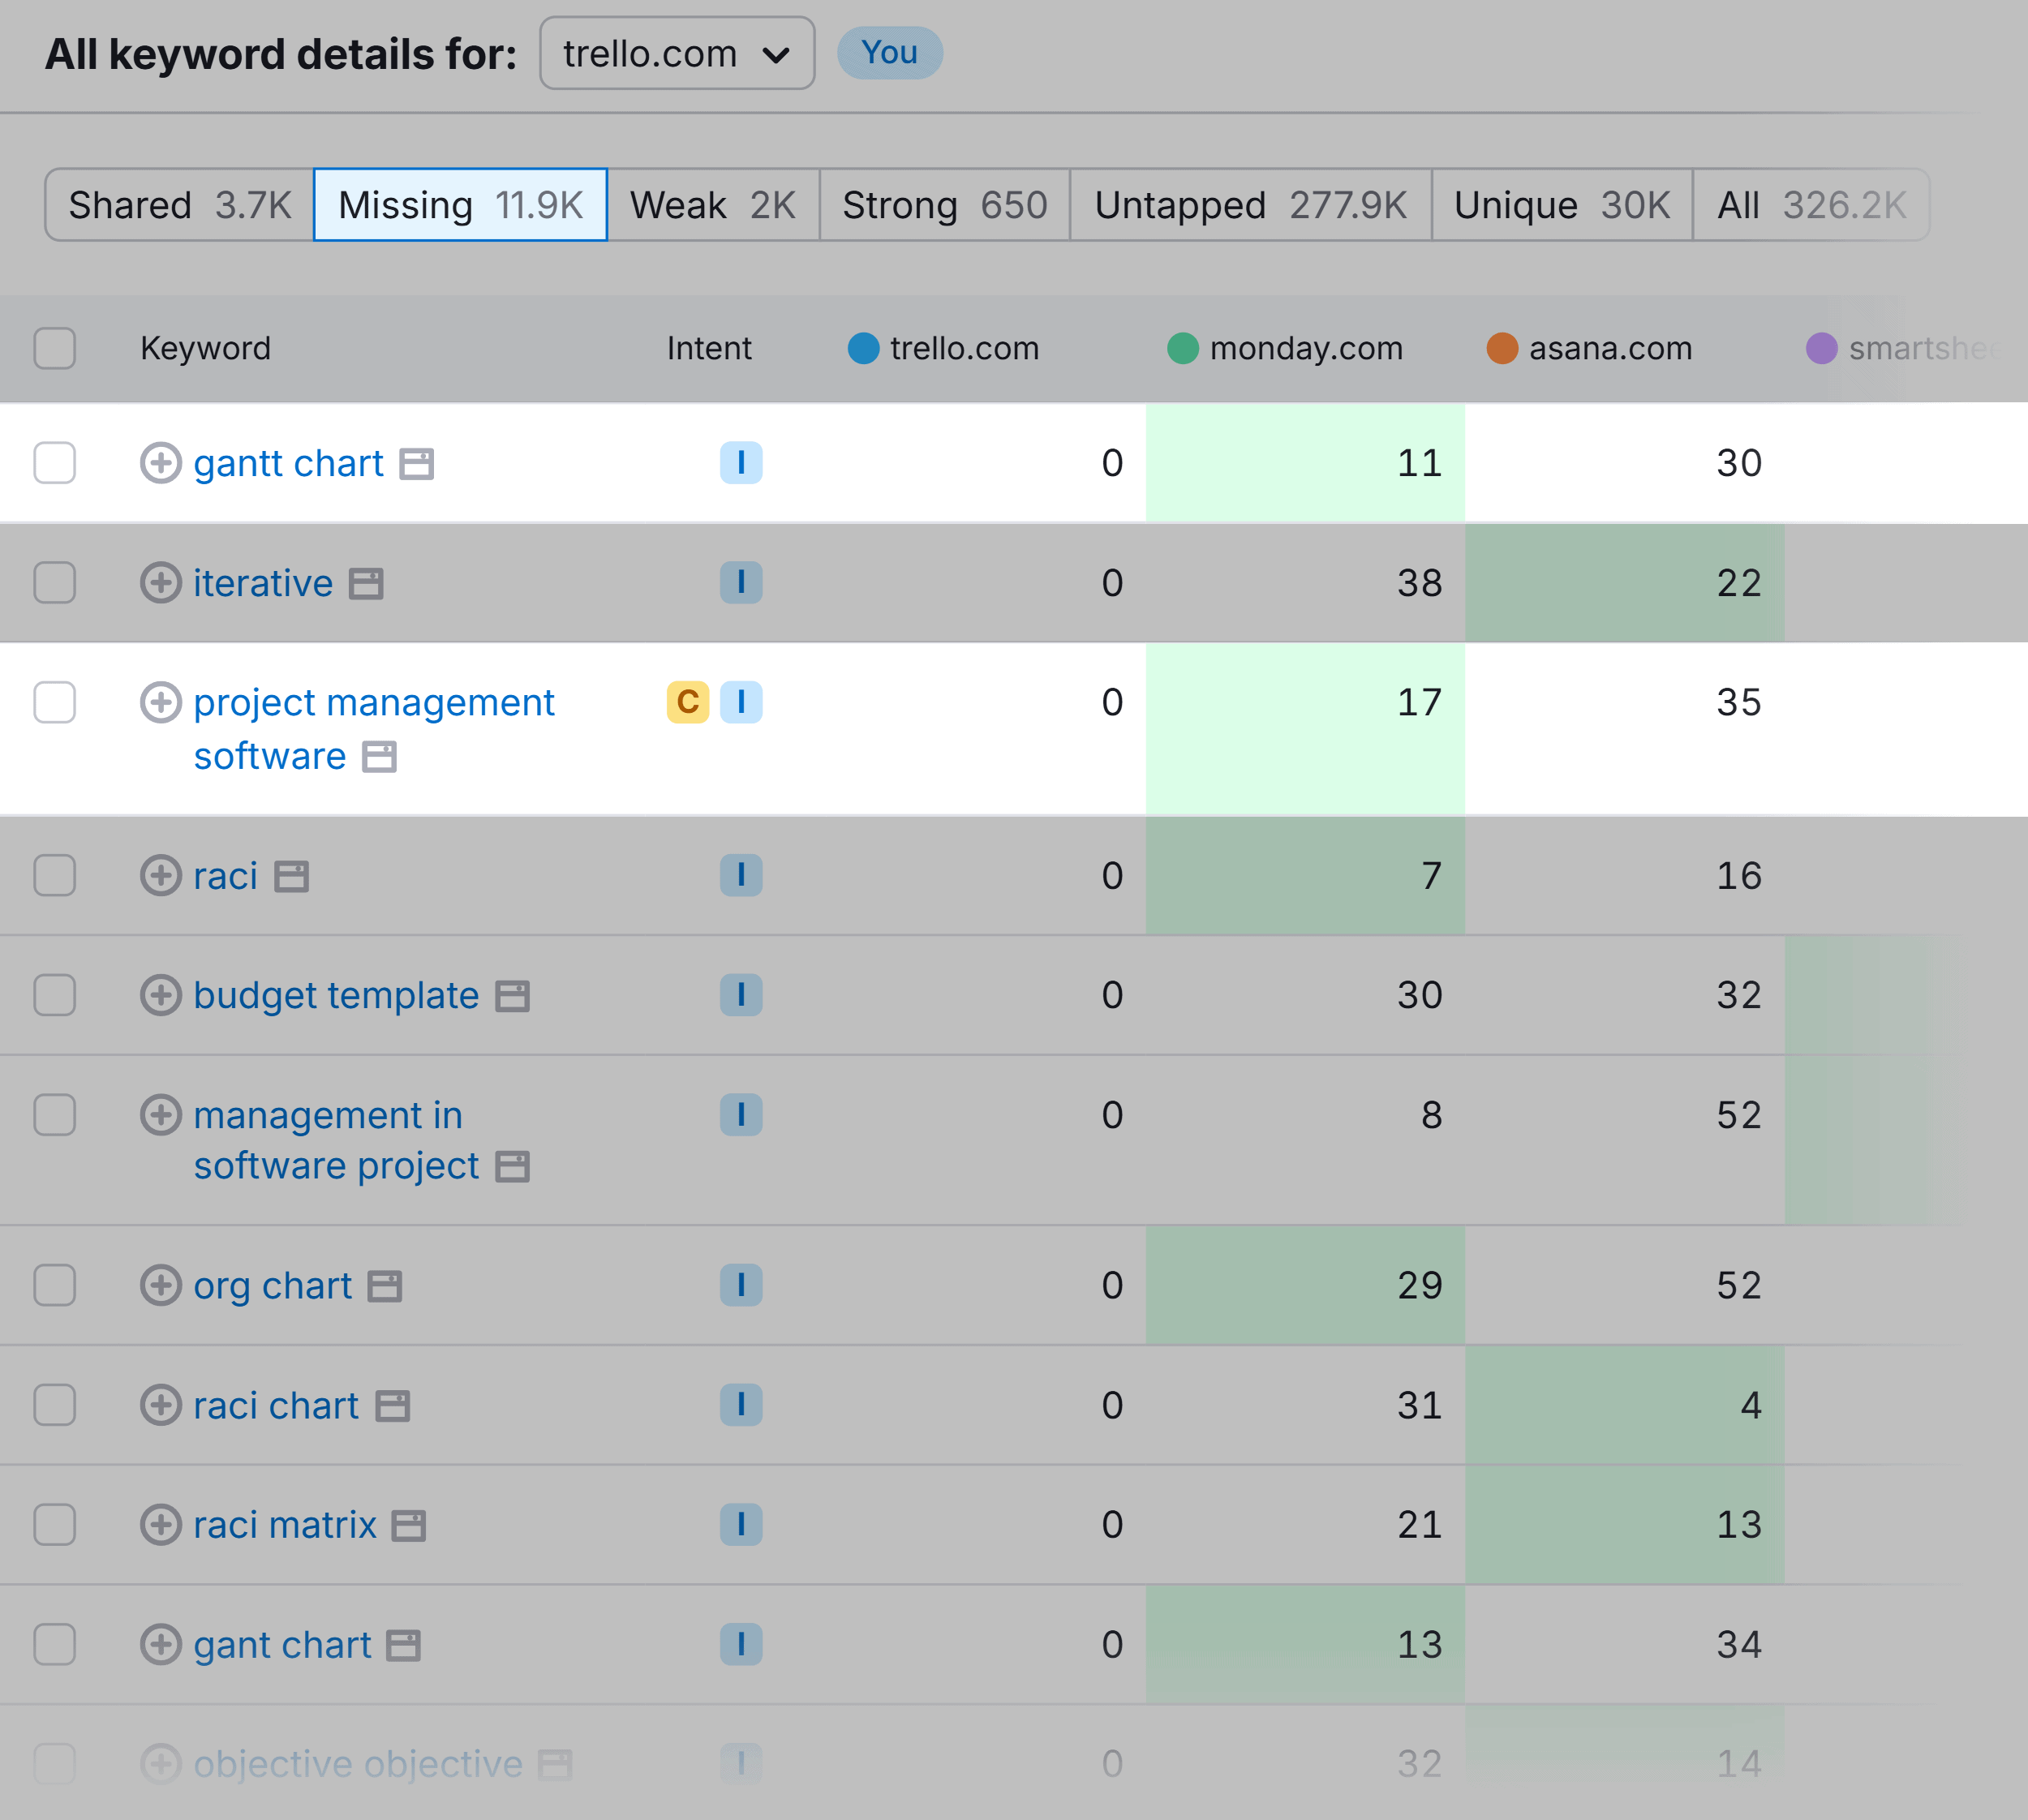
Measuring SoV requires a blend of data extraction and strategic analysis.

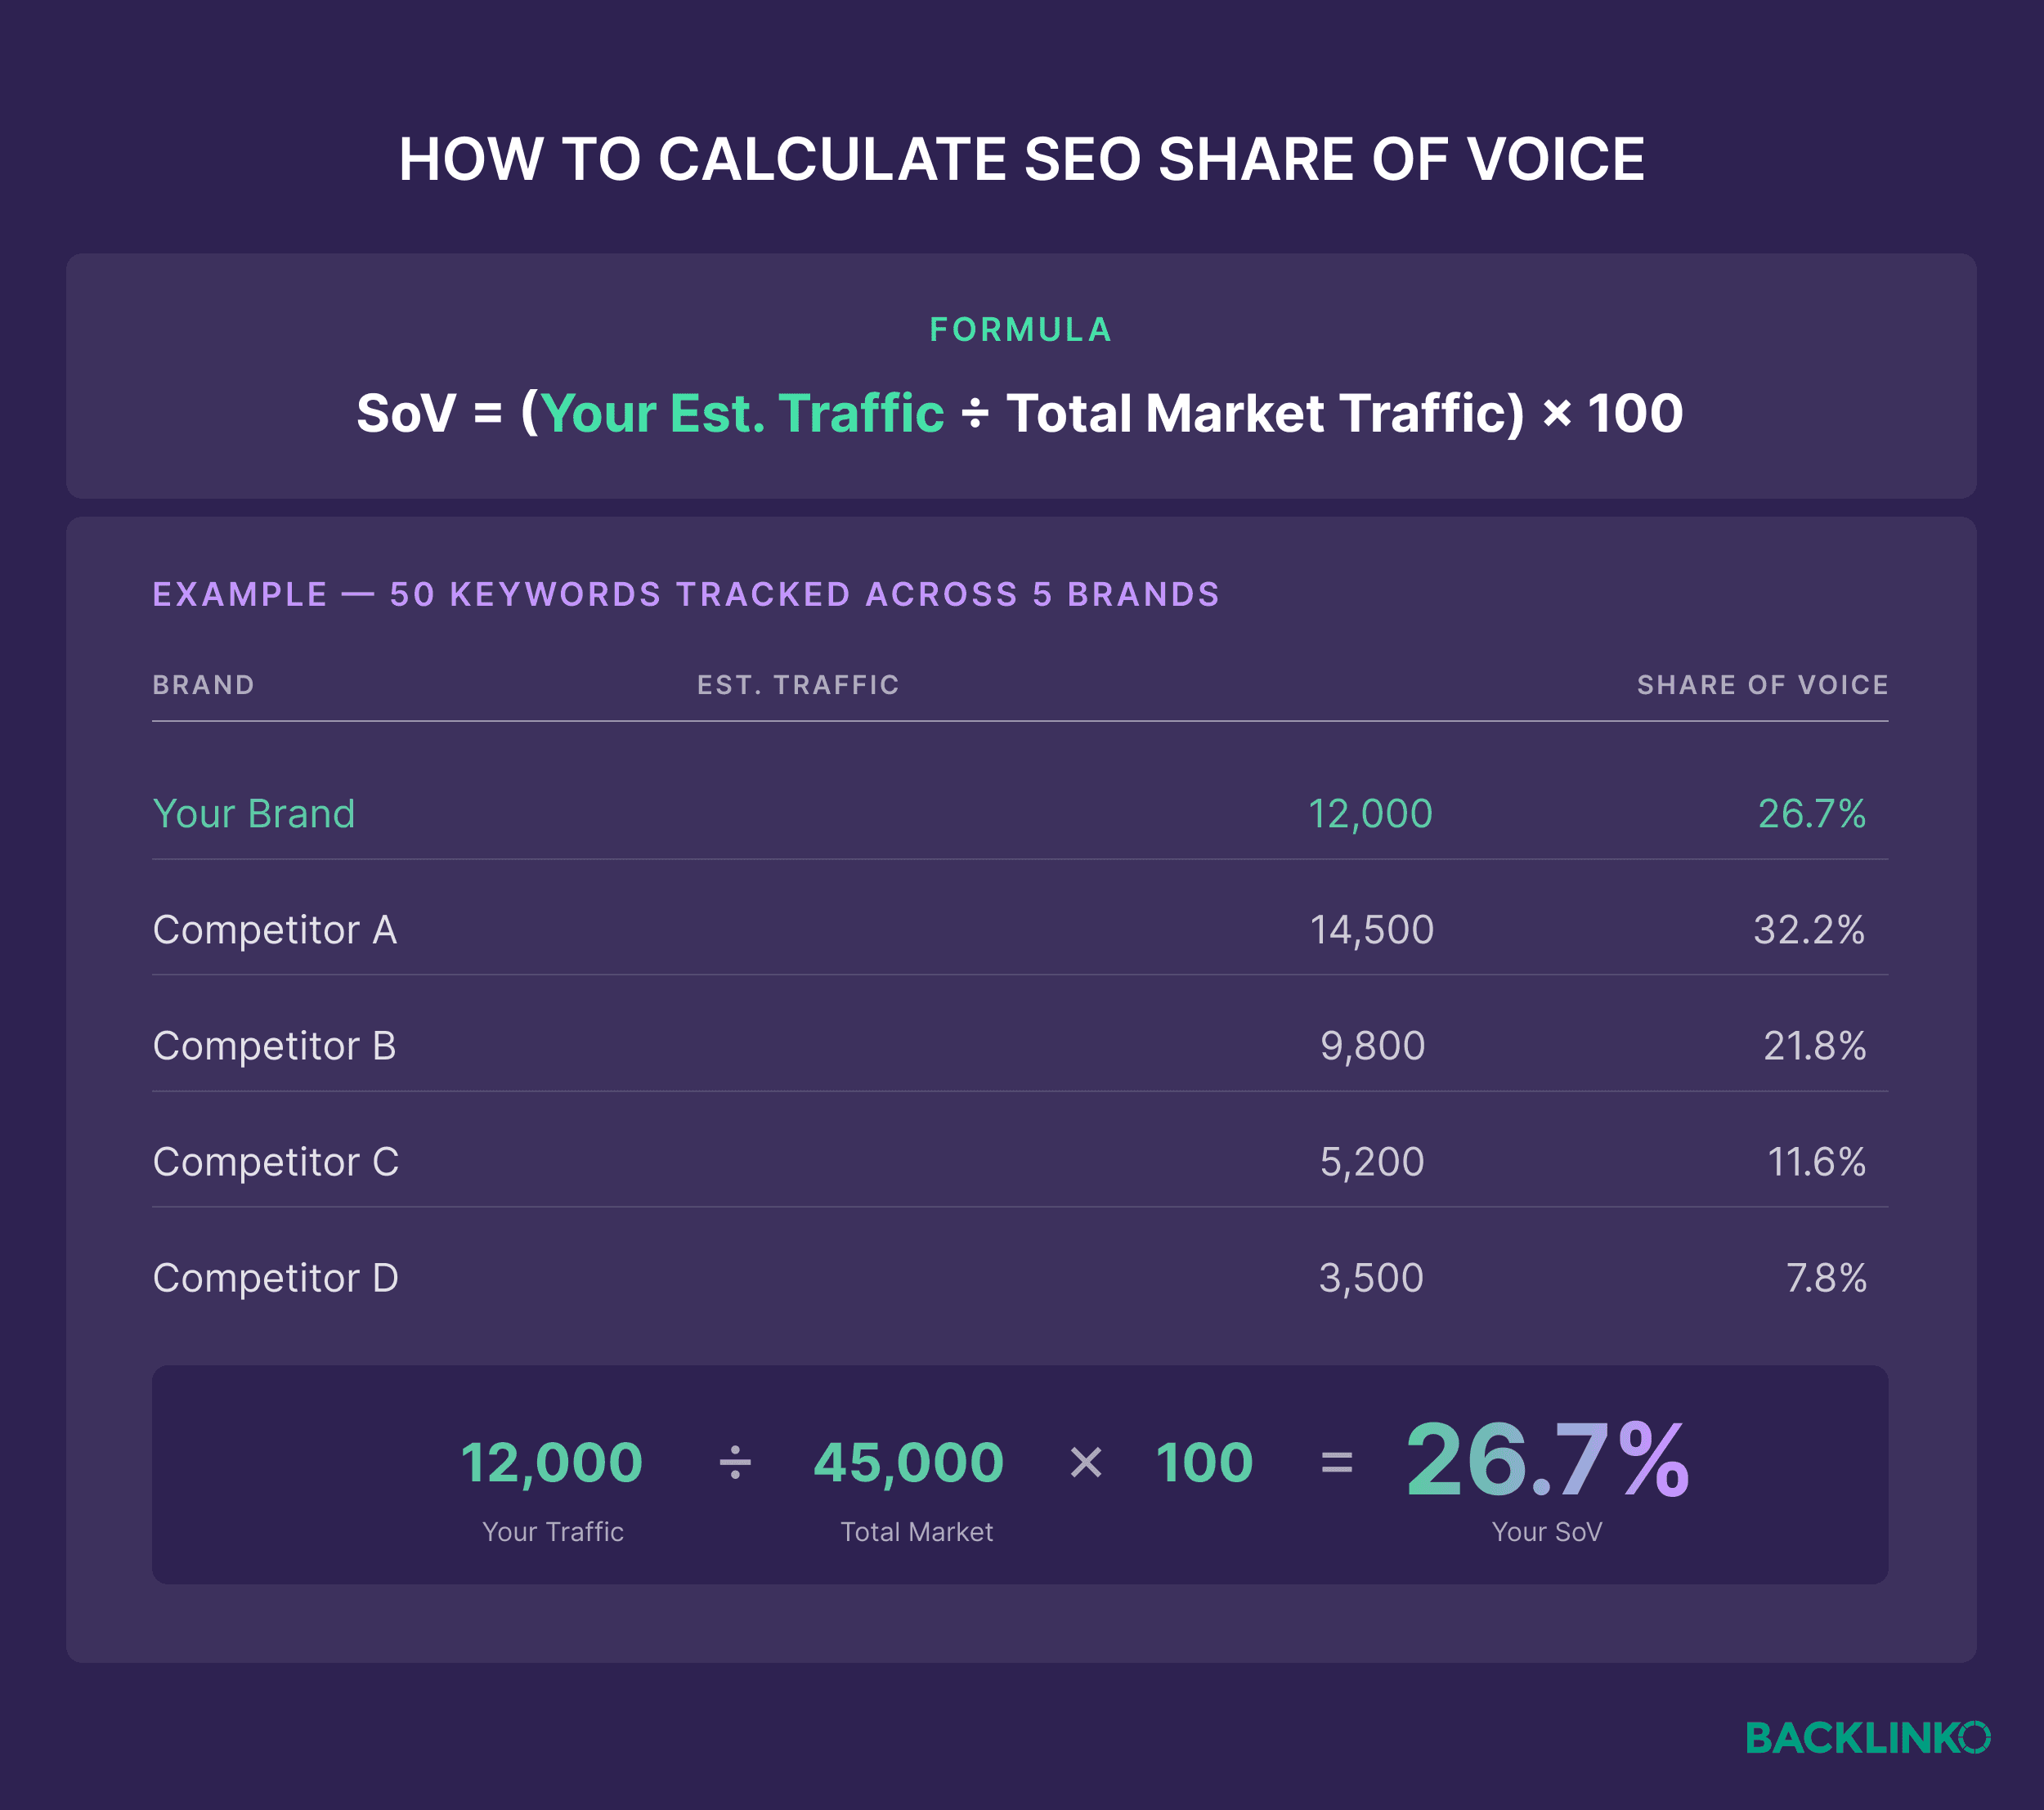
Step 1: Define Your Industry Landscape
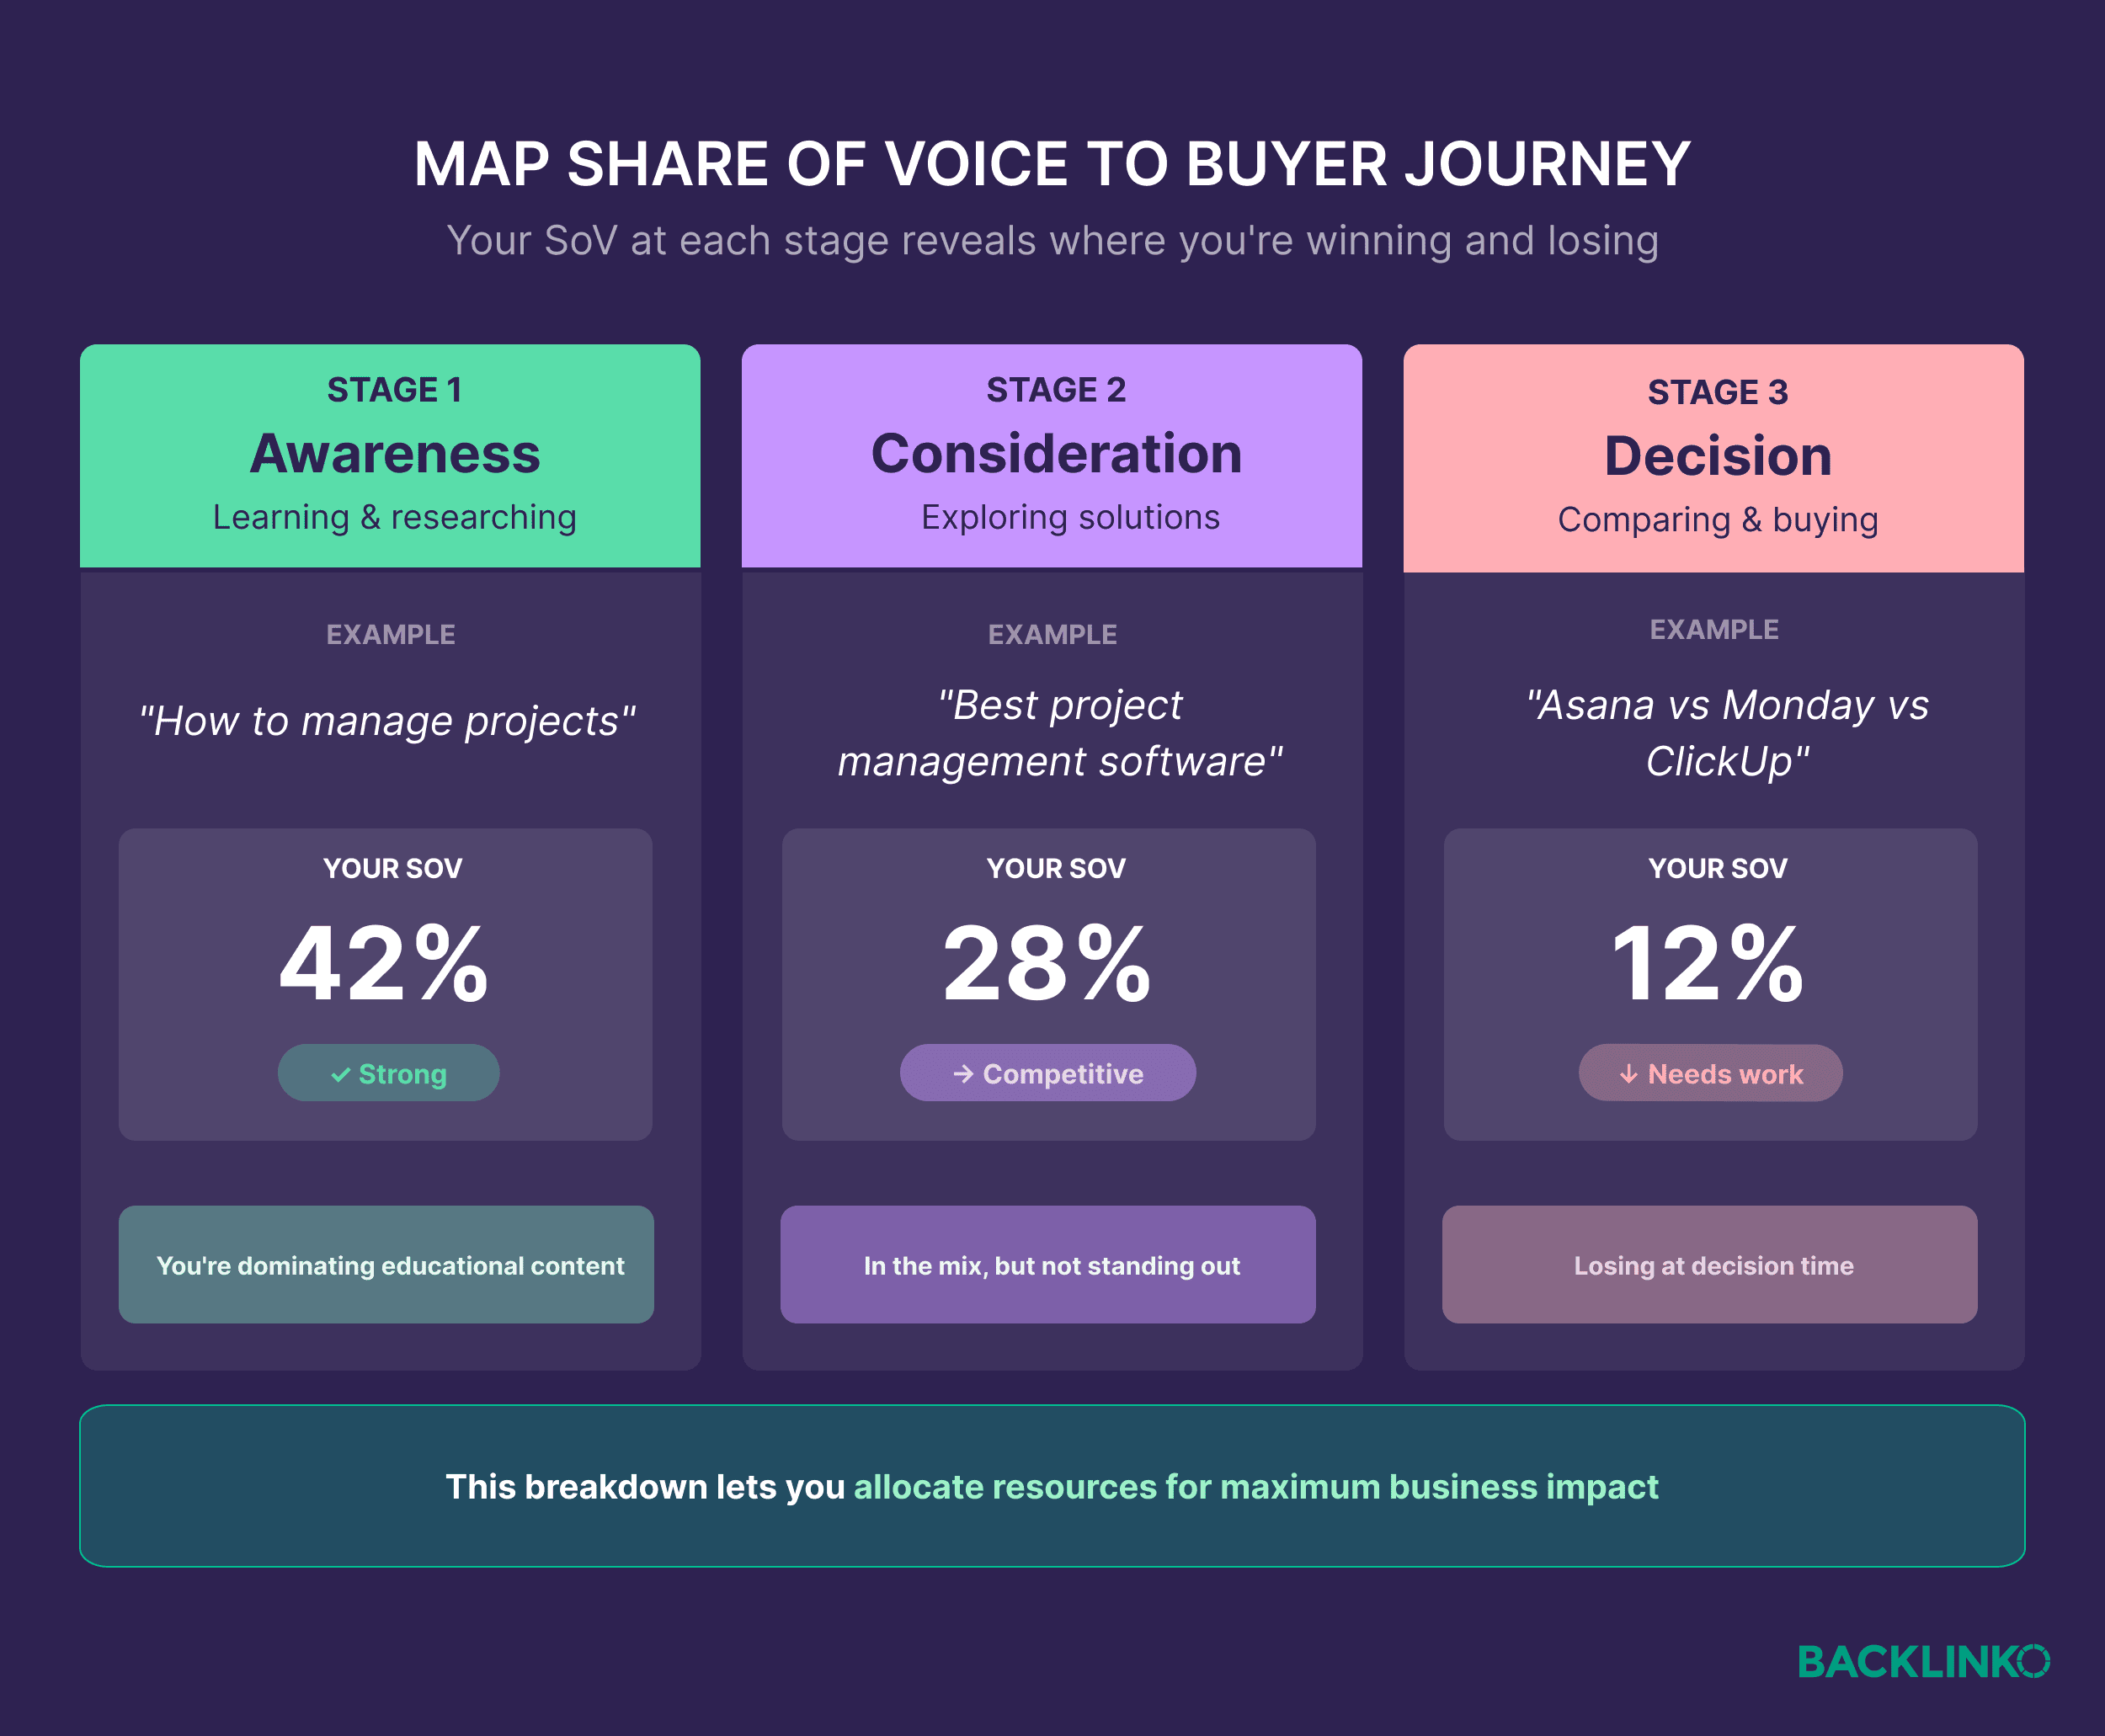
Begin by identifying the topic clusters that drive your revenue. For instance, a project management software company might focus on:
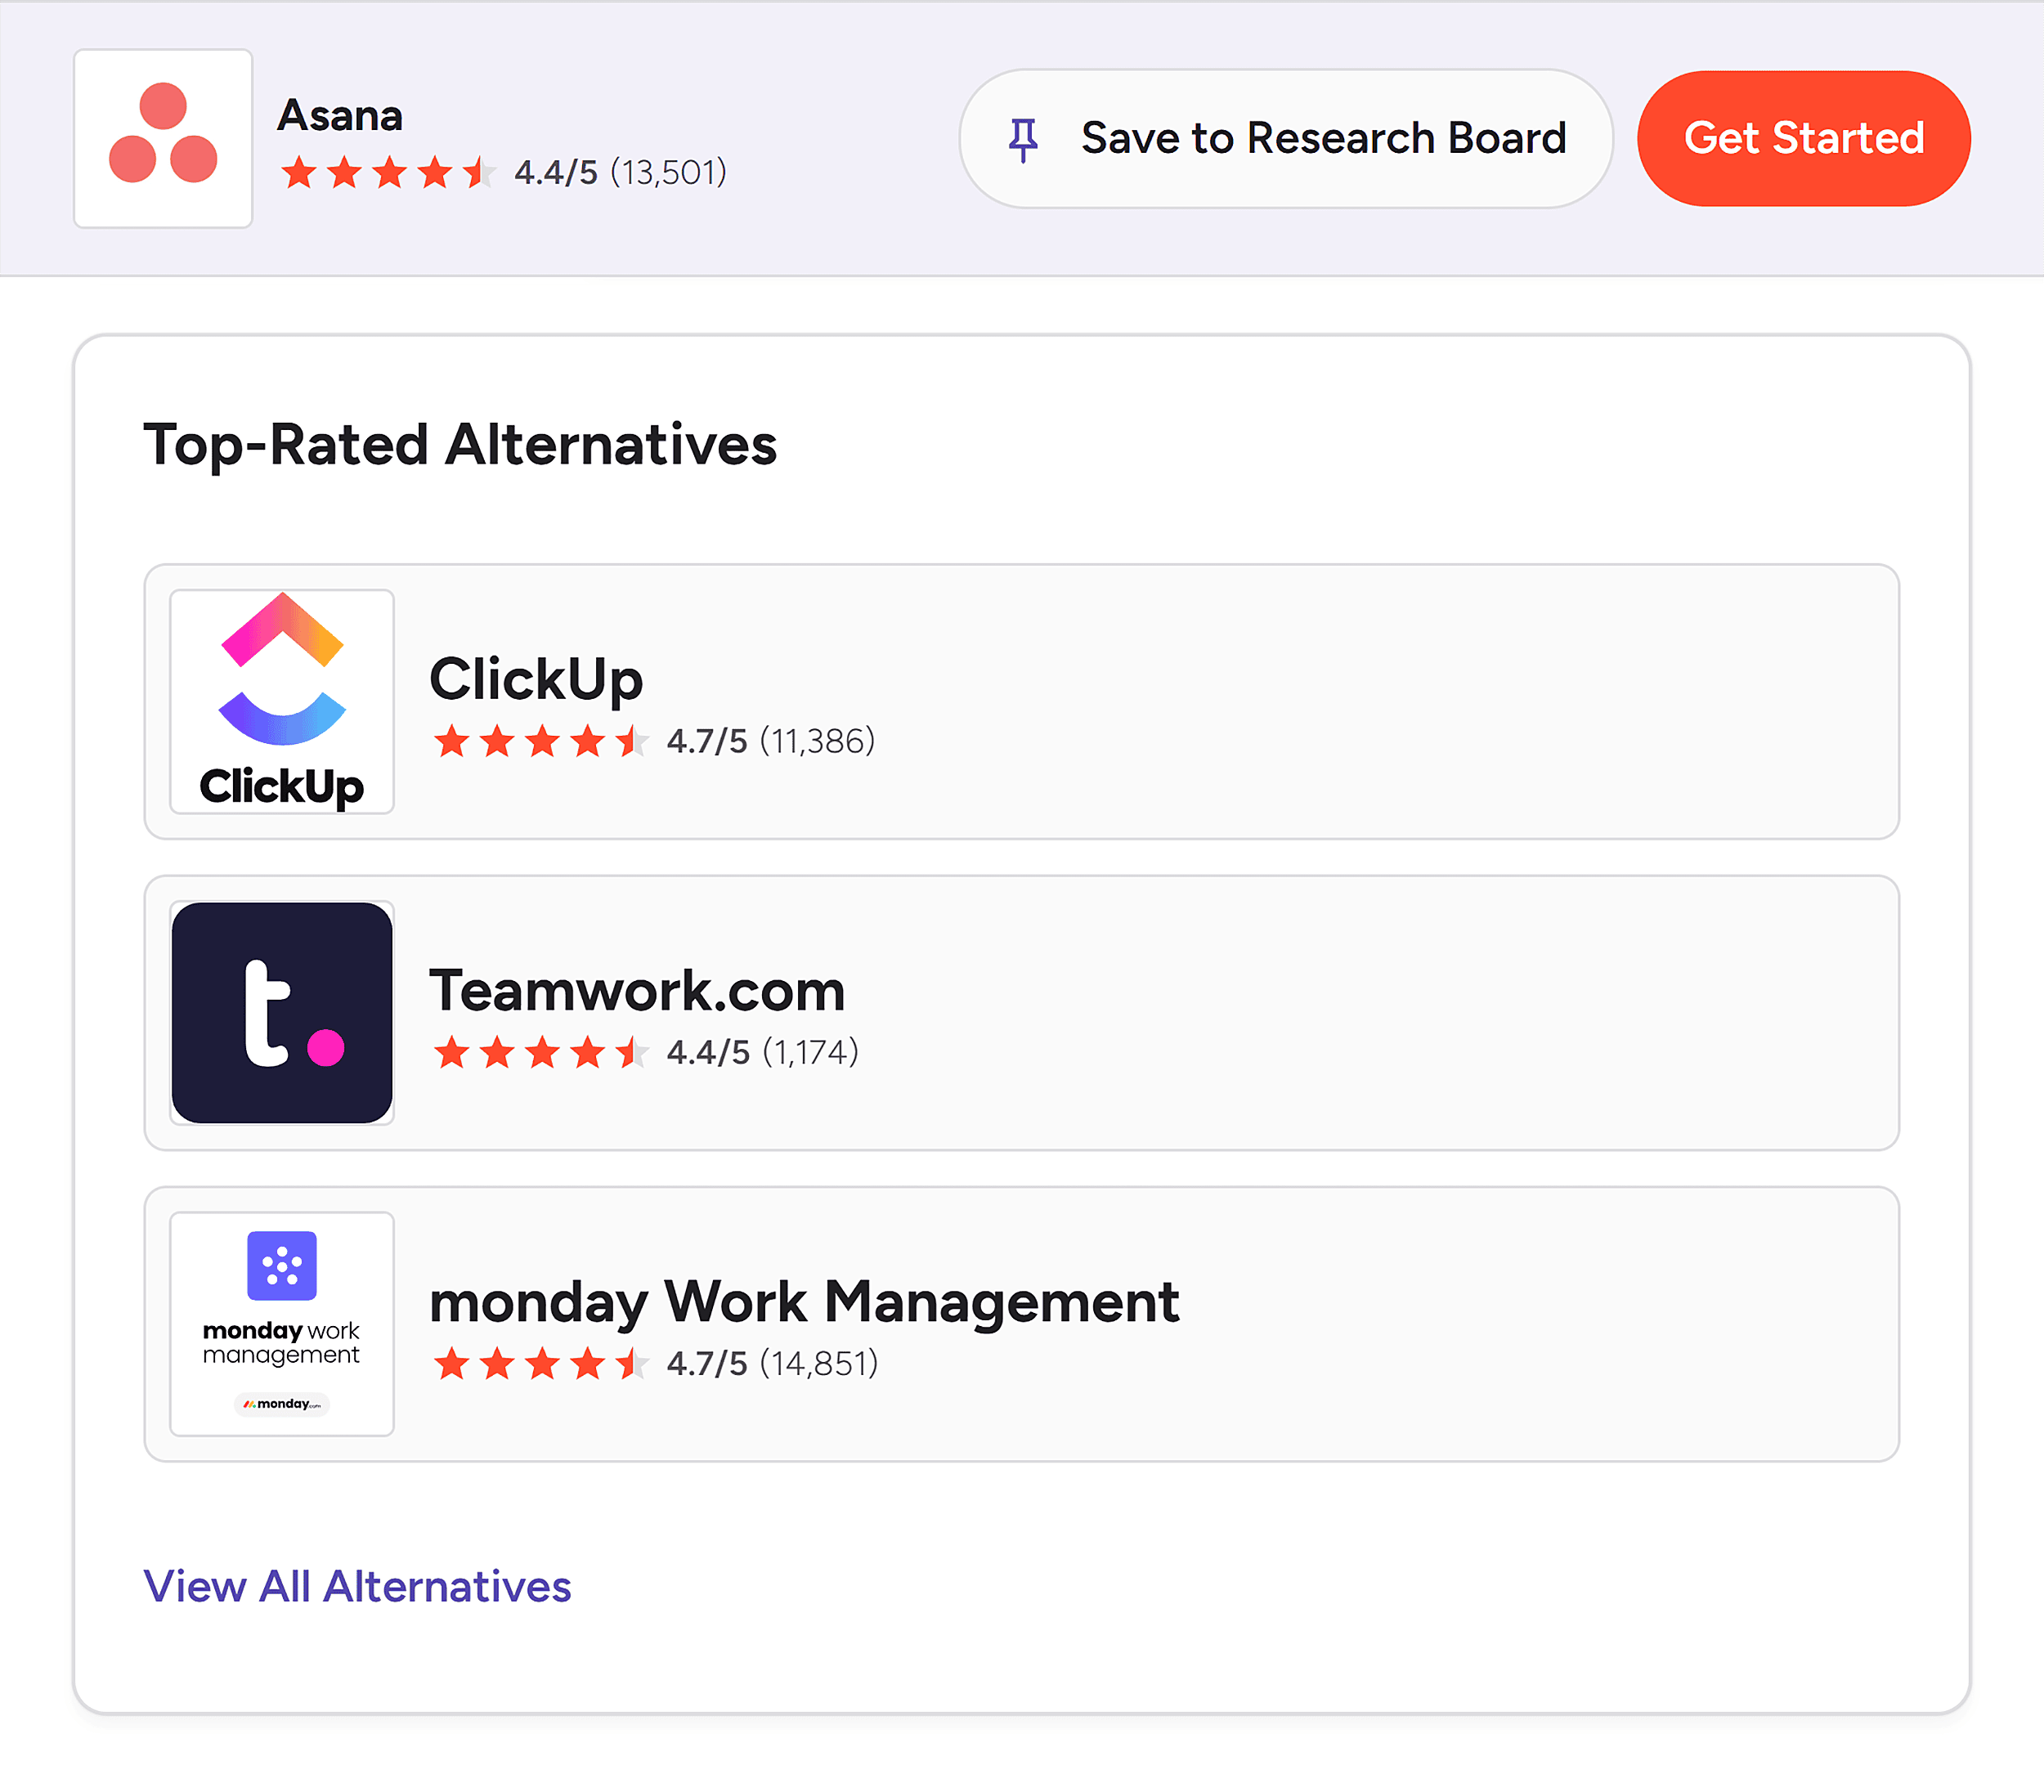
- Awareness: "What is project management?"
- Consideration: "Best software for remote teams."
- Decision: "[Your Brand] vs. [Competitor]."
Mapping these to funnel stages allows you to allocate resources effectively. If you have high visibility in awareness but zero in the decision stage, your marketing is likely failing to close the deal.

Step 2: Build Your Keyword and Prompt Libraries
You need to capture how people search (keywords) and how they talk (AI prompts).
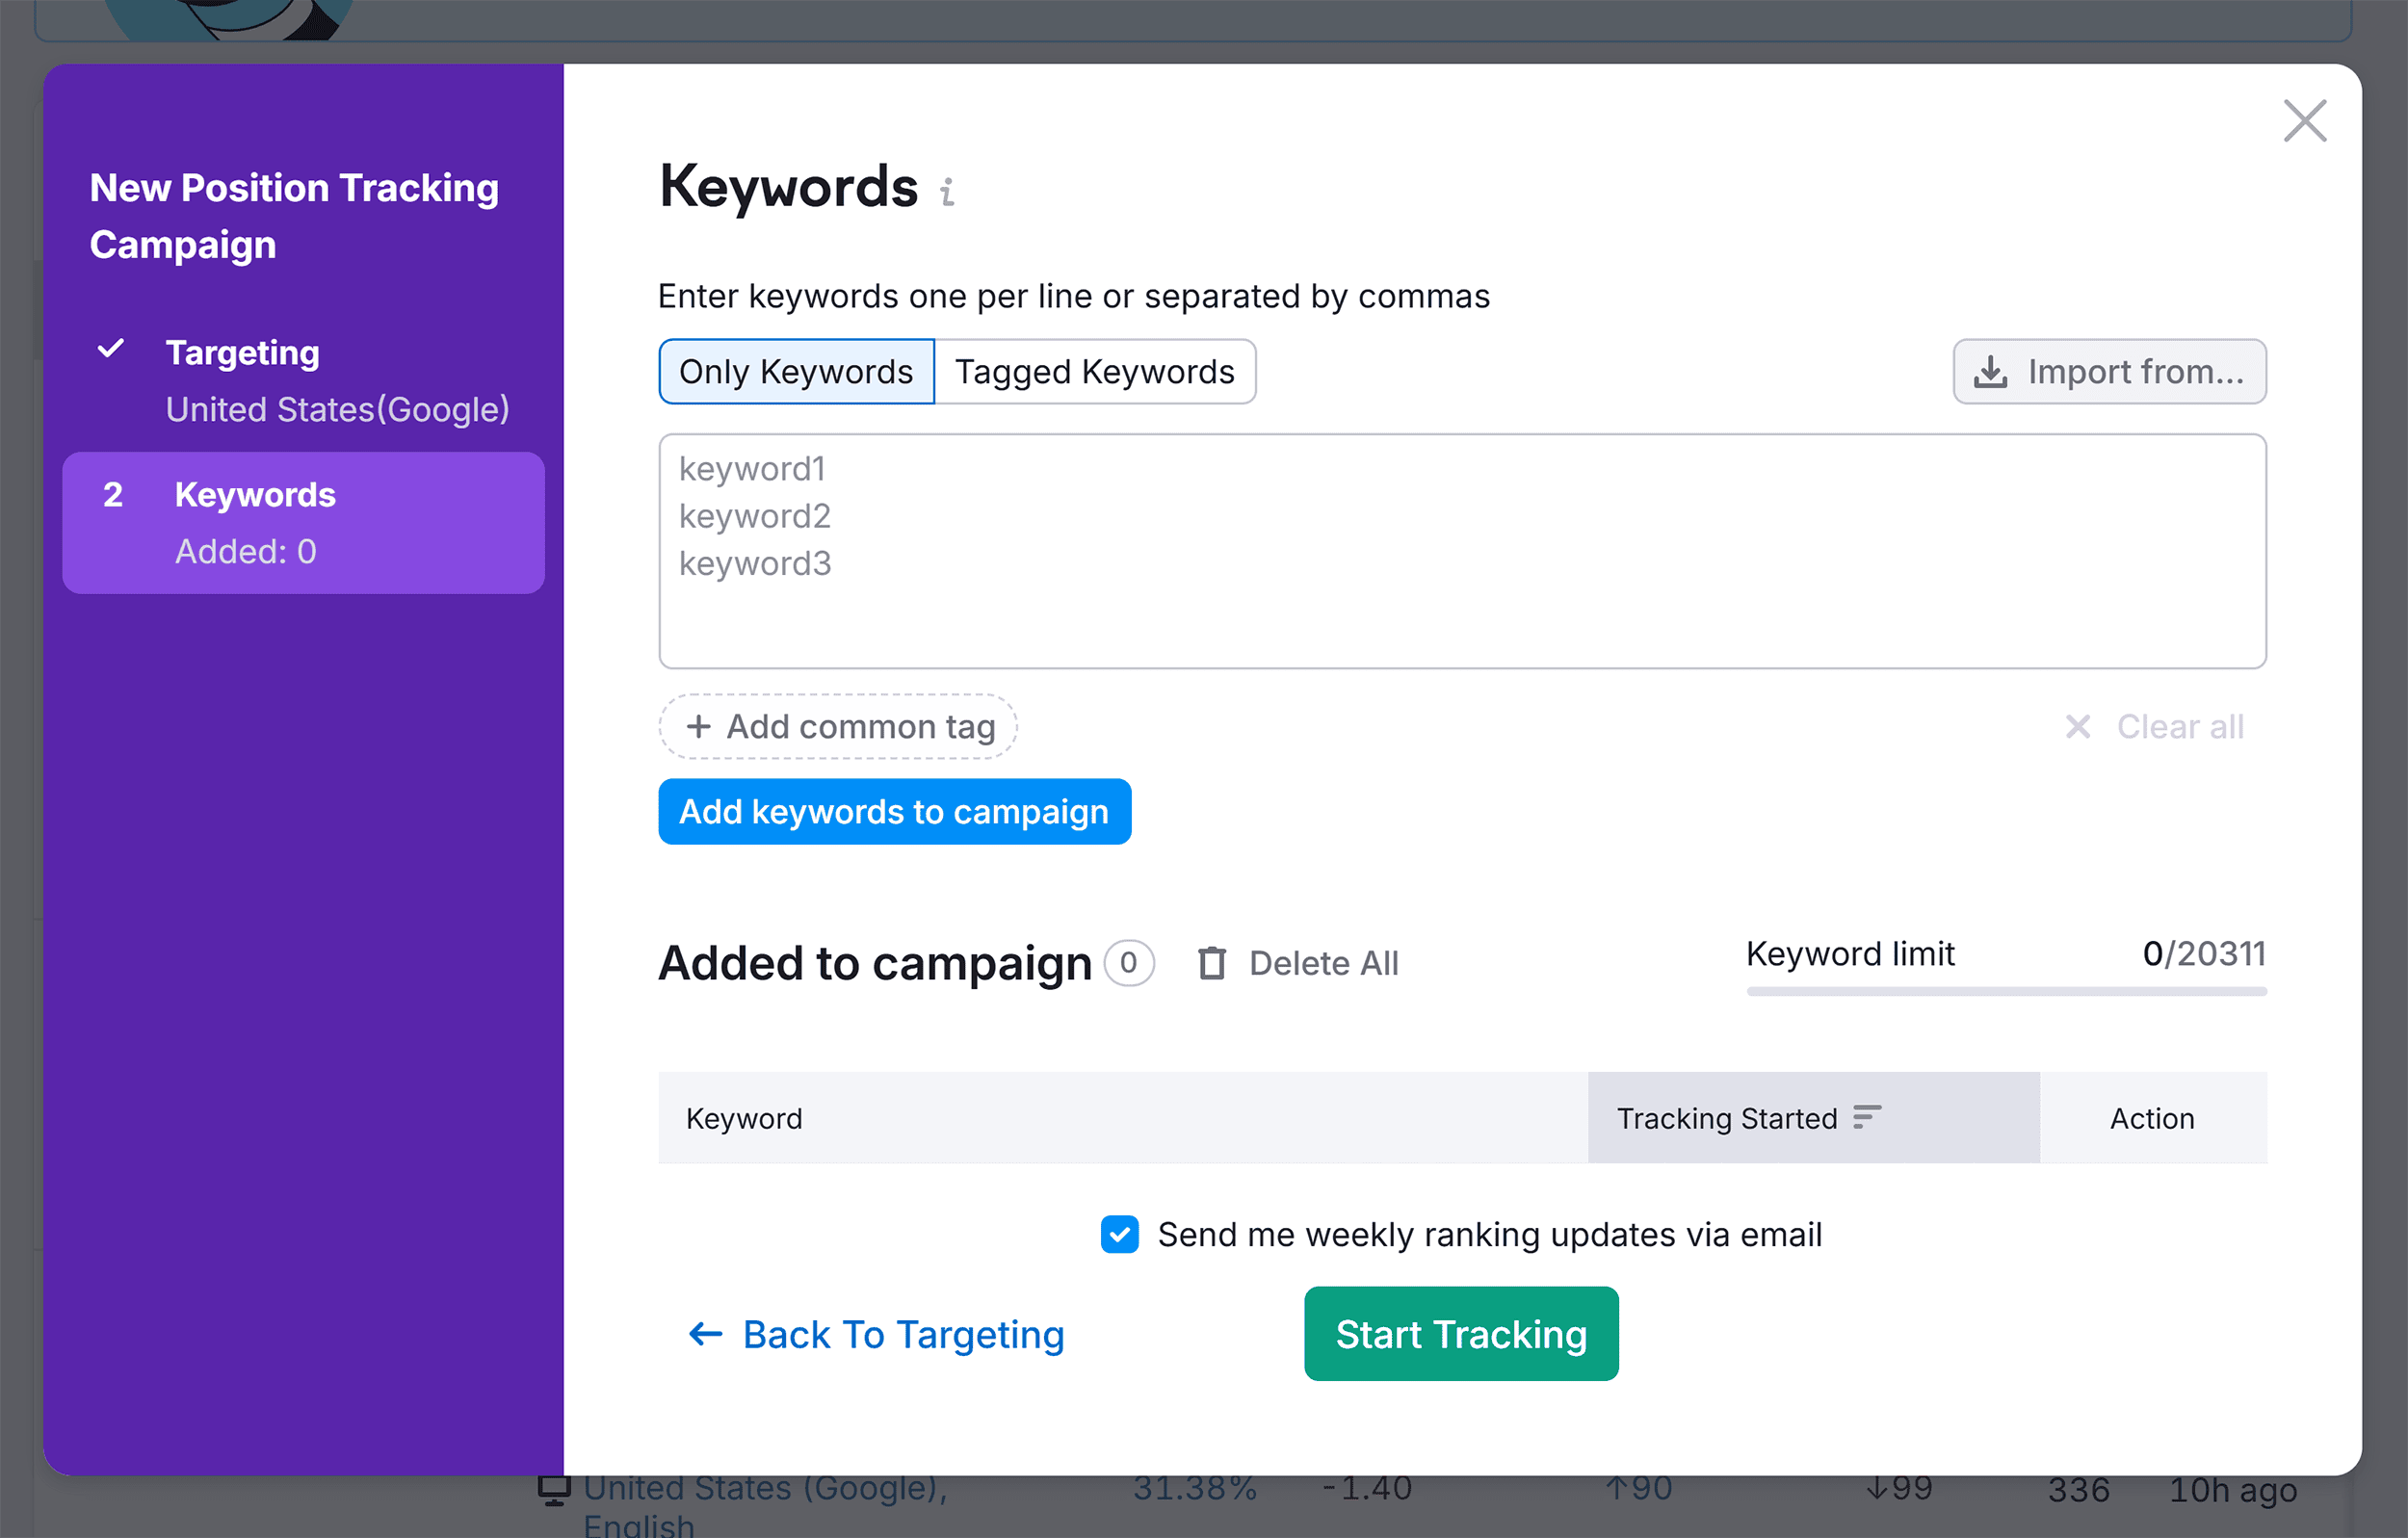
- SEO Data: Export query data from Google Search Console and high-converting PPC keywords.
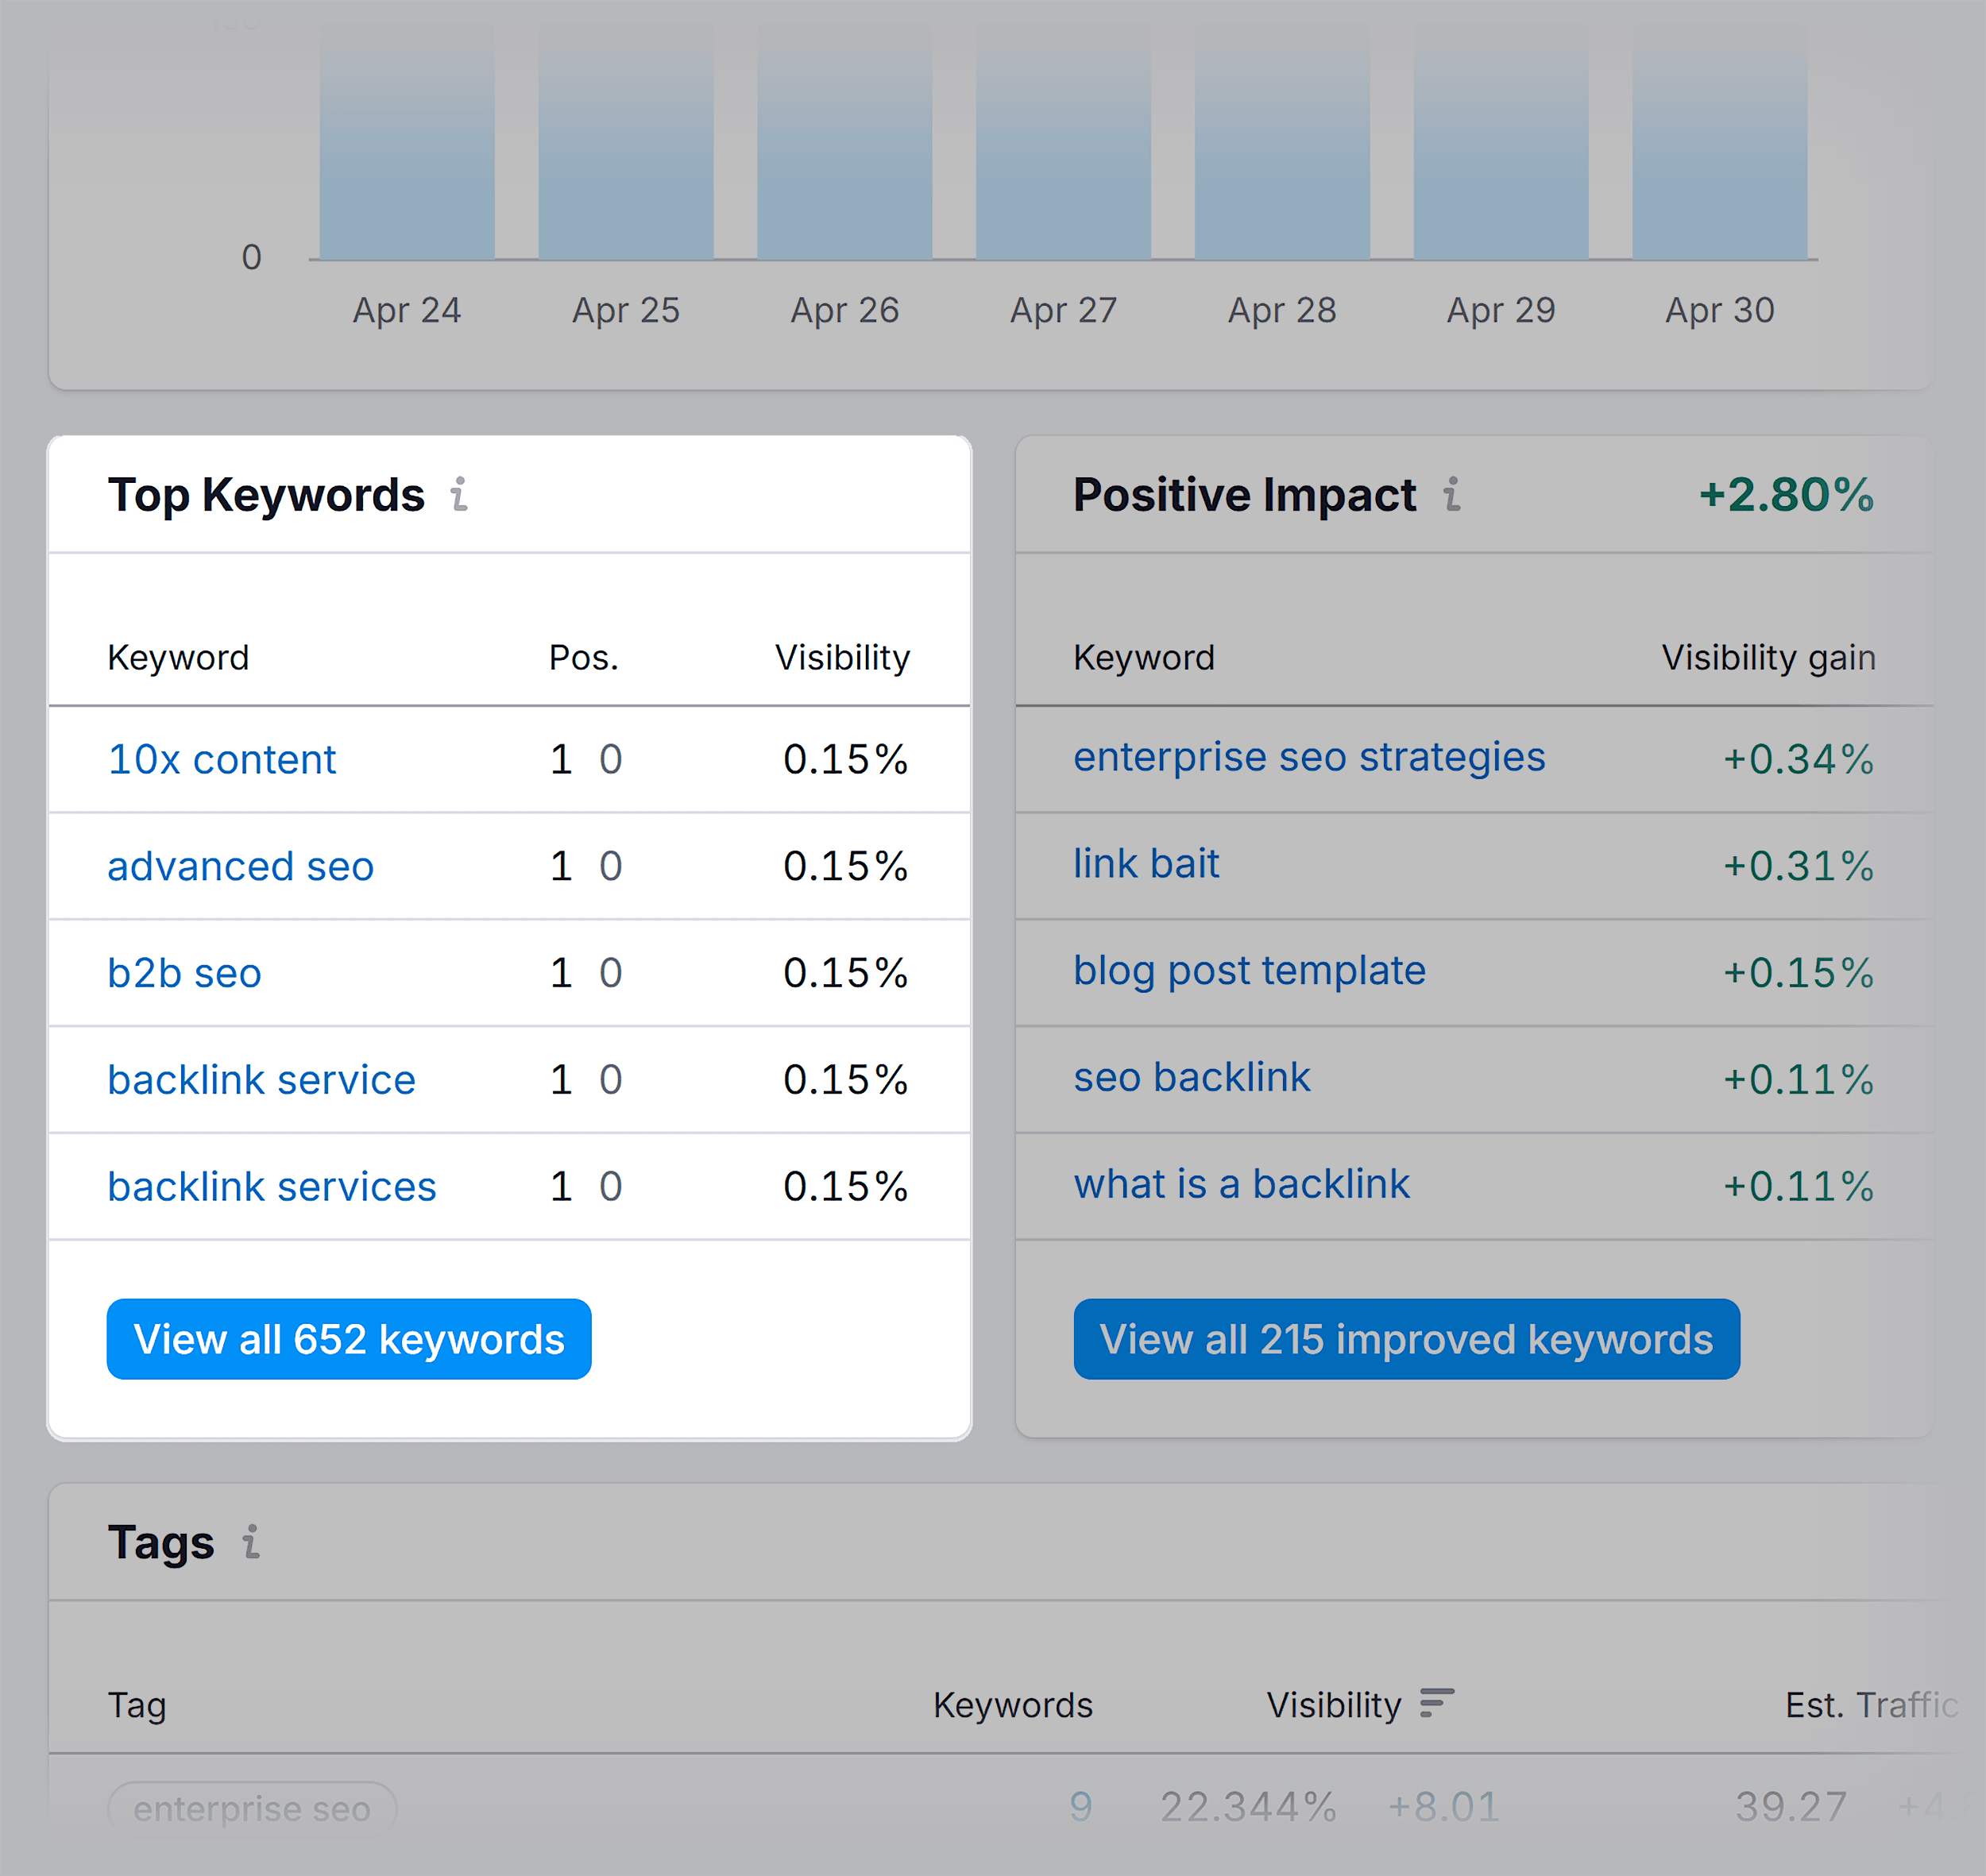
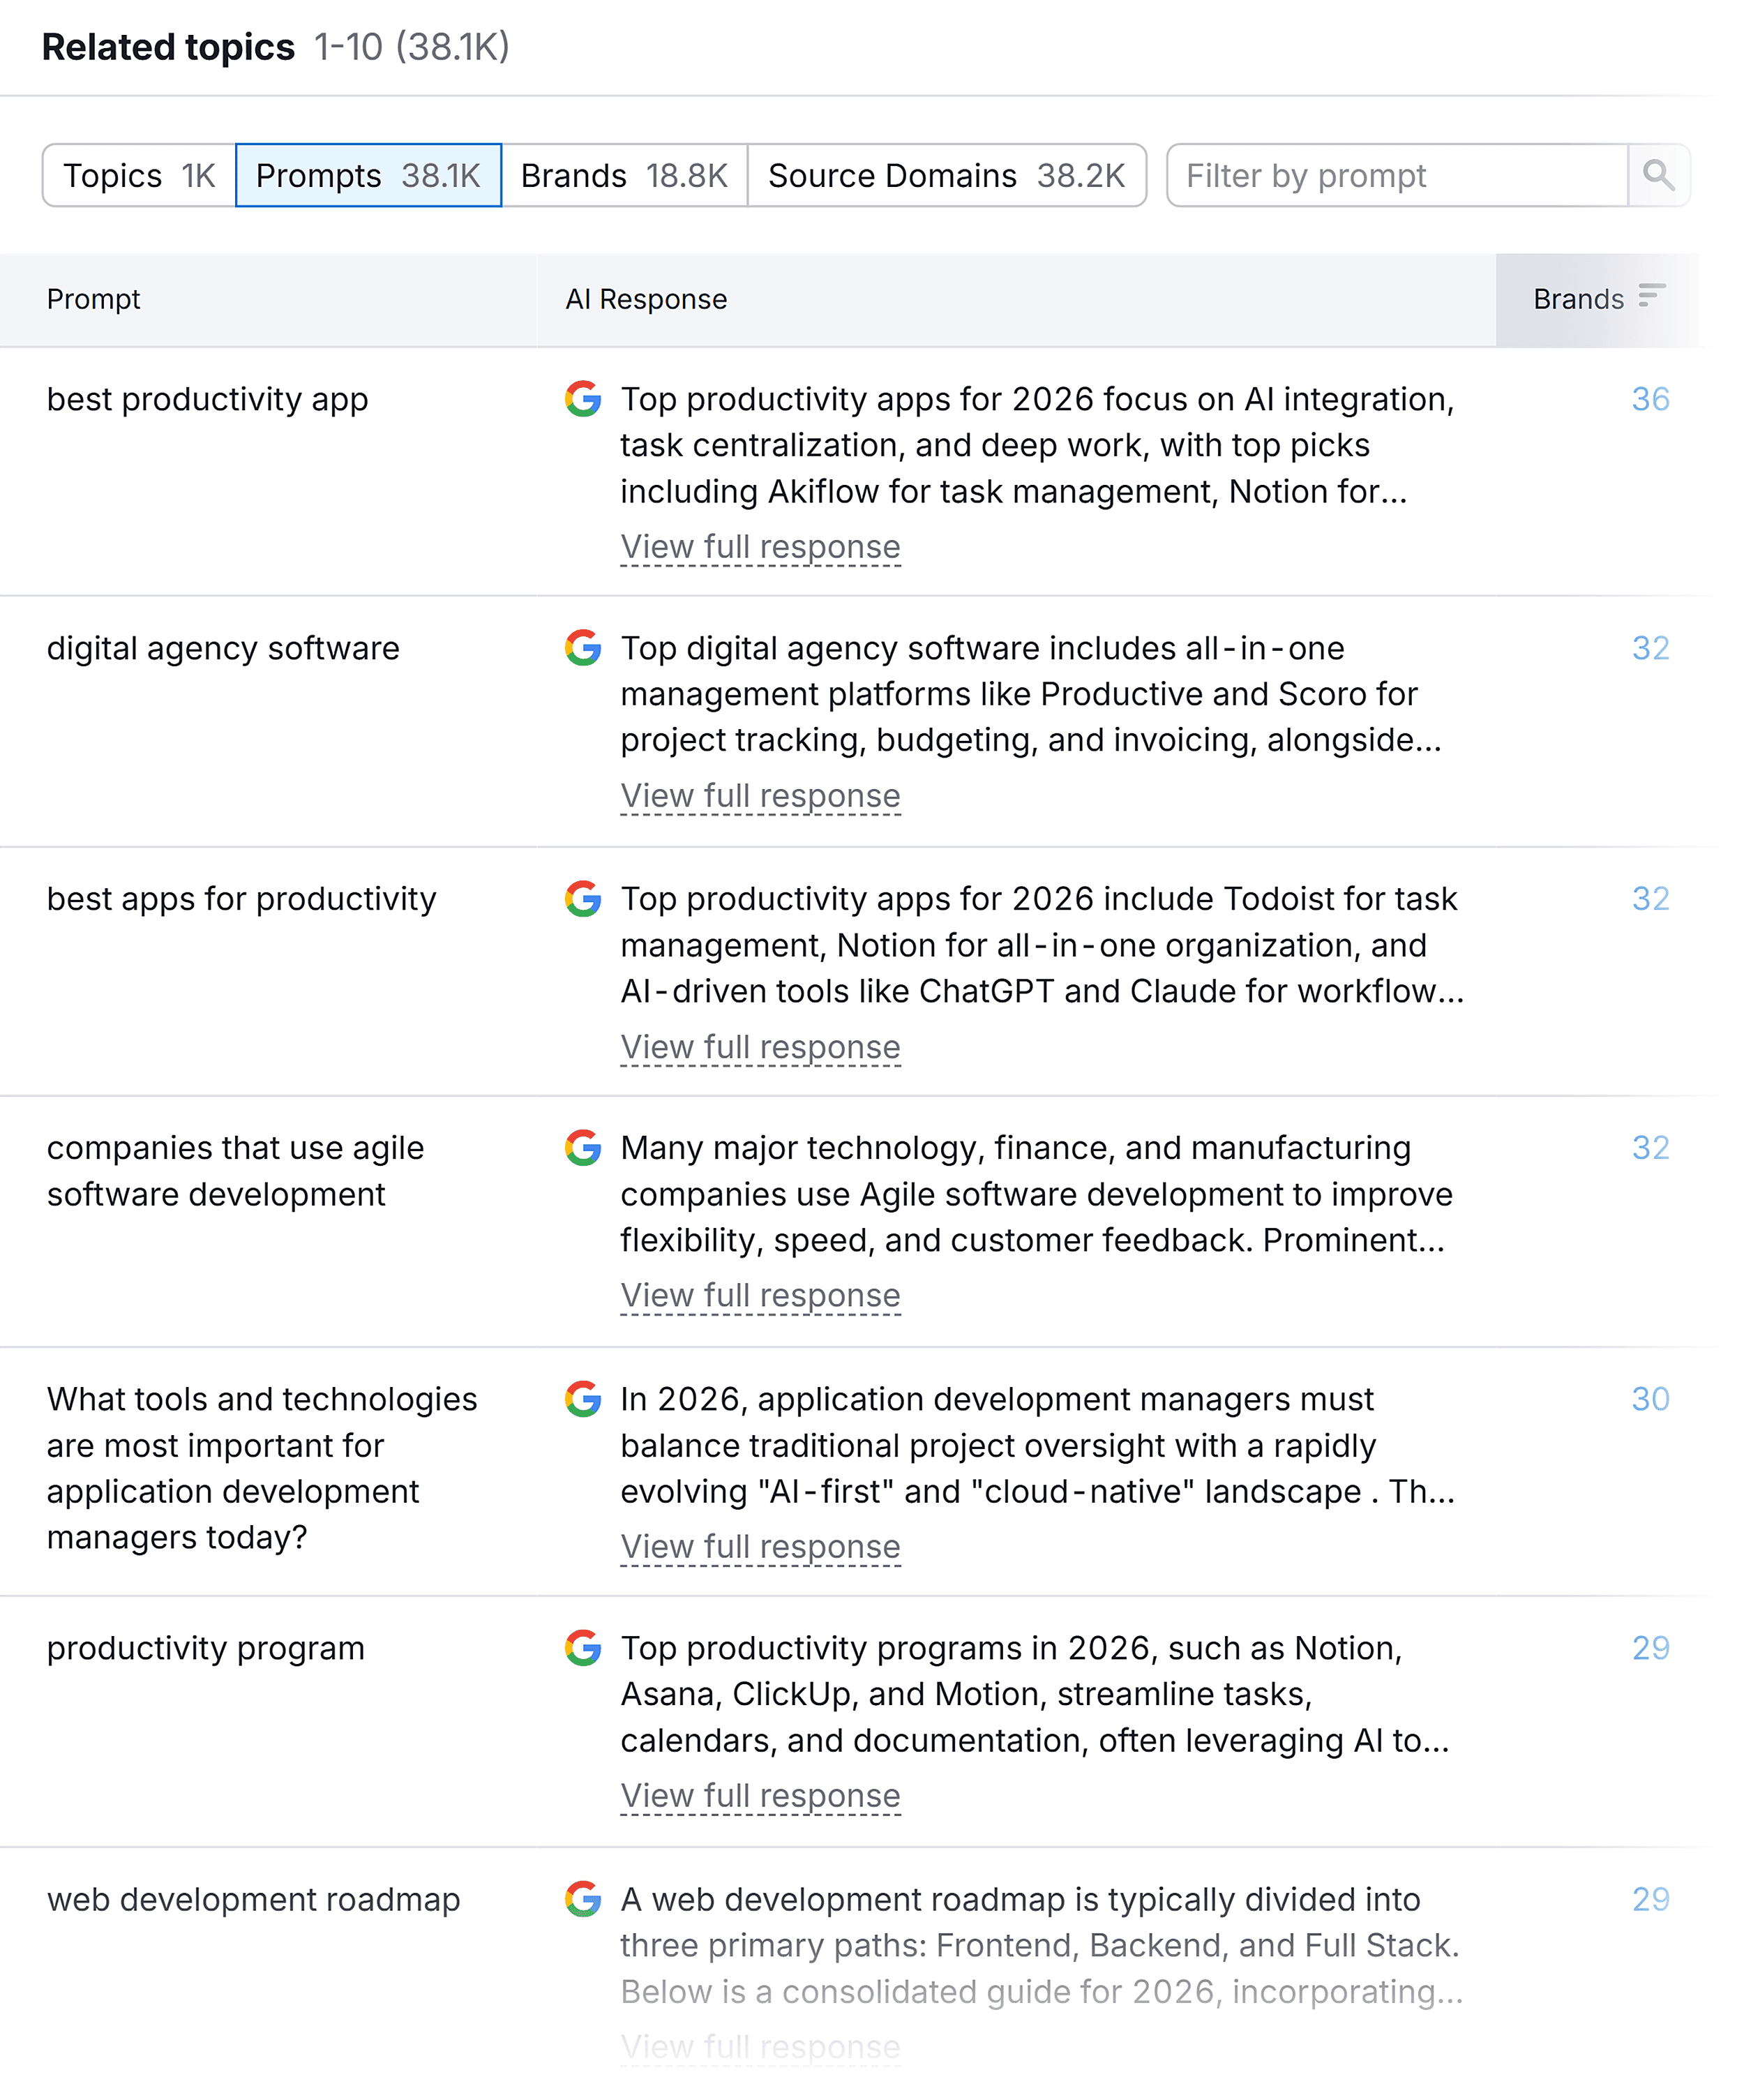
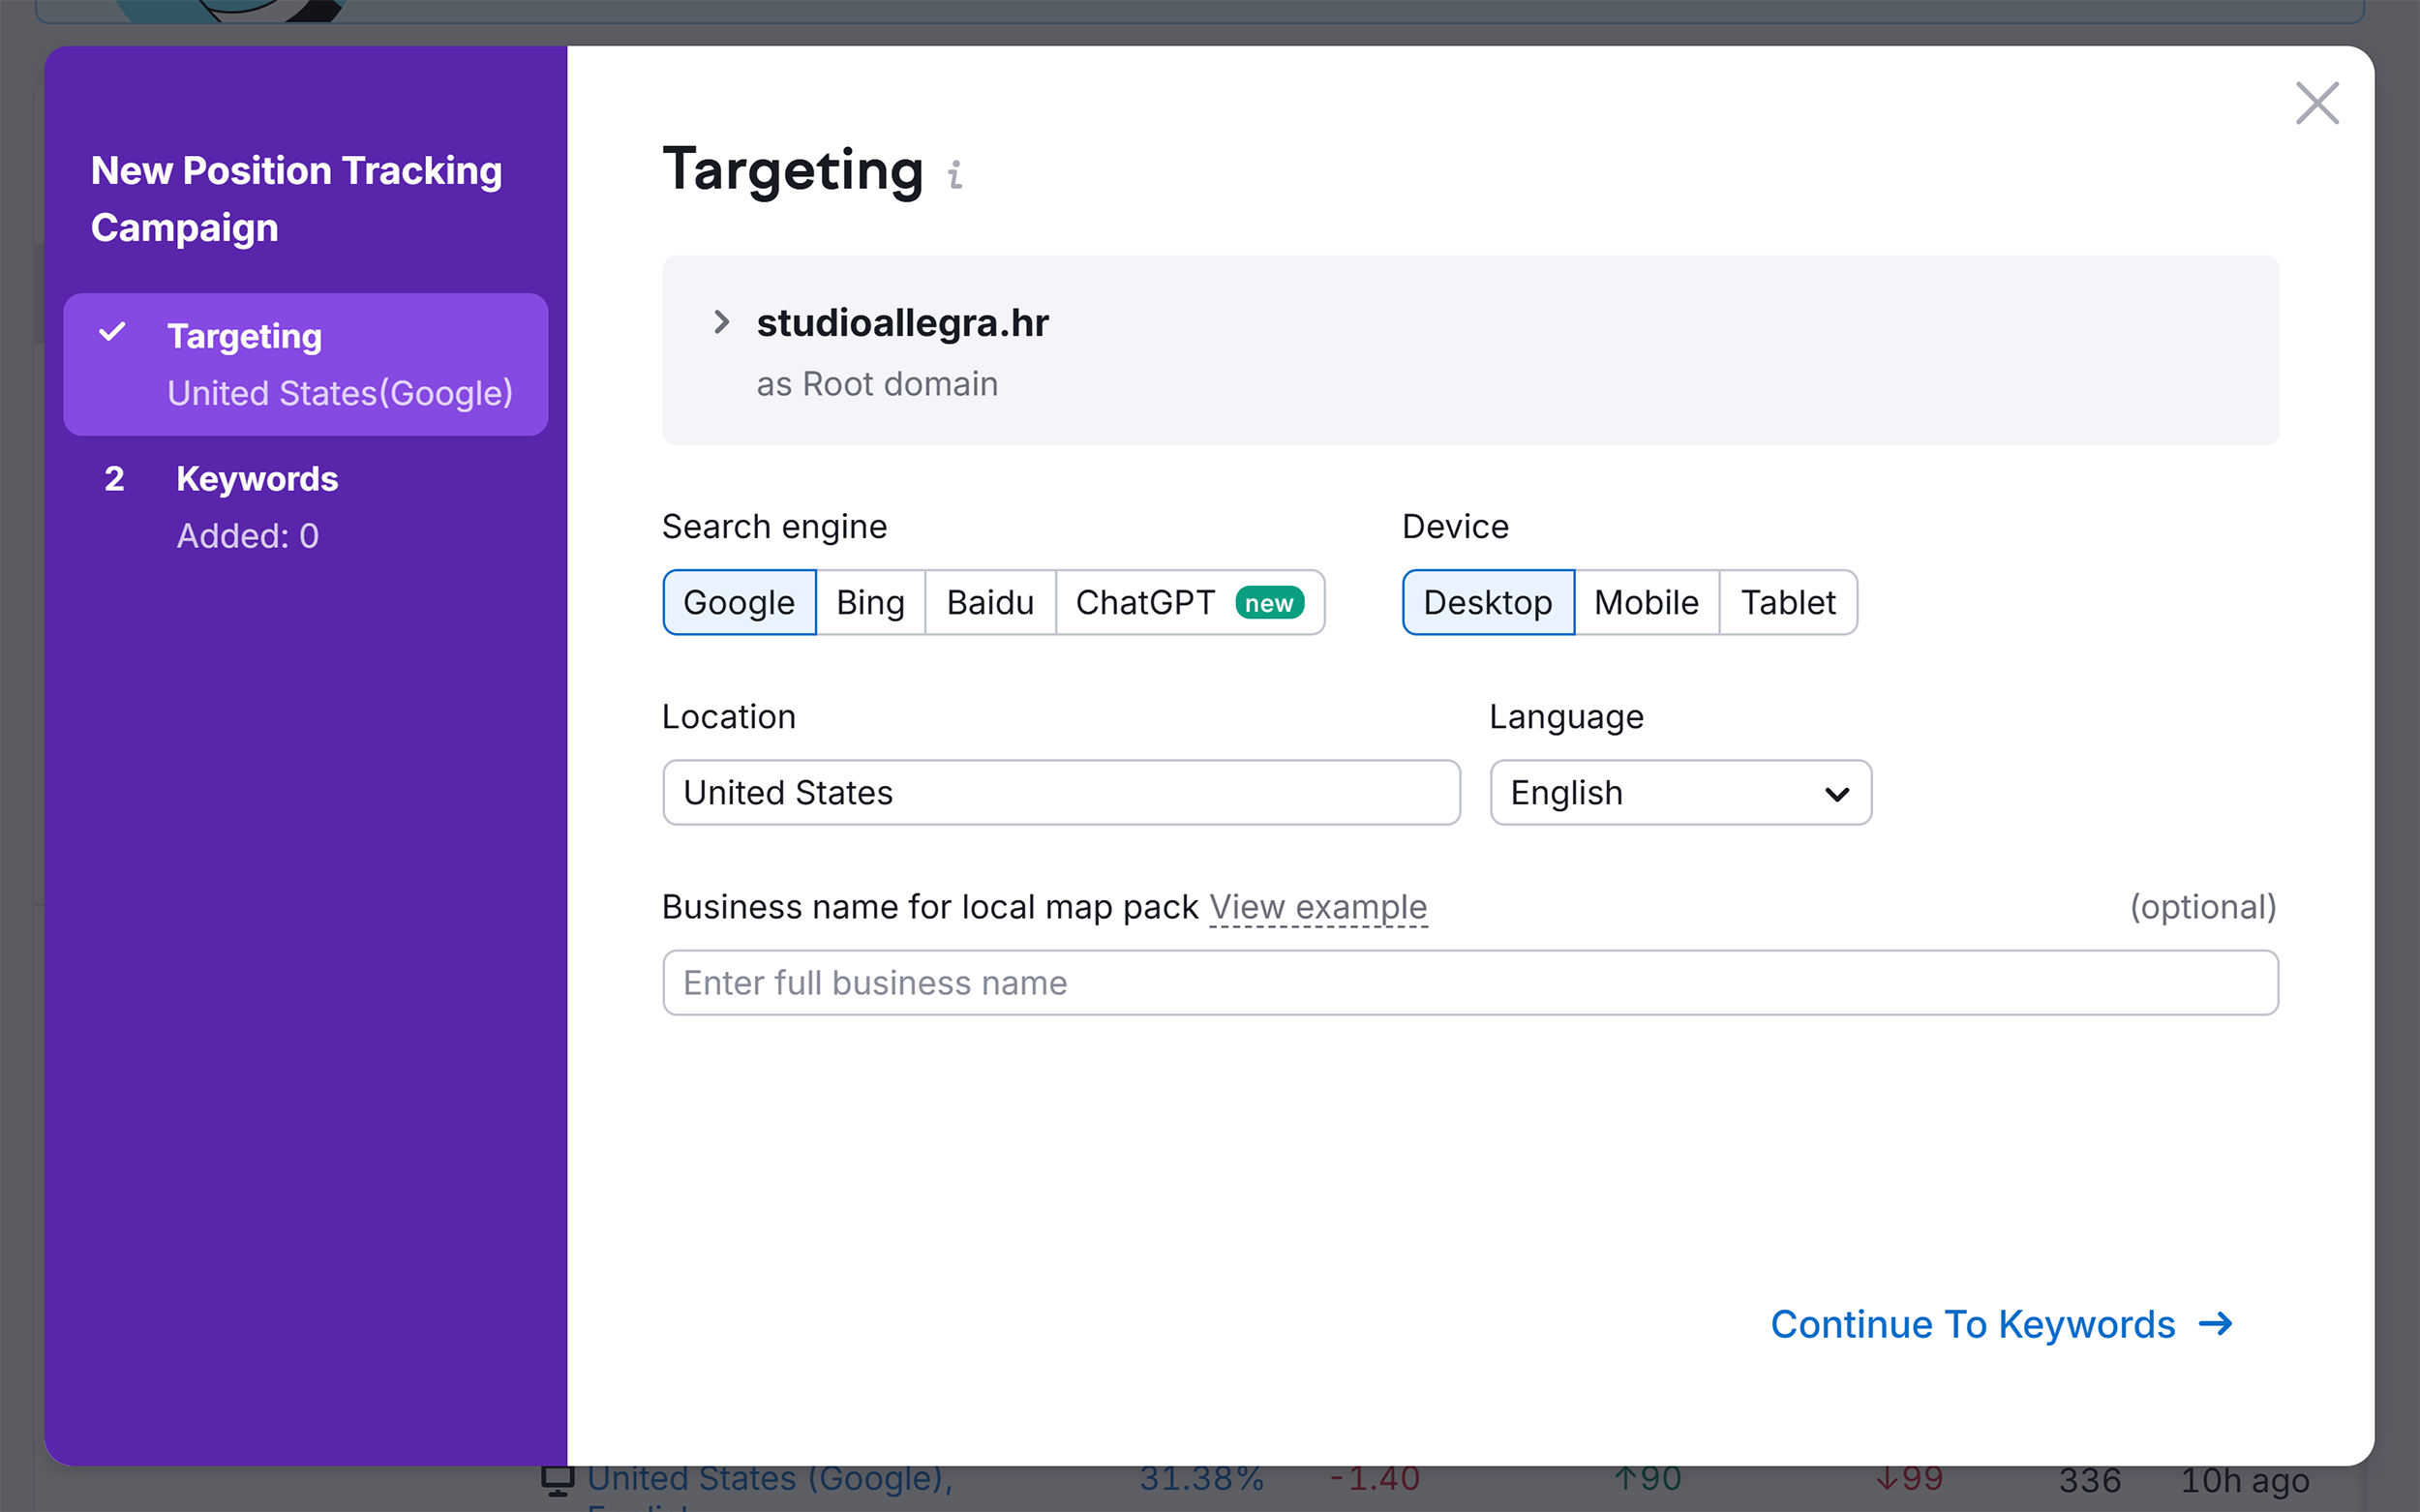
- Competitor Gap: Use tools like Semrush’s Keyword Gap to identify "Missing" keywords—terms your competitors rank for, but you do not.
- AI Prompts: Browse Reddit and niche communities to see how your audience phrases their pain points. Translate these into conversational prompts for LLM testing.
Step 3: Calculate Your SoV
Once your libraries are set, the math is straightforward:
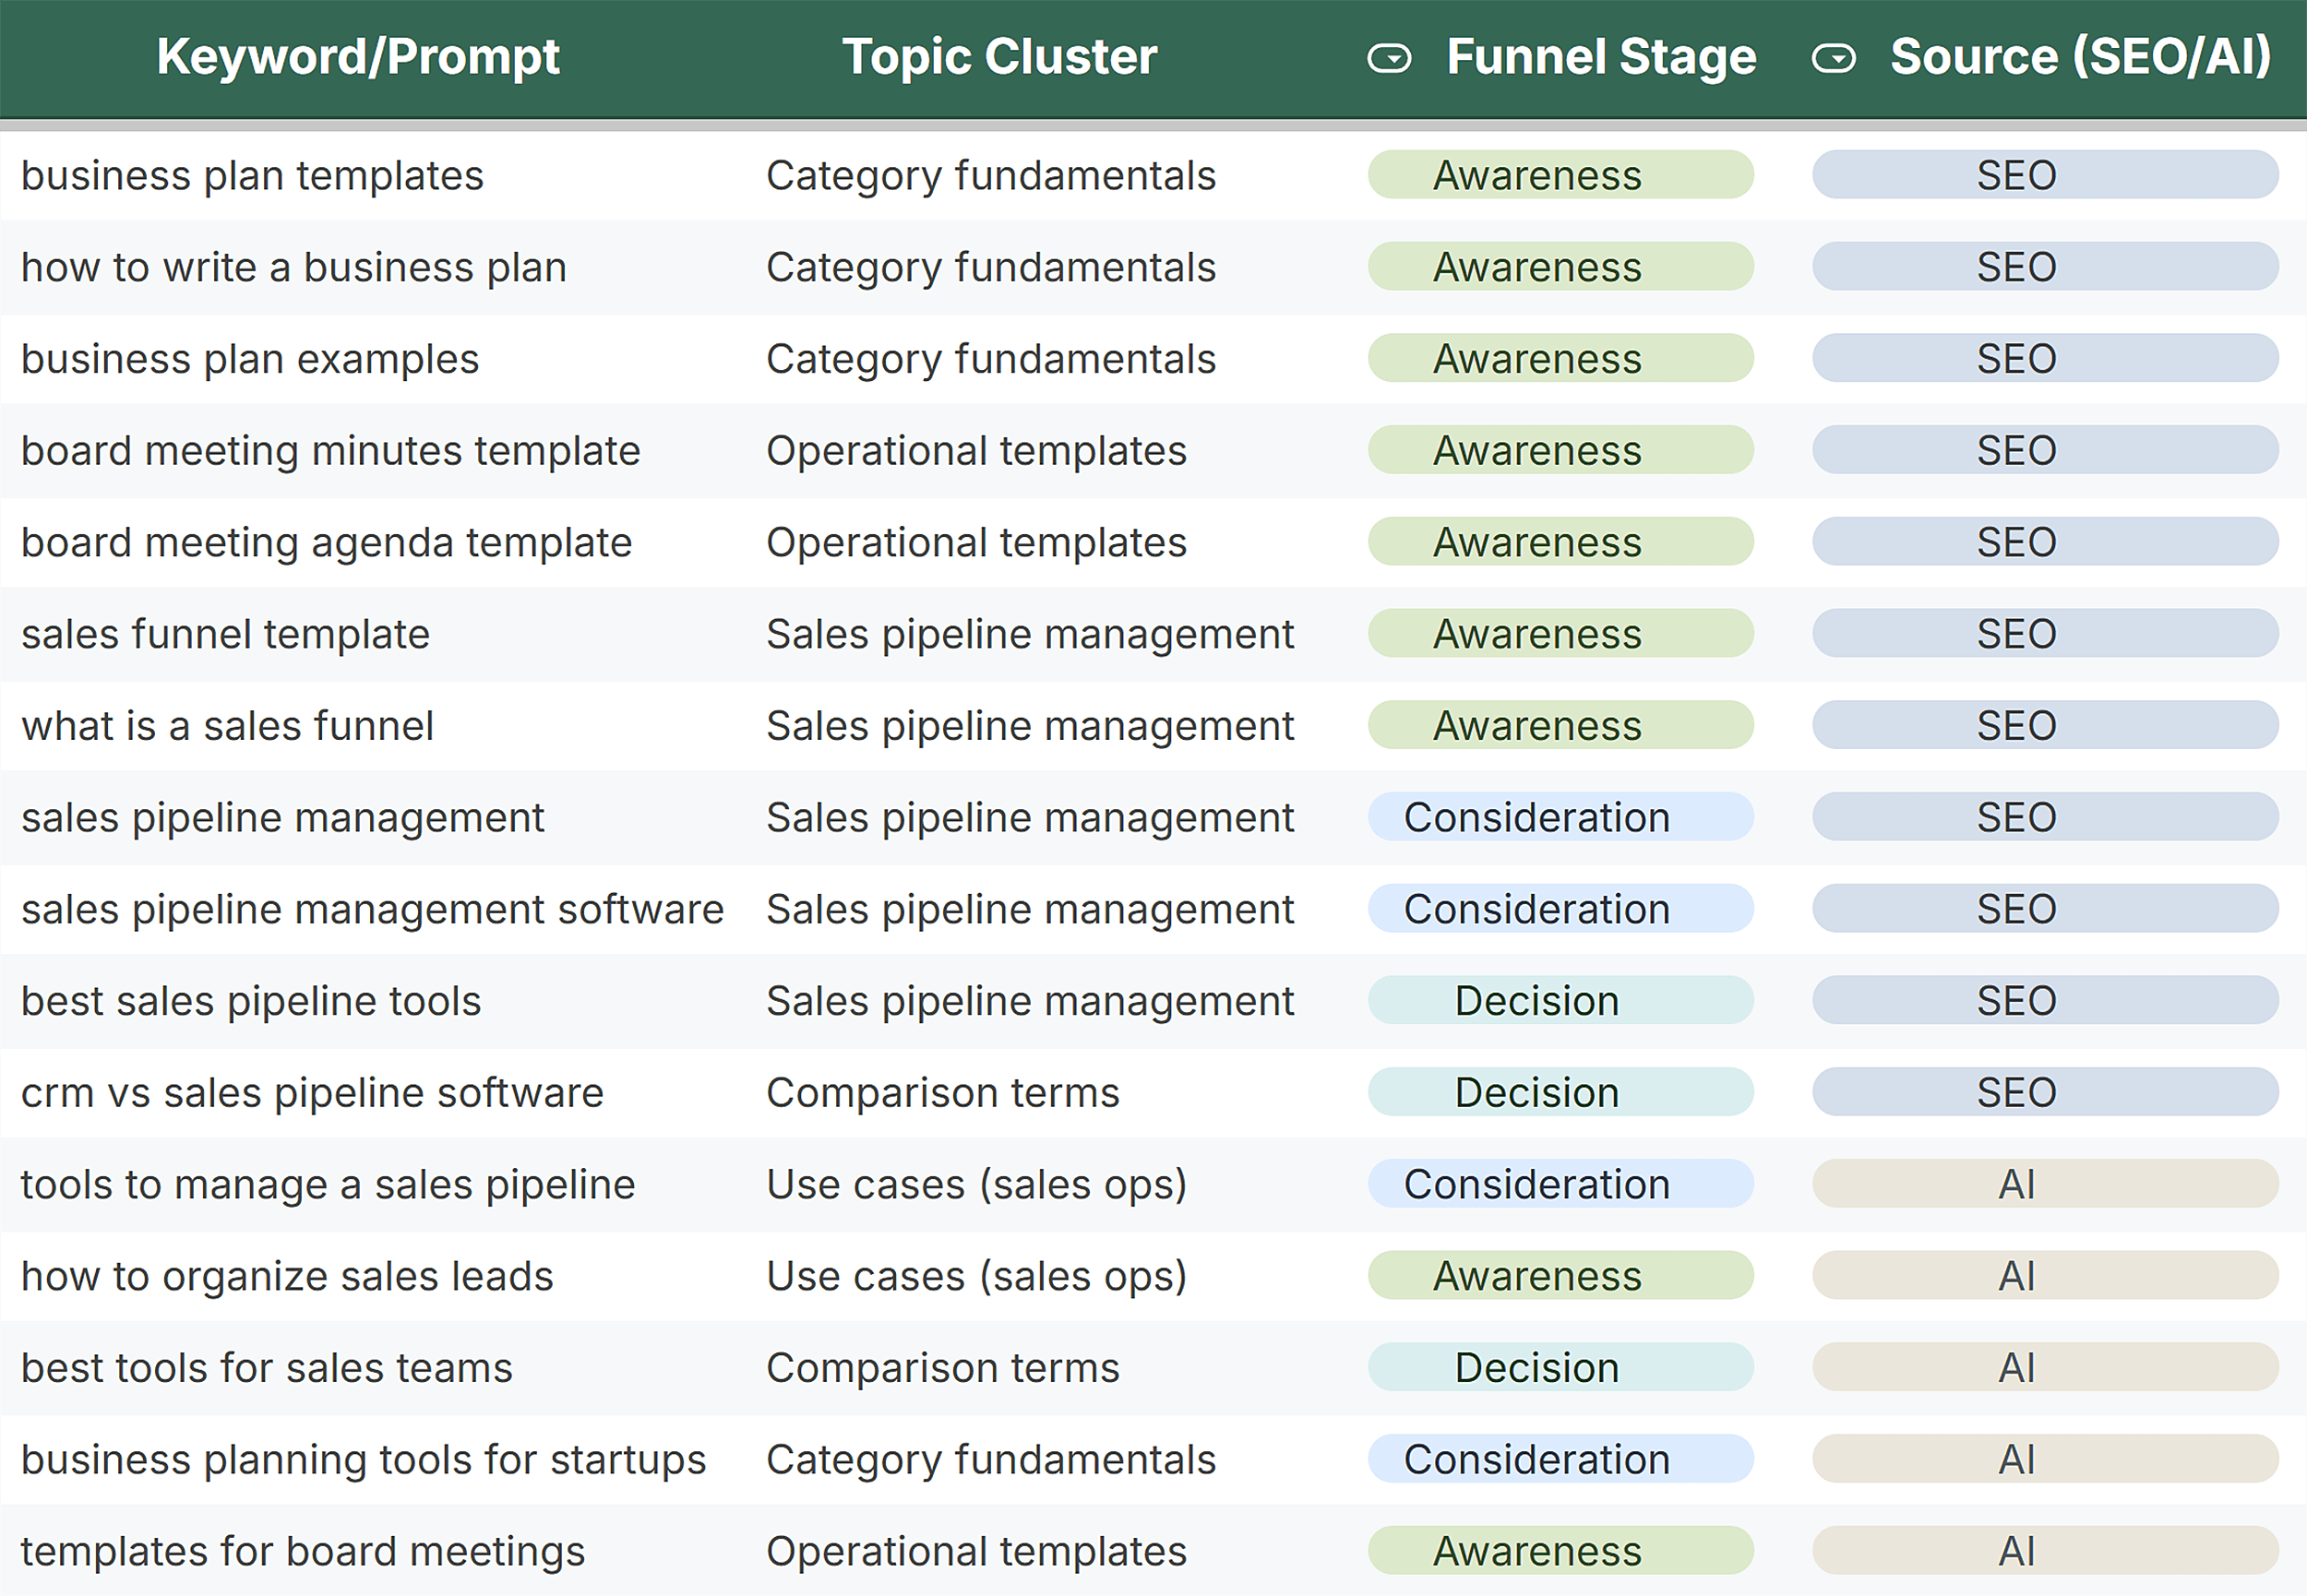
- SEO Calculation: Estimate traffic by multiplying search volume by the CTR associated with your ranking position. Divide your total estimated traffic by the total market traffic.
- AI Calculation: Test your prompts across multiple LLMs. Count your brand’s appearances and divide by the total number of prompts tested.
Step 4: Establish Your Baseline and Track Trends
Set a monthly cadence for tracking. Use a dashboard to visualize your data by:
- Category: Are you winning in "agile project management" but losing in "task automation"?
- Funnel Stage: Are you visible when it matters most—during the purchase decision?
- Competitor Comparison: Is a specific rival gaining ground in your core clusters?
Strategic Implications and Future Moves
Once you have your data, you can diagnose where to improve:
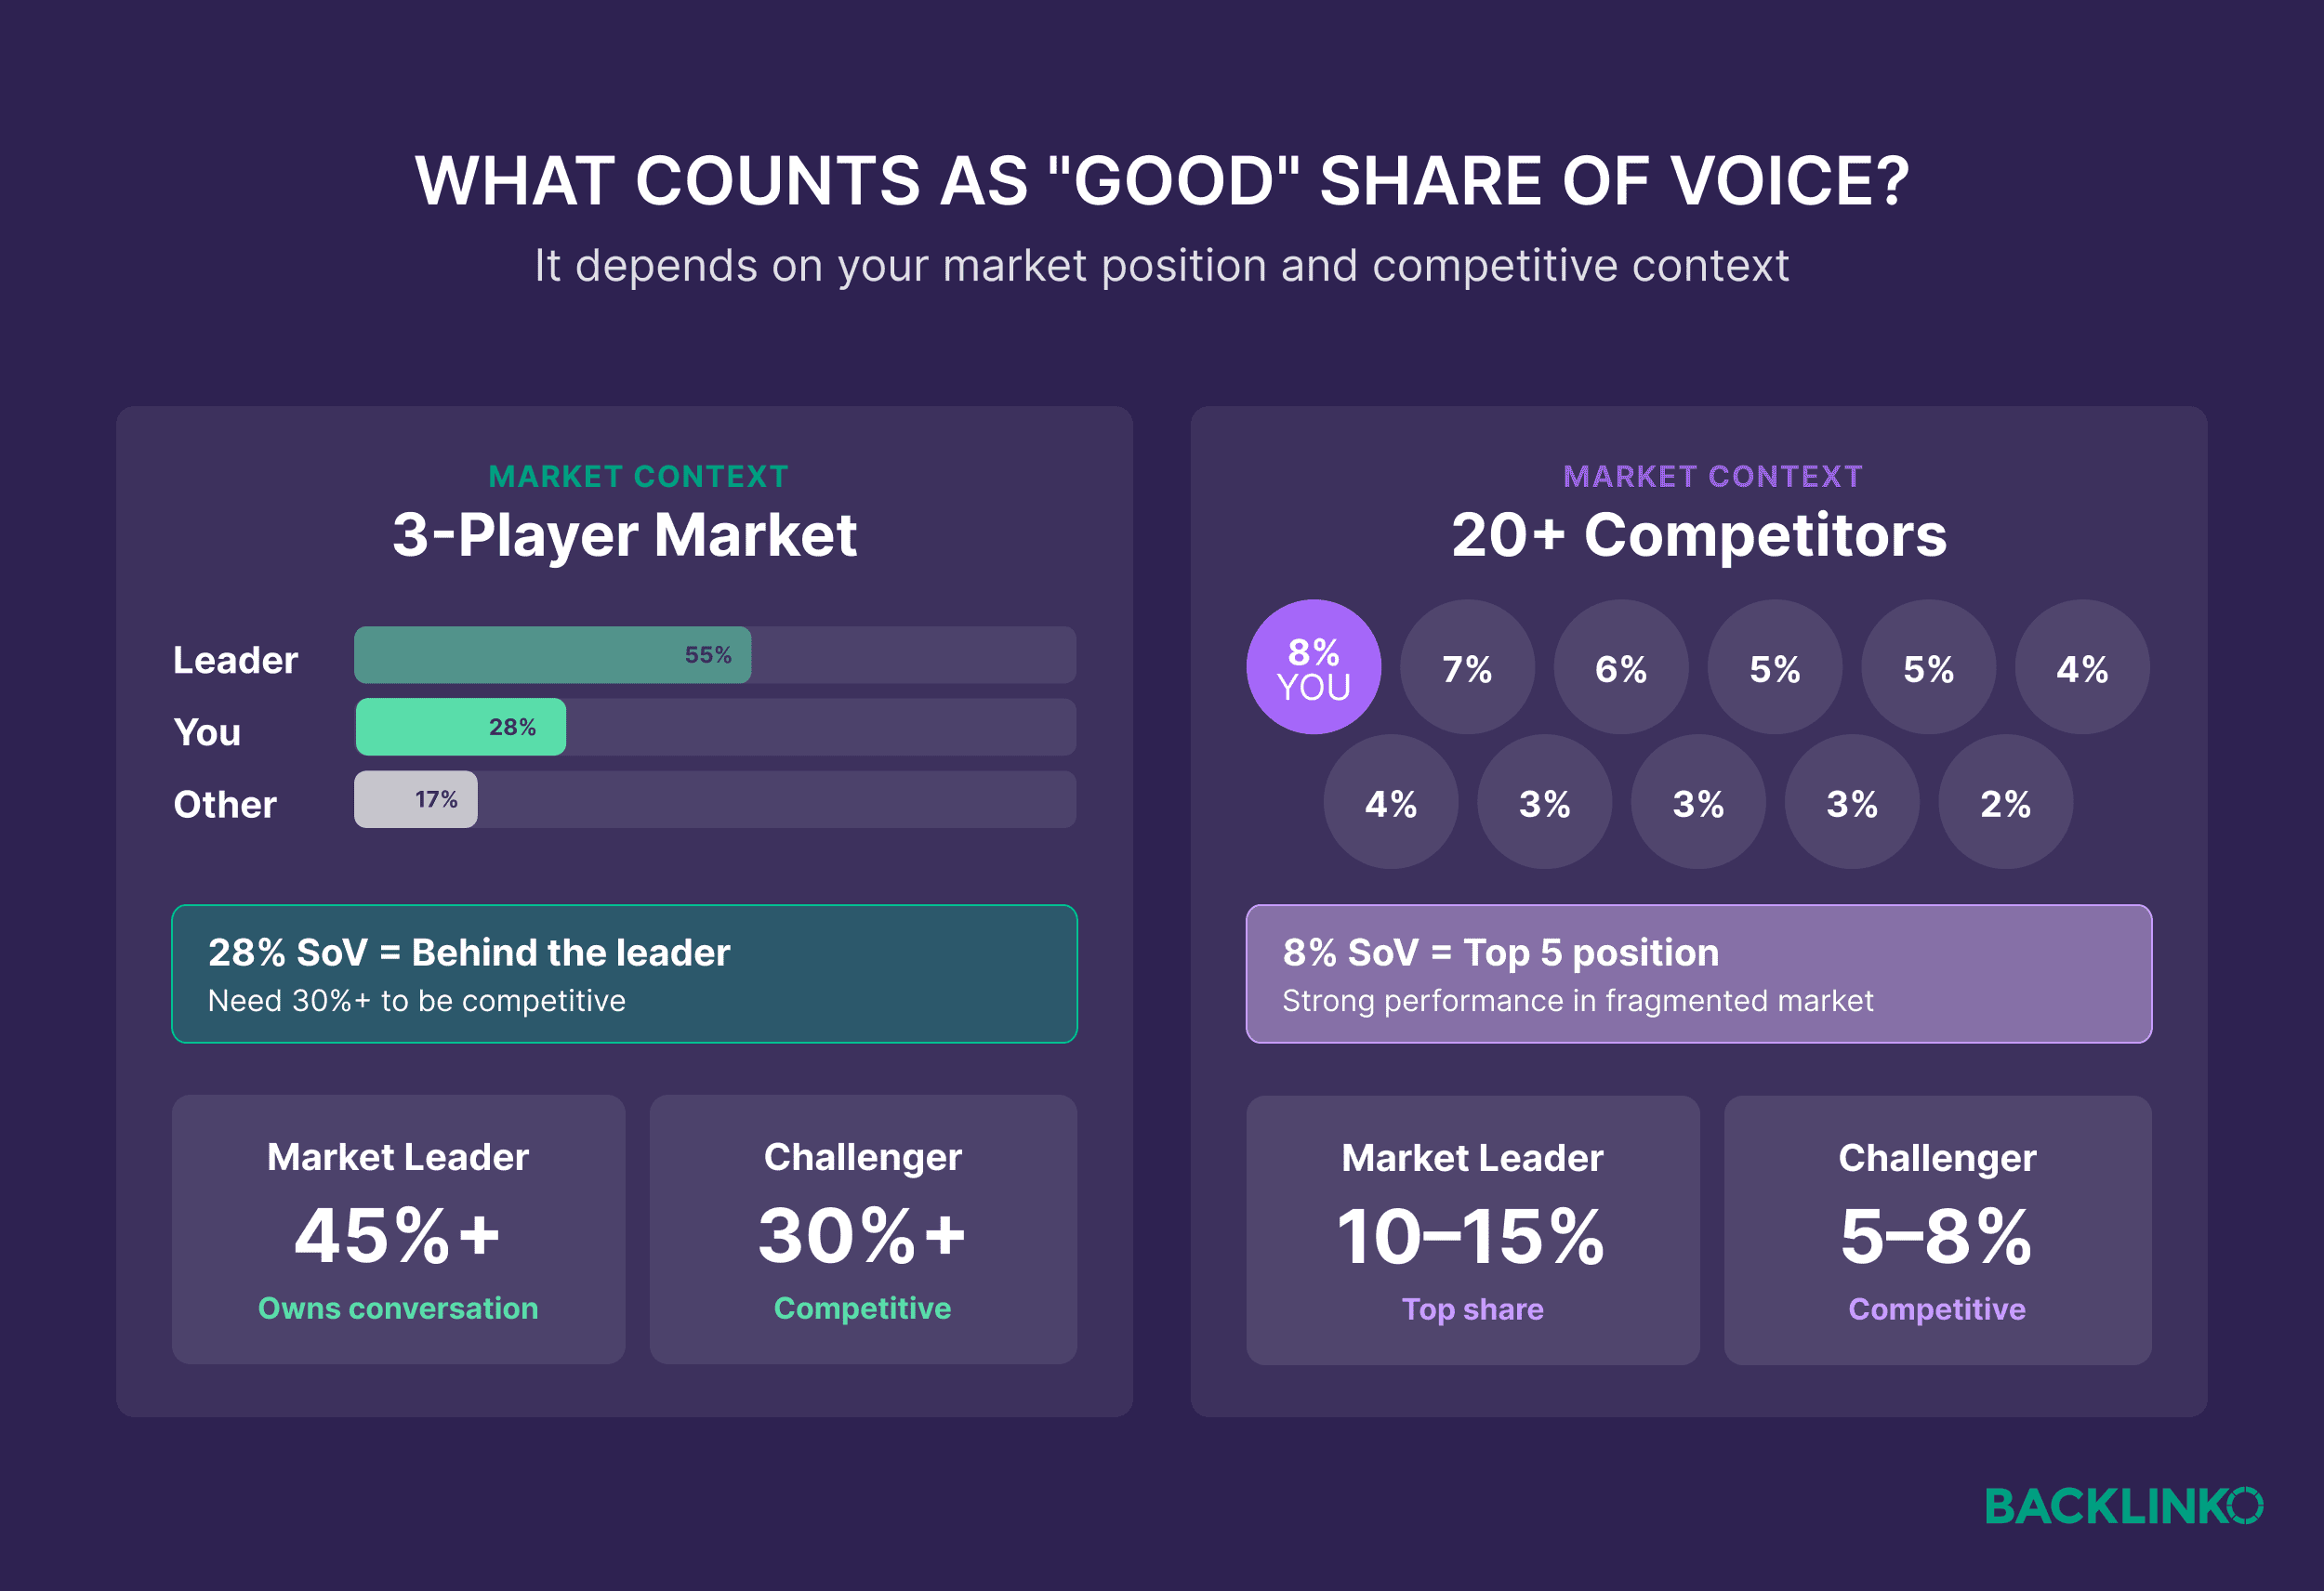
- Close Visibility Gaps: If your SoV is below 10% in a key cluster, you are effectively invisible. Build "pillar" content—comprehensive guides—to establish authority.
- Solve Efficiency Problems: A high SoV in a low-conversion cluster is a waste of budget. Reallocate resources to high-intent comparison pages and case studies.
- Address Competitive Threats: If a competitor gains 5% SoV in your "stronghold" clusters, it is a warning sign. Increase your presence on review sites and engage in the communities where they are winning.
Summary: The Path Forward
In the era of AI and fragmented search, visibility is the new currency. By measuring Share of Voice, you move away from the noise of individual clicks and toward a holistic understanding of your market influence. Start by setting your baseline today; once you see the full picture, you can begin to systematically own the conversation in your category.
Note: This content is intended for educational purposes regarding digital marketing strategy and reflects current industry practices as of 2026.