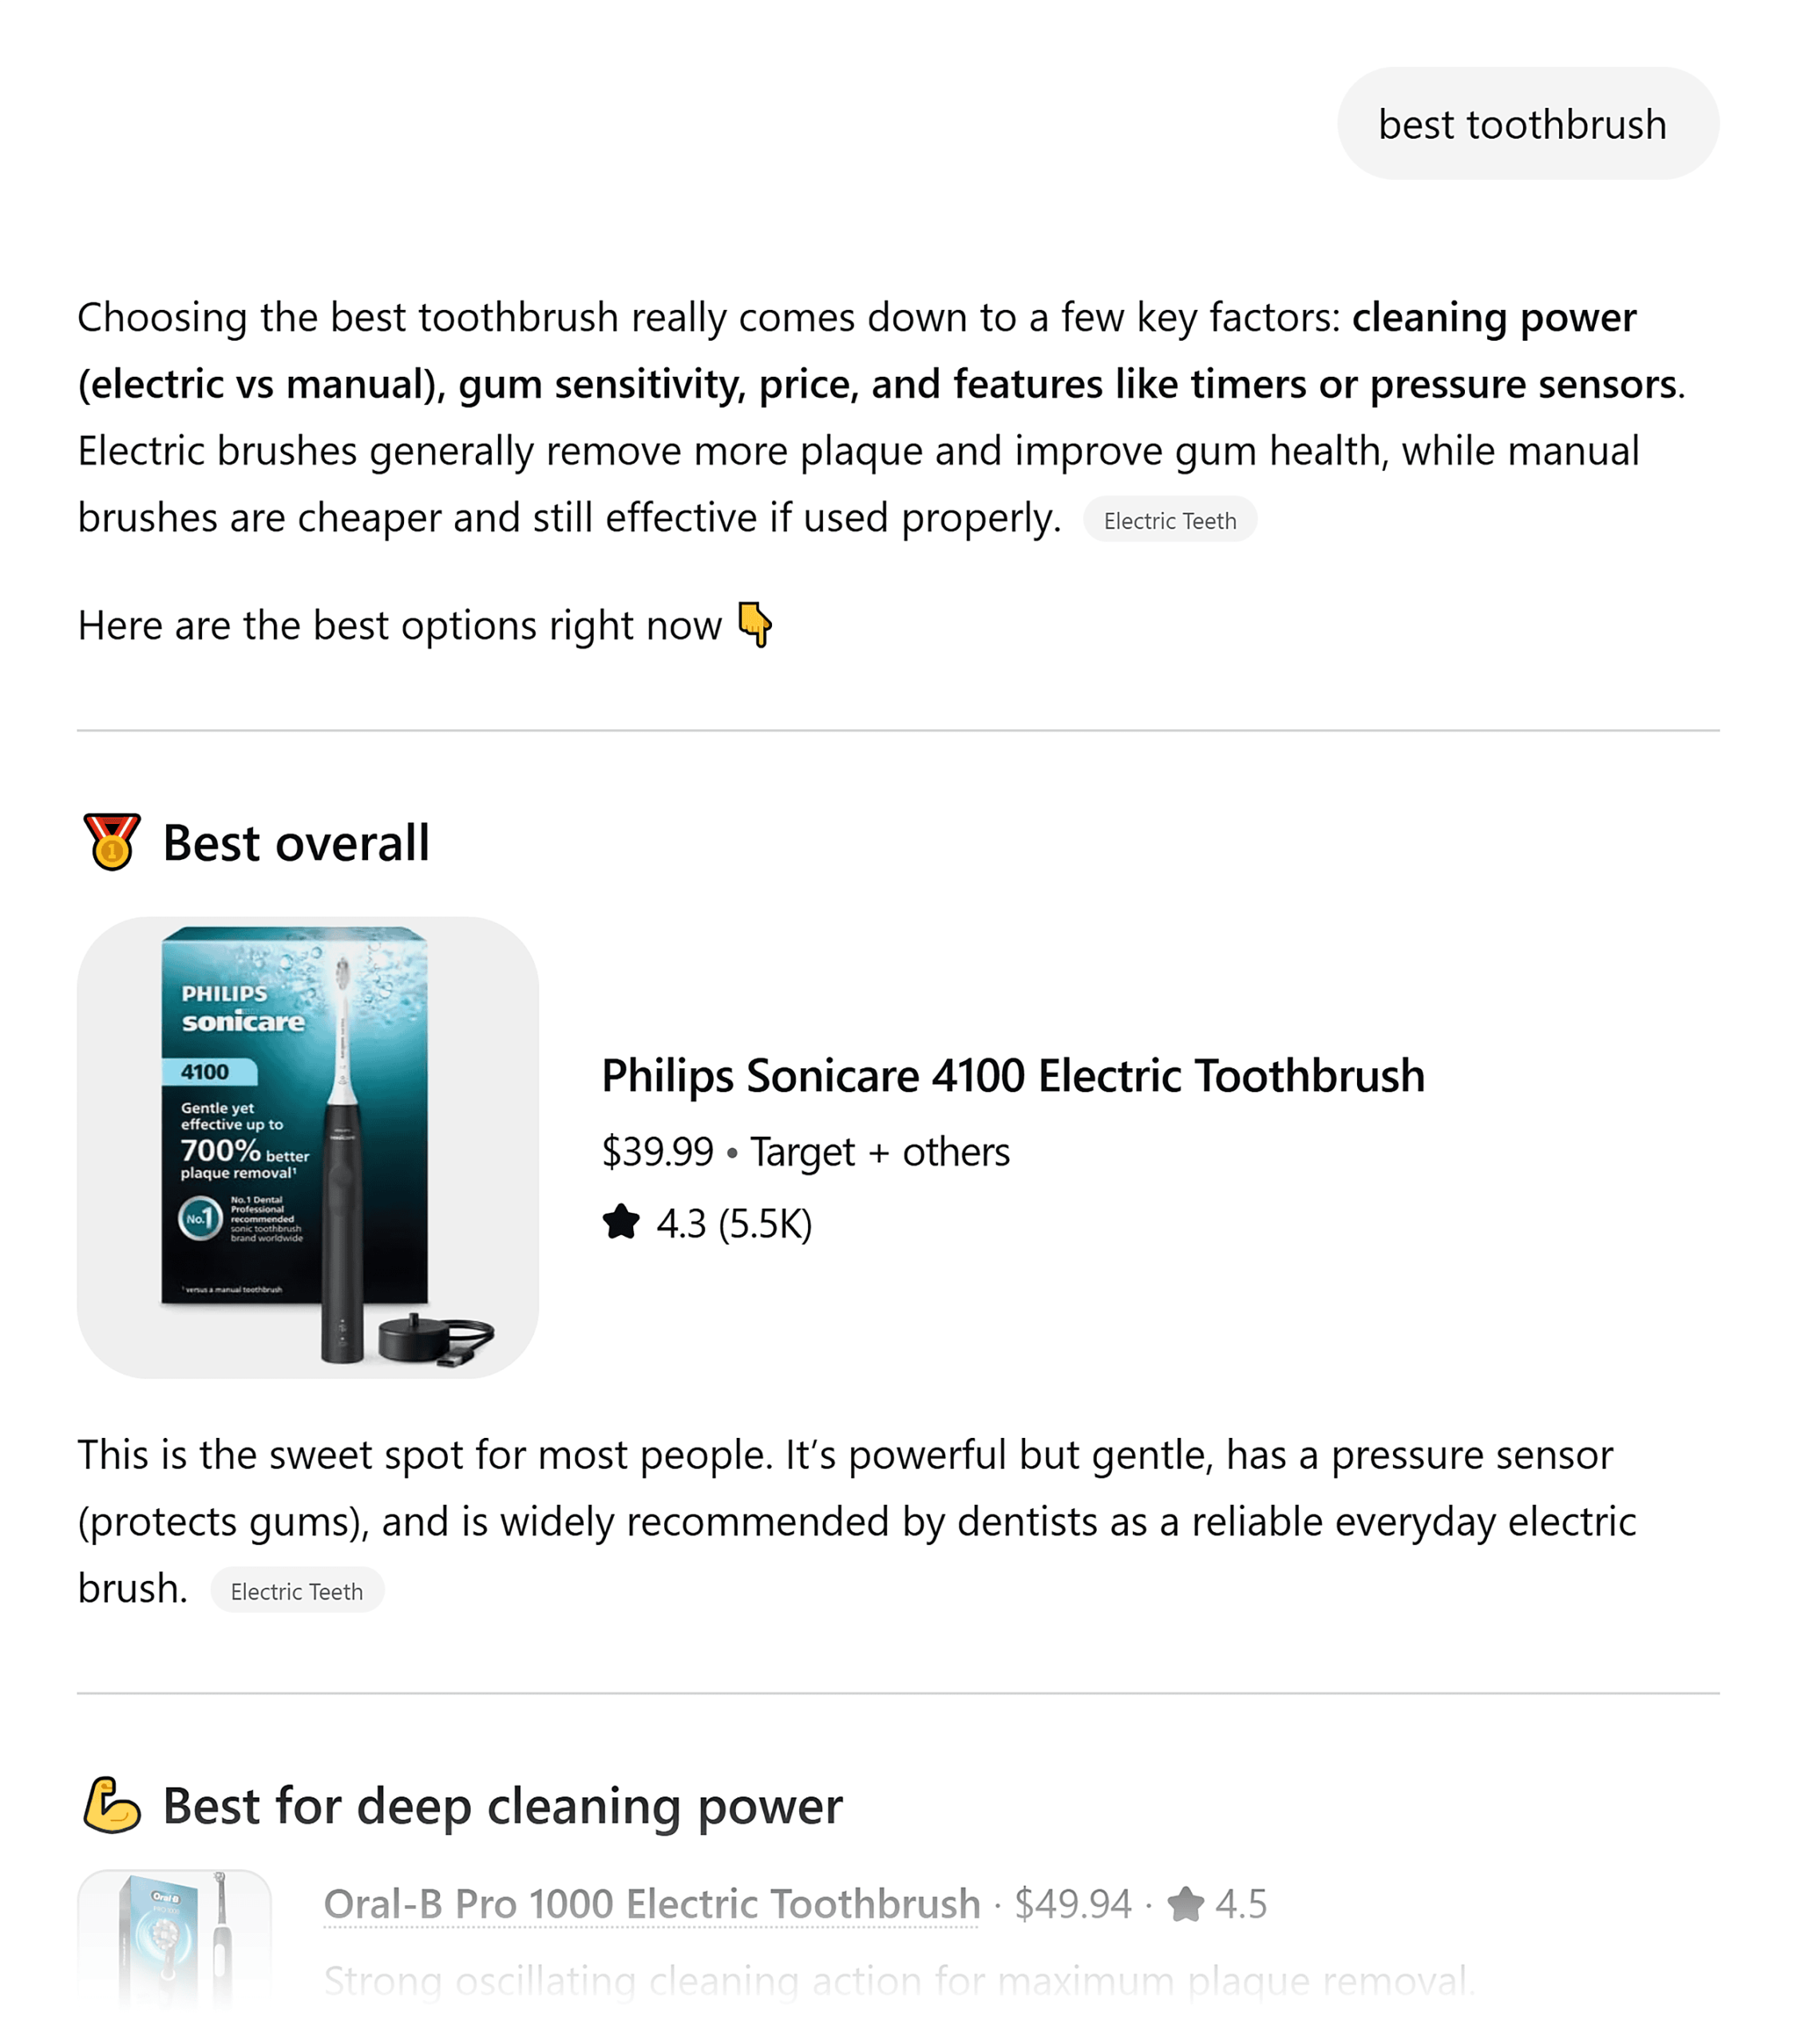

In the traditional digital marketing playbook, success was defined by the click. Analytics dashboards, meticulously configured with Google Analytics or Adobe, tracked sessions, bounce rates, and conversion paths with religious fervor. However, as the digital landscape shifts toward decentralized discovery, these traffic-based metrics are increasingly failing to tell the full story.

Today, a buyer might read an AI-generated summary that highlights your competitor, or they might browse a Reddit thread where your brand is conspicuously absent. This represents a significant loss in visibility—a "dark" loss that never triggers a signal in your traffic data. As we move further into 2026, relying solely on traditional web analytics is akin to driving while looking only at the rearview mirror.
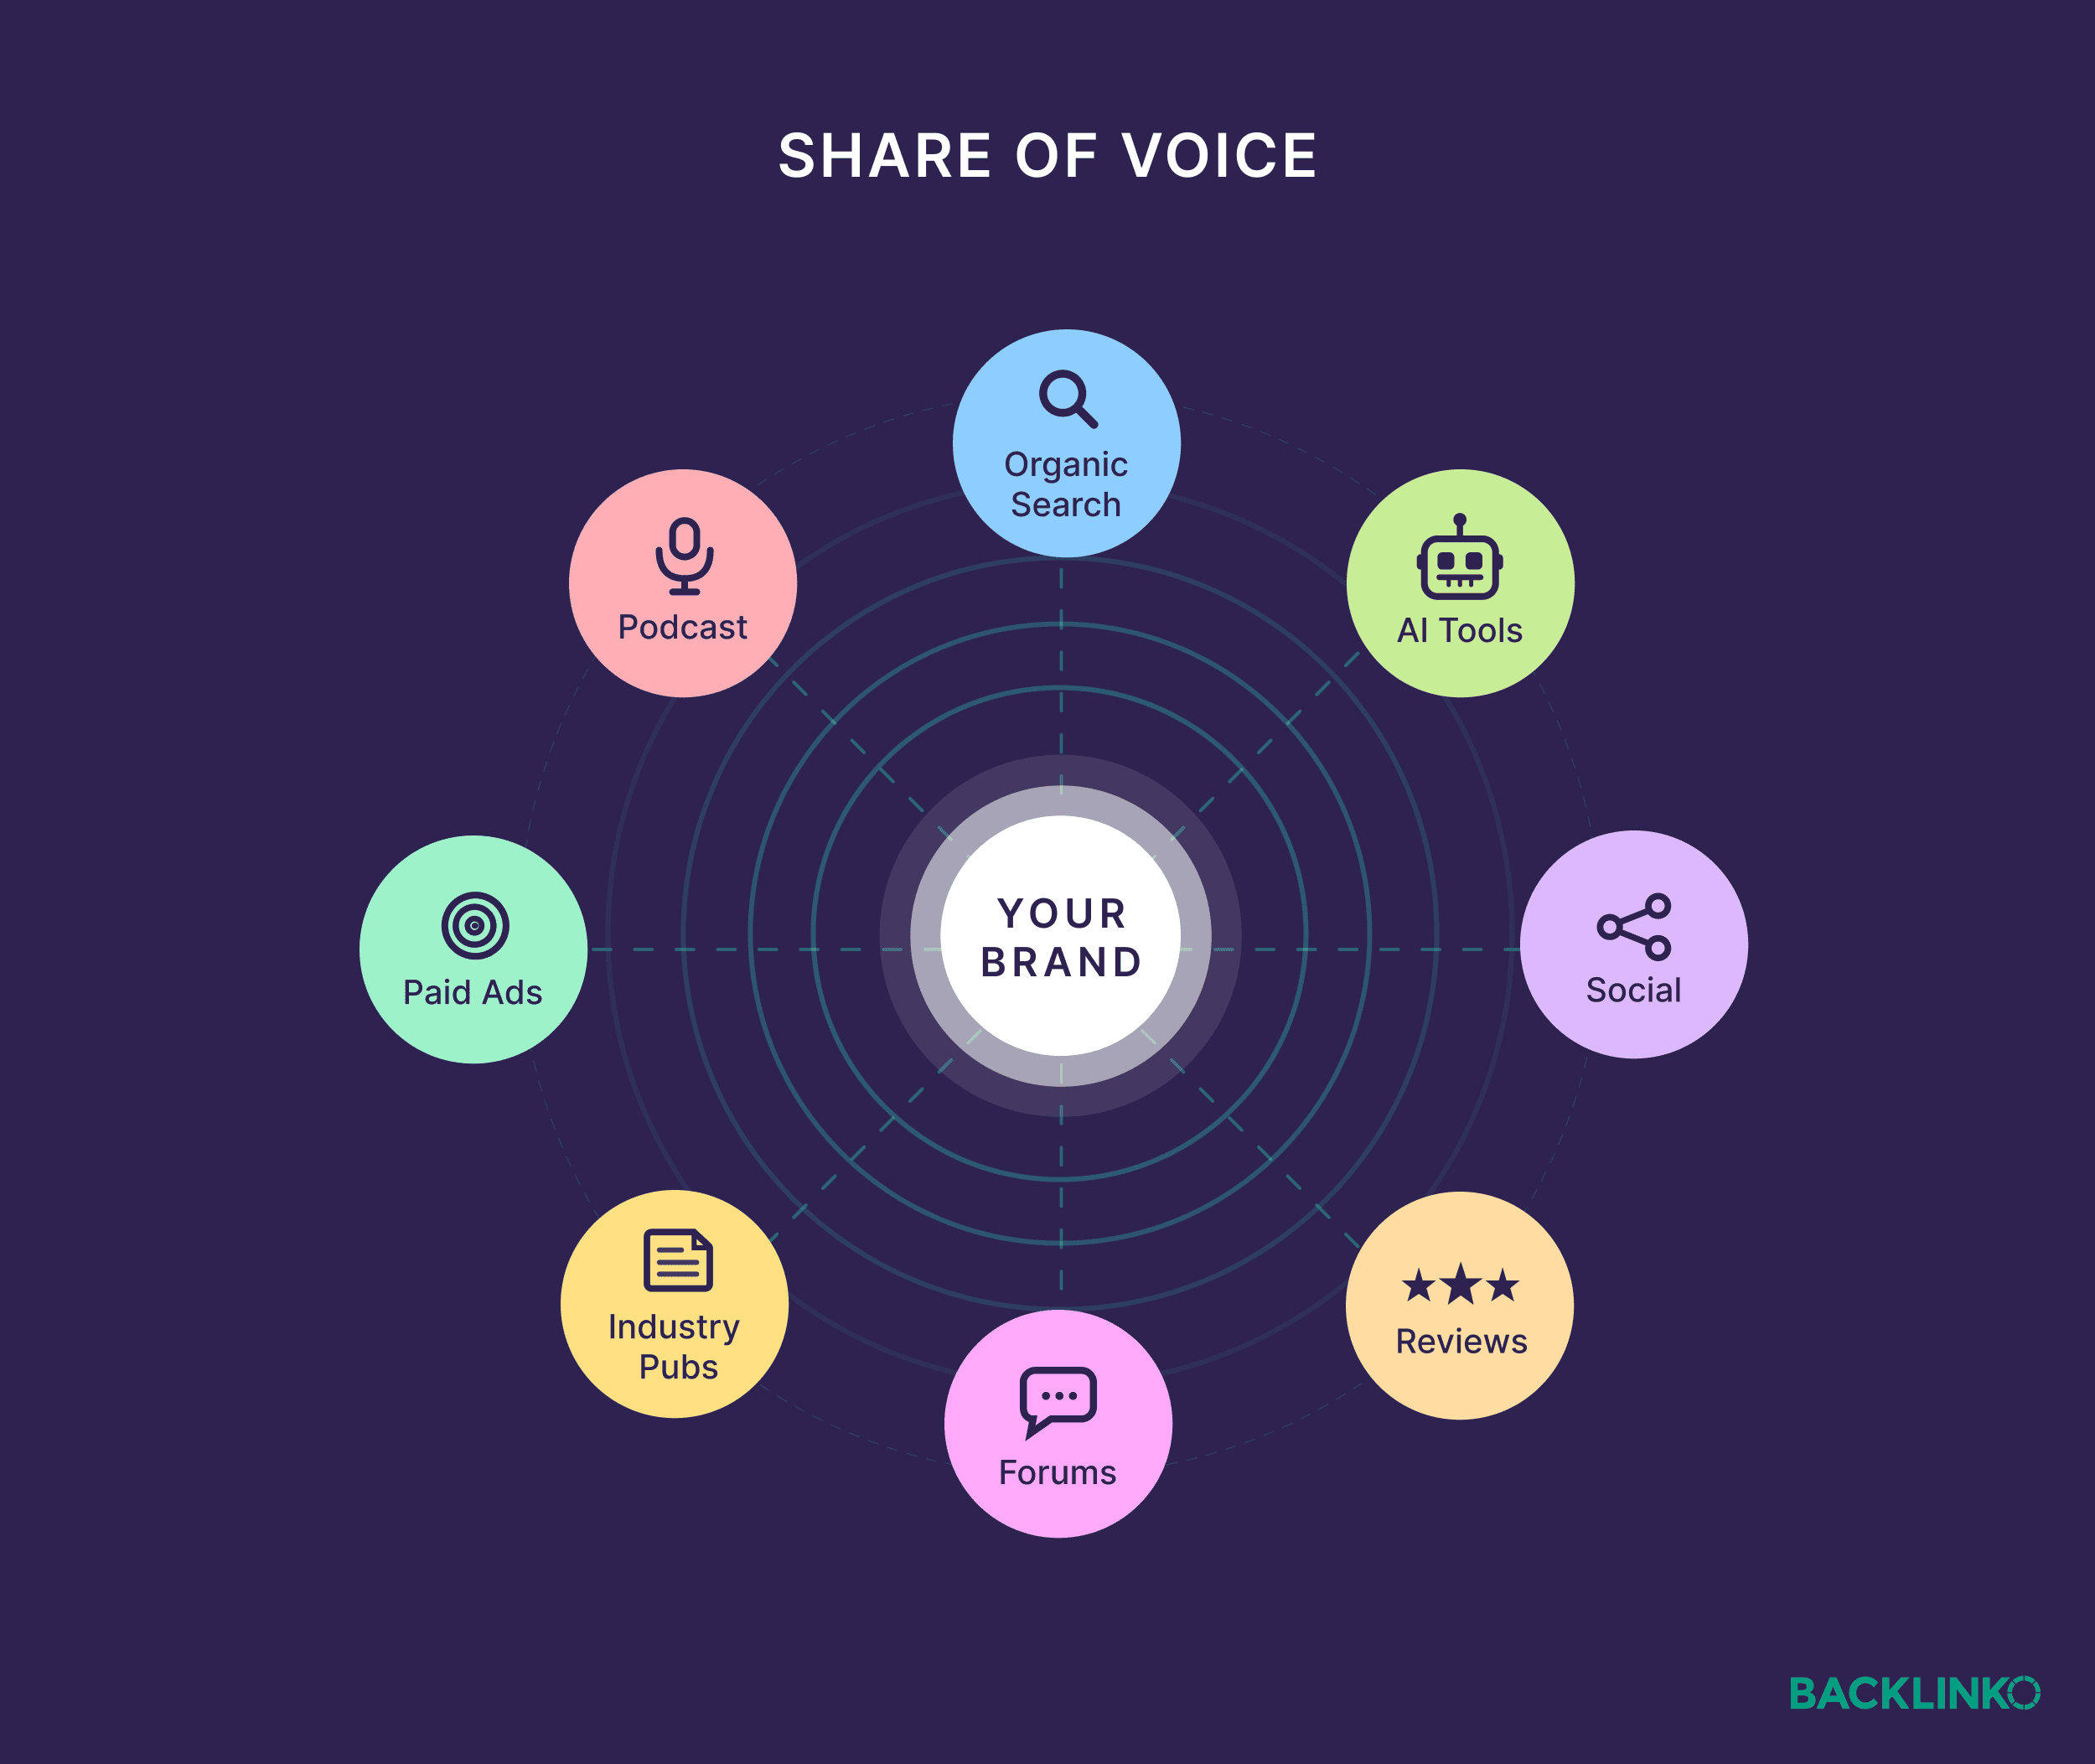
To truly understand your market position, you must shift your focus to Share of Voice (SoV). This metric captures what traffic metrics cannot: your brand’s actual visibility relative to competitors across the specific channels where buyers research and make high-stakes decisions.
What is Share of Voice?
At its core, Share of Voice measures your brand’s prominence relative to competitors across multiple marketing channels. While traditionally used to track ad spend in the broadcast era, SoV has evolved into a sophisticated tool for measuring brand presence across every touchpoint of the modern buyer’s journey.

In simple terms, SoV answers a singular, vital question: What percentage of the conversation in your category do you actually own?
While SoV can span social, PR, and paid media, the most critical starting point today is Search. Buyer discovery is shifting rapidly toward search-driven environments—both traditional organic search and the emerging landscape of AI search (LLMs). Because these channels capture users with the strongest purchase intent, they are the most essential areas to measure. Once you have a handle on your search-based SoV, layering in other channels becomes a logical, data-driven expansion.
What Counts as a "Good" Share of Voice?
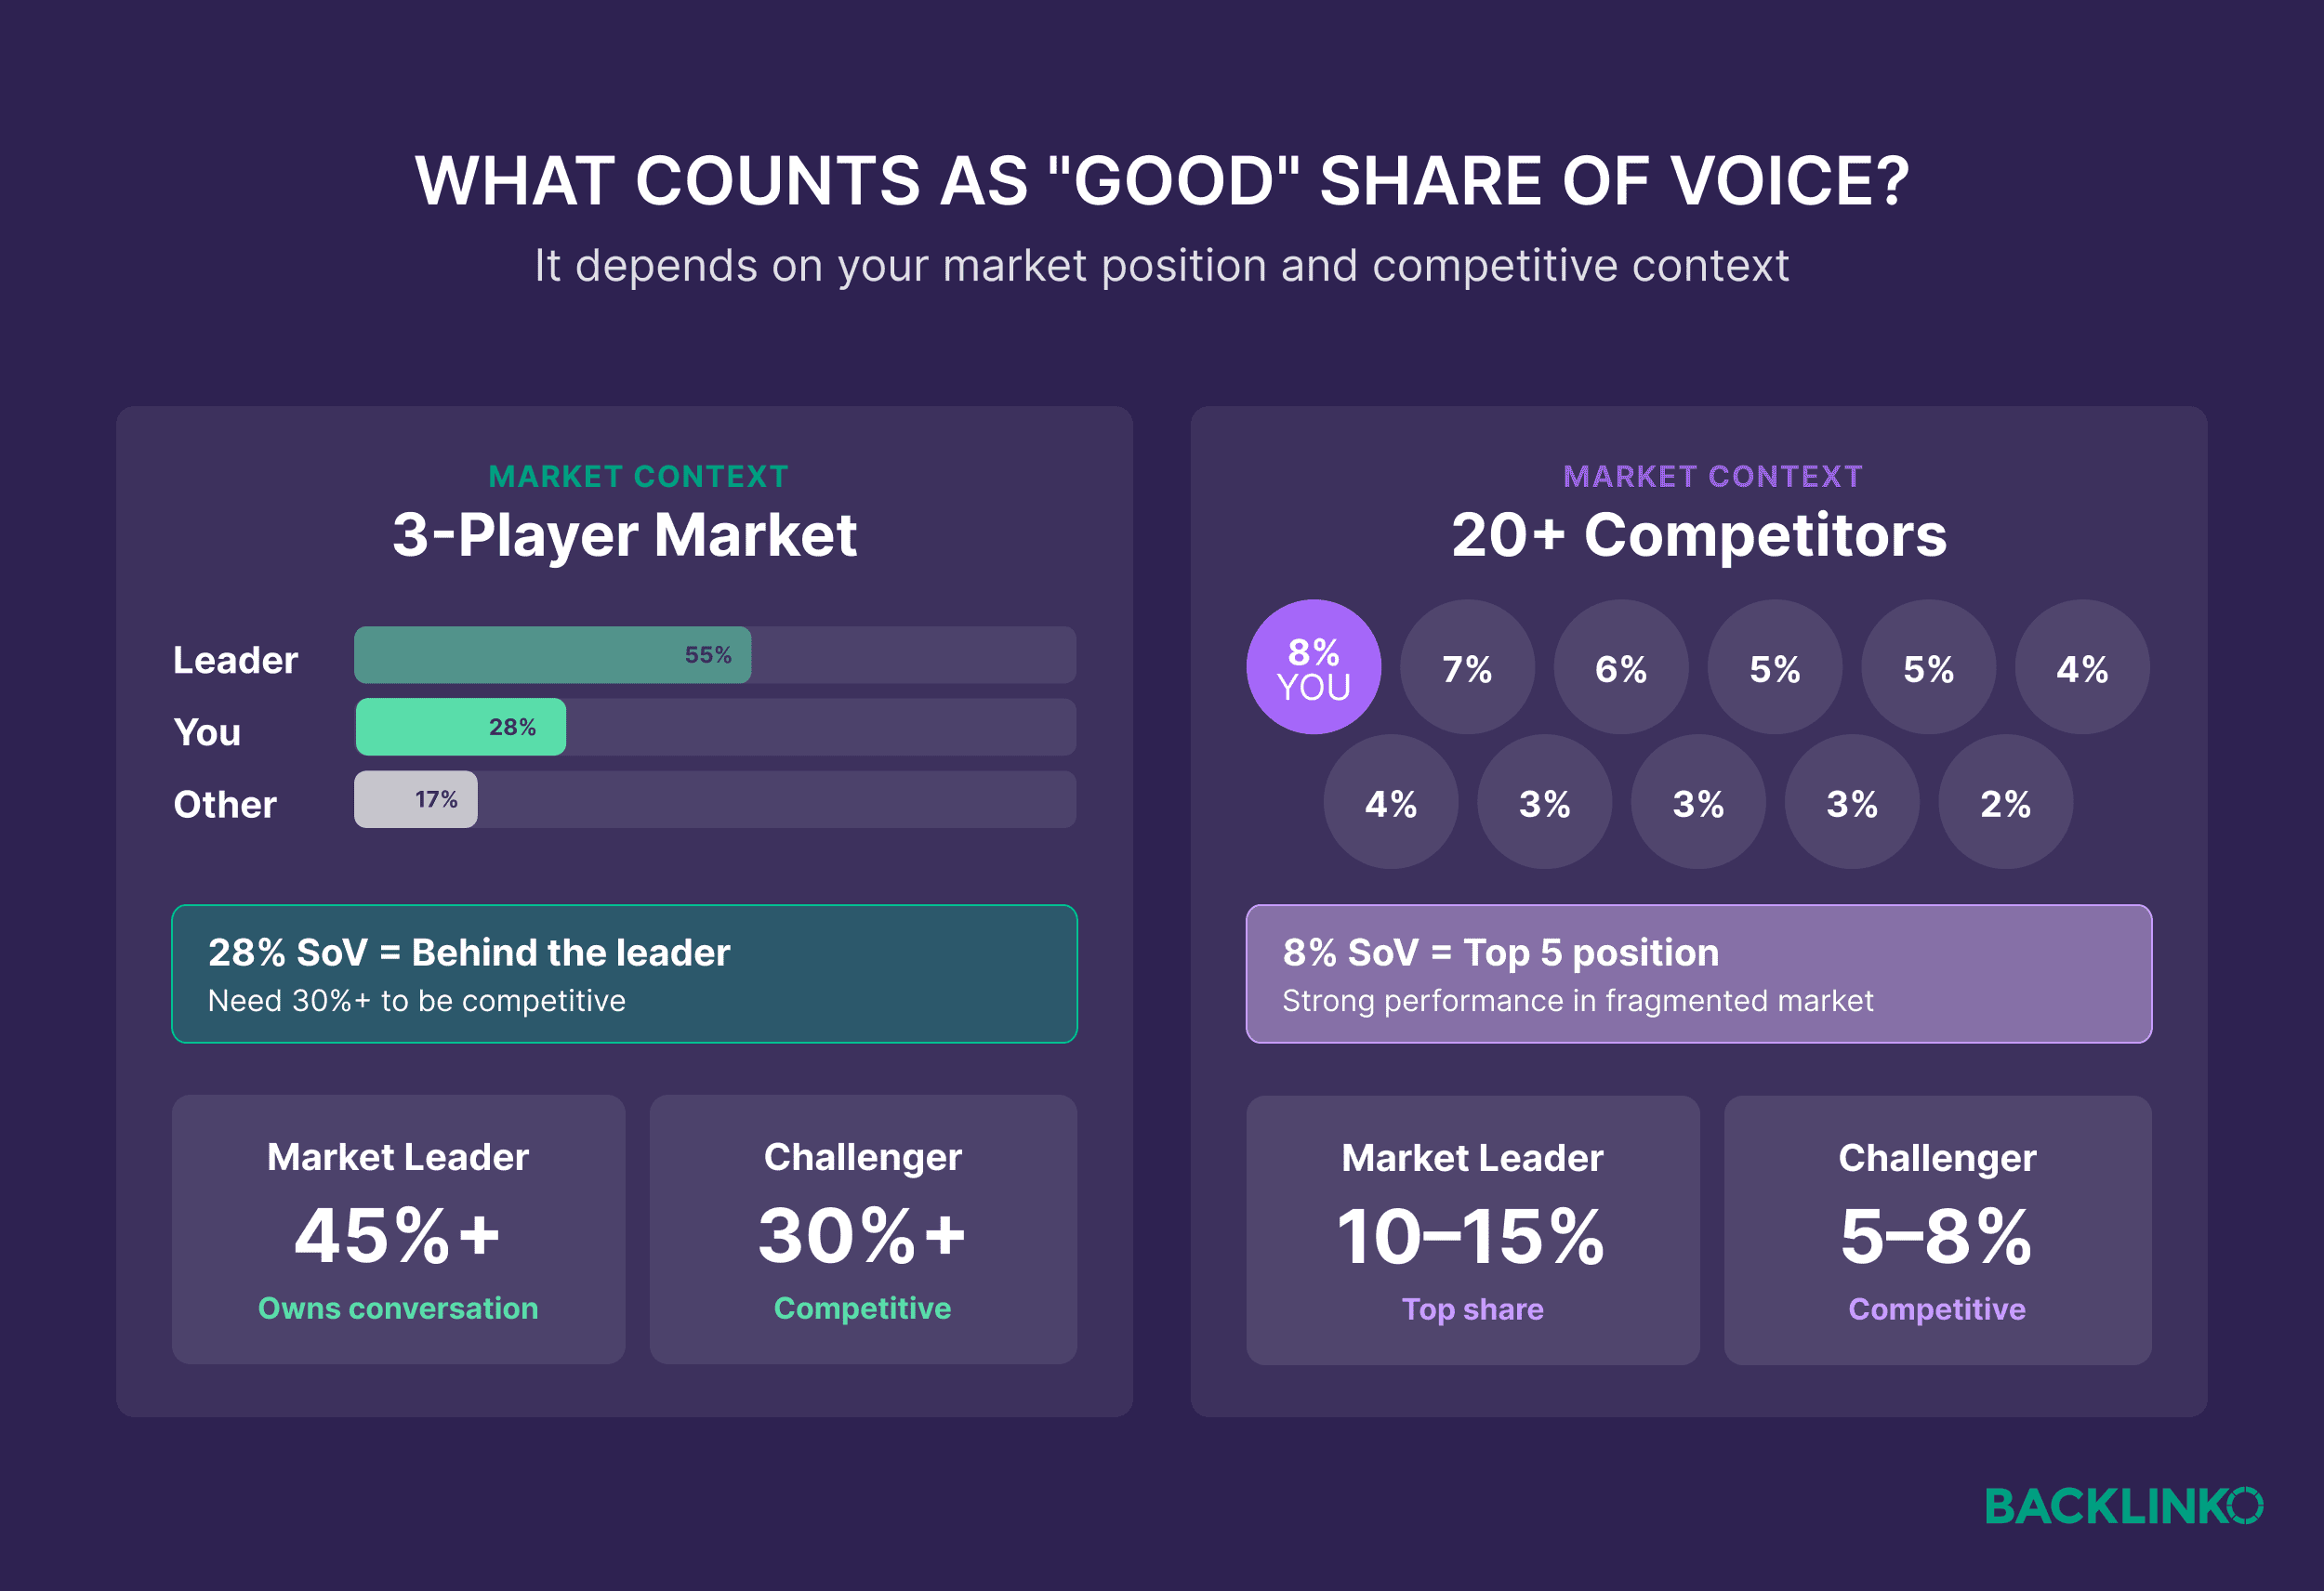
There is no universal benchmark for a "good" SoV; it is highly dependent on your industry and competitive density. Establishing a baseline requires looking at two factors:

- Competitive Saturation: If you are in a niche market with two competitors, a 30% SoV is quite low. In a crowded enterprise software market, 10% might be a market-leading position.
- Category Growth: High SoV in a shrinking market is a vanity metric. The real victory lies in growing your share even as the total category demand expands.
Traditional SEO vs. AI Search: Two Different Games
While both SEO and AI SoV aim to quantify category demand ownership, they operate in distinct contexts.

- SEO SoV (The Traffic Slice): This calculates your percentage of traditional organic search traffic. For example, if you track 100 target keywords that generate 50,000 monthly visits collectively, and your site captures 15,000 of those, you hold a 30% organic share of voice.
- AI SoV (The Consideration Set): This measures brand mentions and citations within LLM responses (ChatGPT, Perplexity, Google AI Mode). If you test 100 category-related prompts and your brand appears in 45 responses while a competitor appears in 30, your AI SoV reflects your ability to be "top-of-mind" for the machine, not just the human.
Why Share of Voice is the Ultimate KPI
As visibility becomes increasingly scattered across platforms, SoV provides three essential advantages:
1. Visibility Beyond the Click
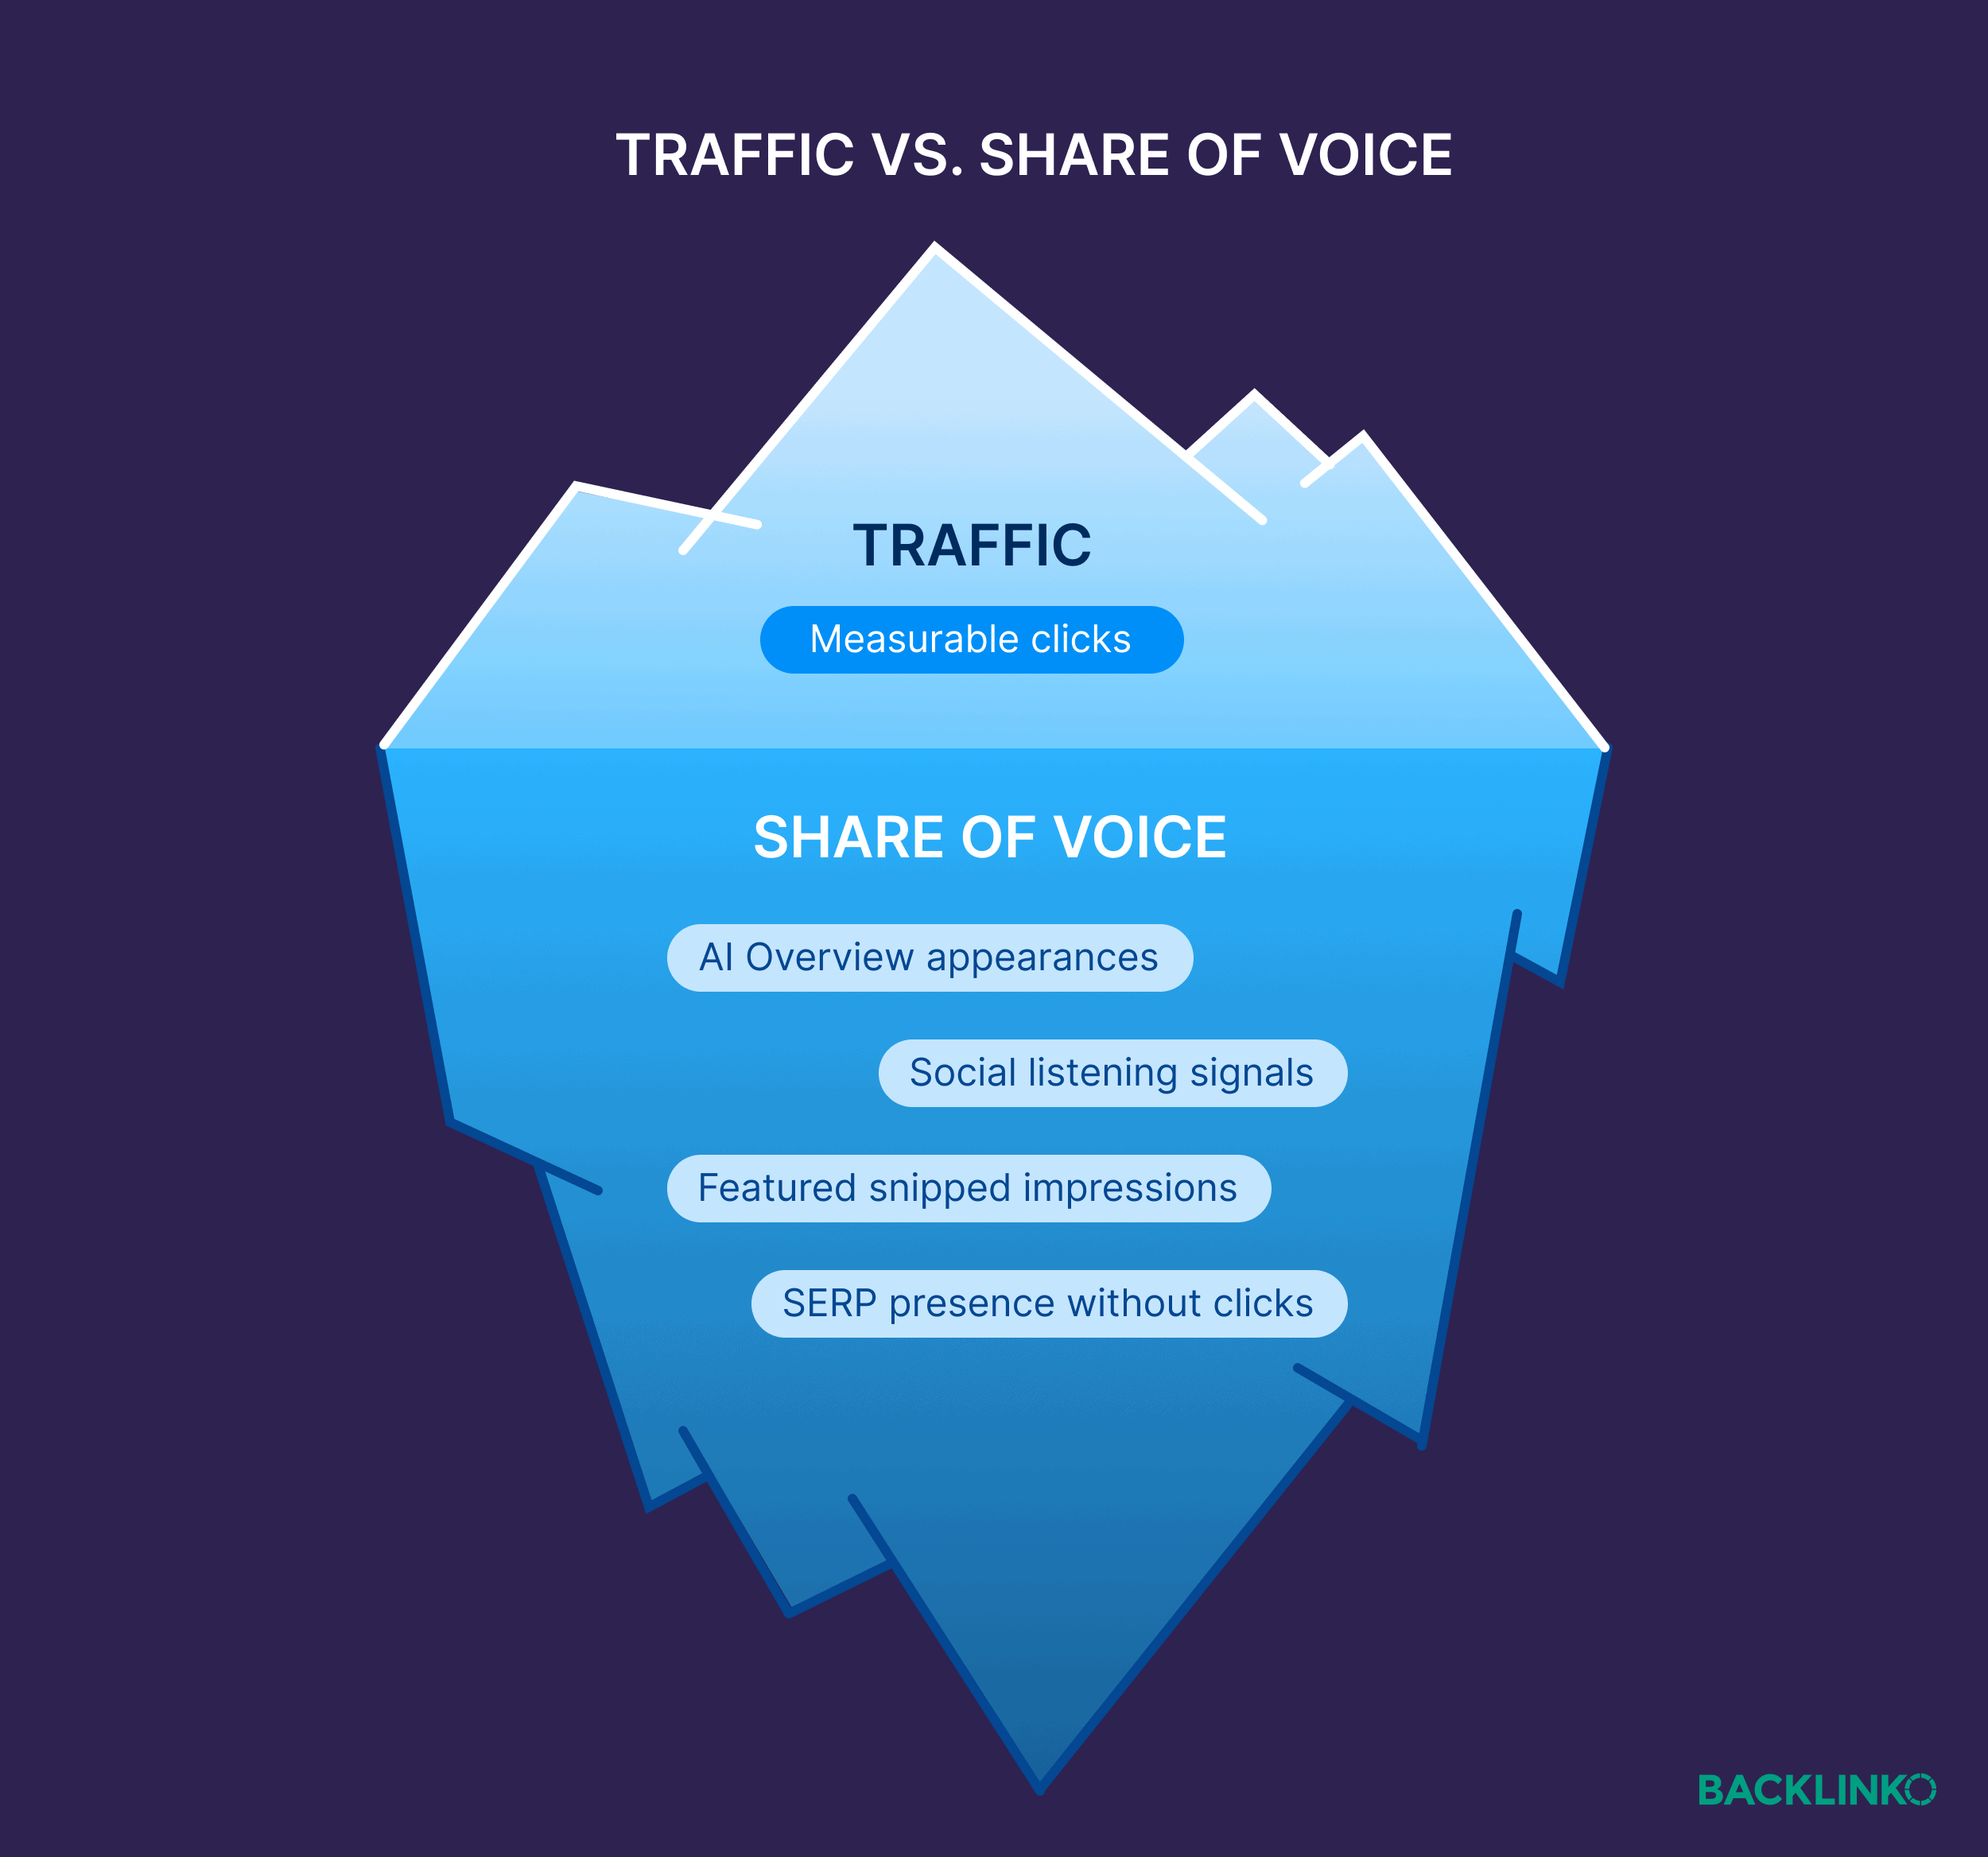
With the rise of "zero-click" searches, where users get their answers directly from AI Overviews or featured snippets, a massive percentage of your brand’s visibility is never recorded in Google Analytics. Traffic is, by definition, a lagging indicator. SoV, however, measures how often you appear in the consideration set, even when a user doesn’t immediately visit your site. It identifies the "discovery" phase that often precedes direct traffic.
2. Eliminating Silos
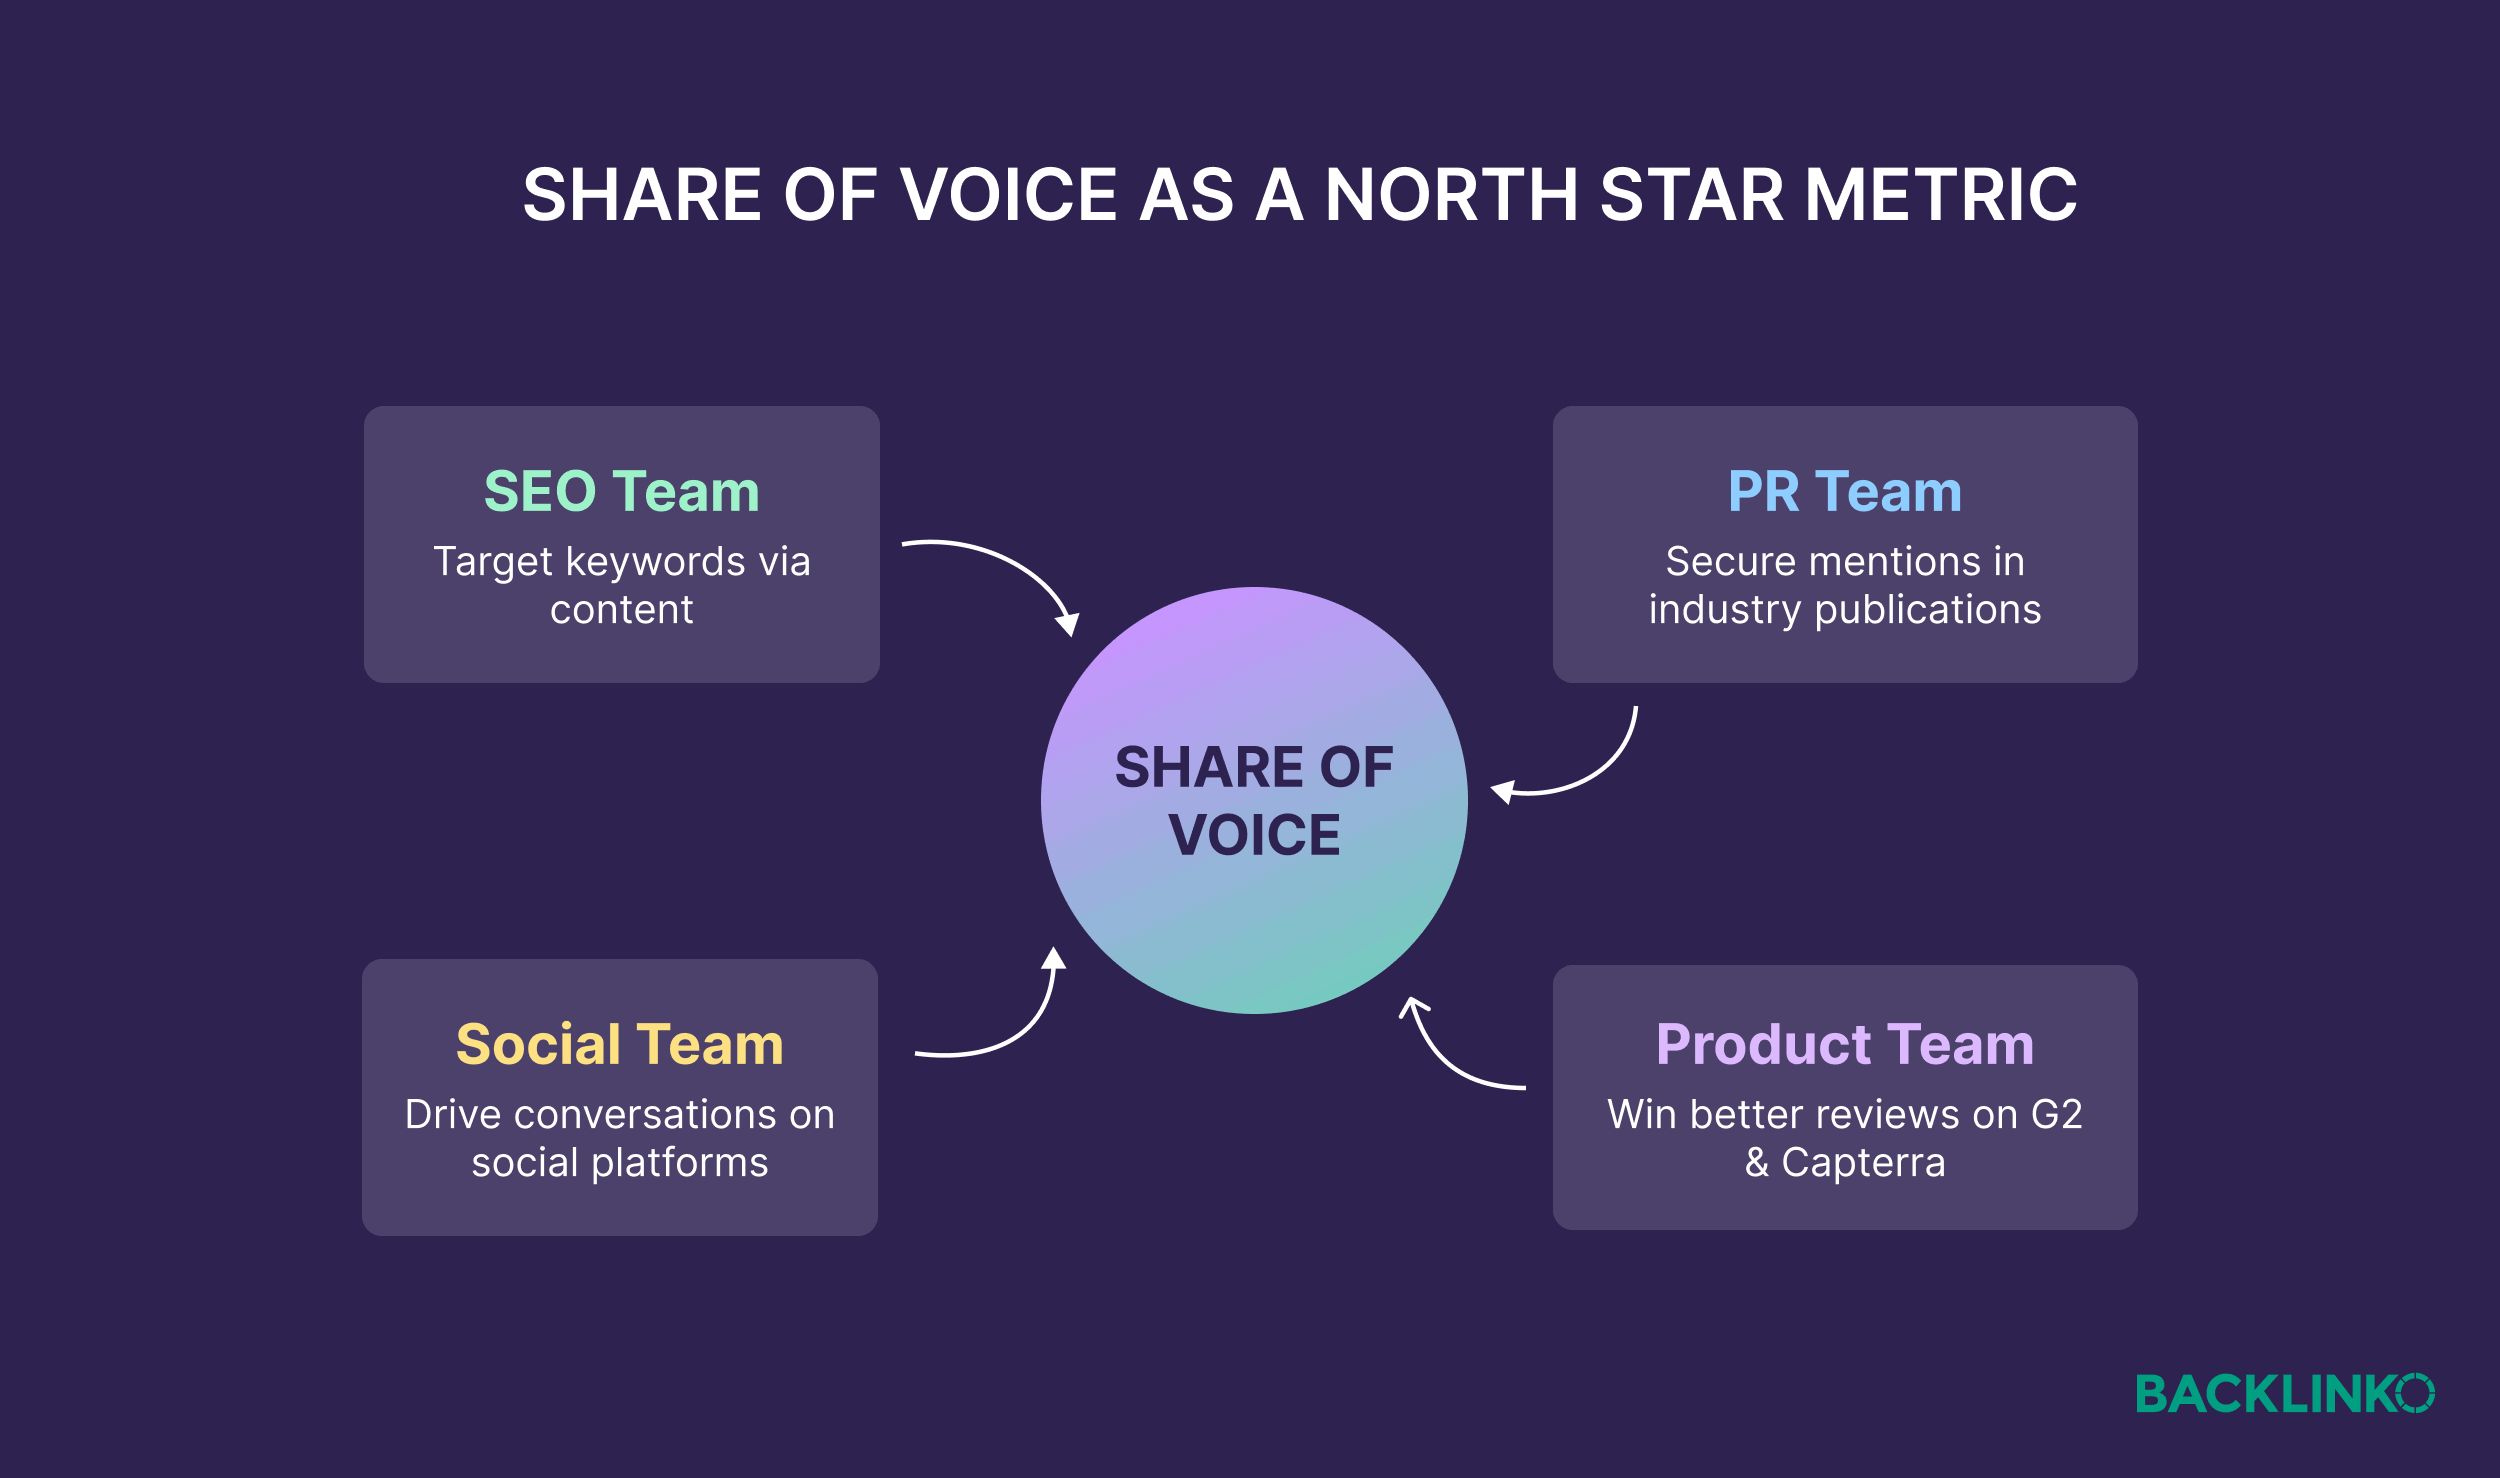
Marketing teams often operate in isolation: SEO wants traffic, PR wants mentions, and social wants engagement. SoV acts as a "North Star" metric that forces alignment. When every team sees how their efforts contribute to the same visibility percentage, it transforms organizational collaboration. It moves the focus from "did we get more clicks?" to "did we increase our share of the market’s attention?"

How to Measure Share of Voice in 4 Steps
To calculate your SoV, follow this structured, four-step framework:

Step 1: Define Your Industry Landscape
Start by defining the boundaries. Use "topic clusters" tied to revenue to ensure you aren’t measuring noise. For a project management software, you might focus on:
- Awareness: "Project management basics"
- Consideration: "Agile software for teams"
- Decision: "Best project management software for agencies"
Mapping your SoV to these funnel stages is critical. If you find your visibility is concentrated at the top of the funnel but disappears at the decision stage, you have a clear mandate: prioritize comparison pages and case studies.

Step 2: Build Your Keyword & Prompt Libraries
You need 200–500 queries that capture how your audience searches.
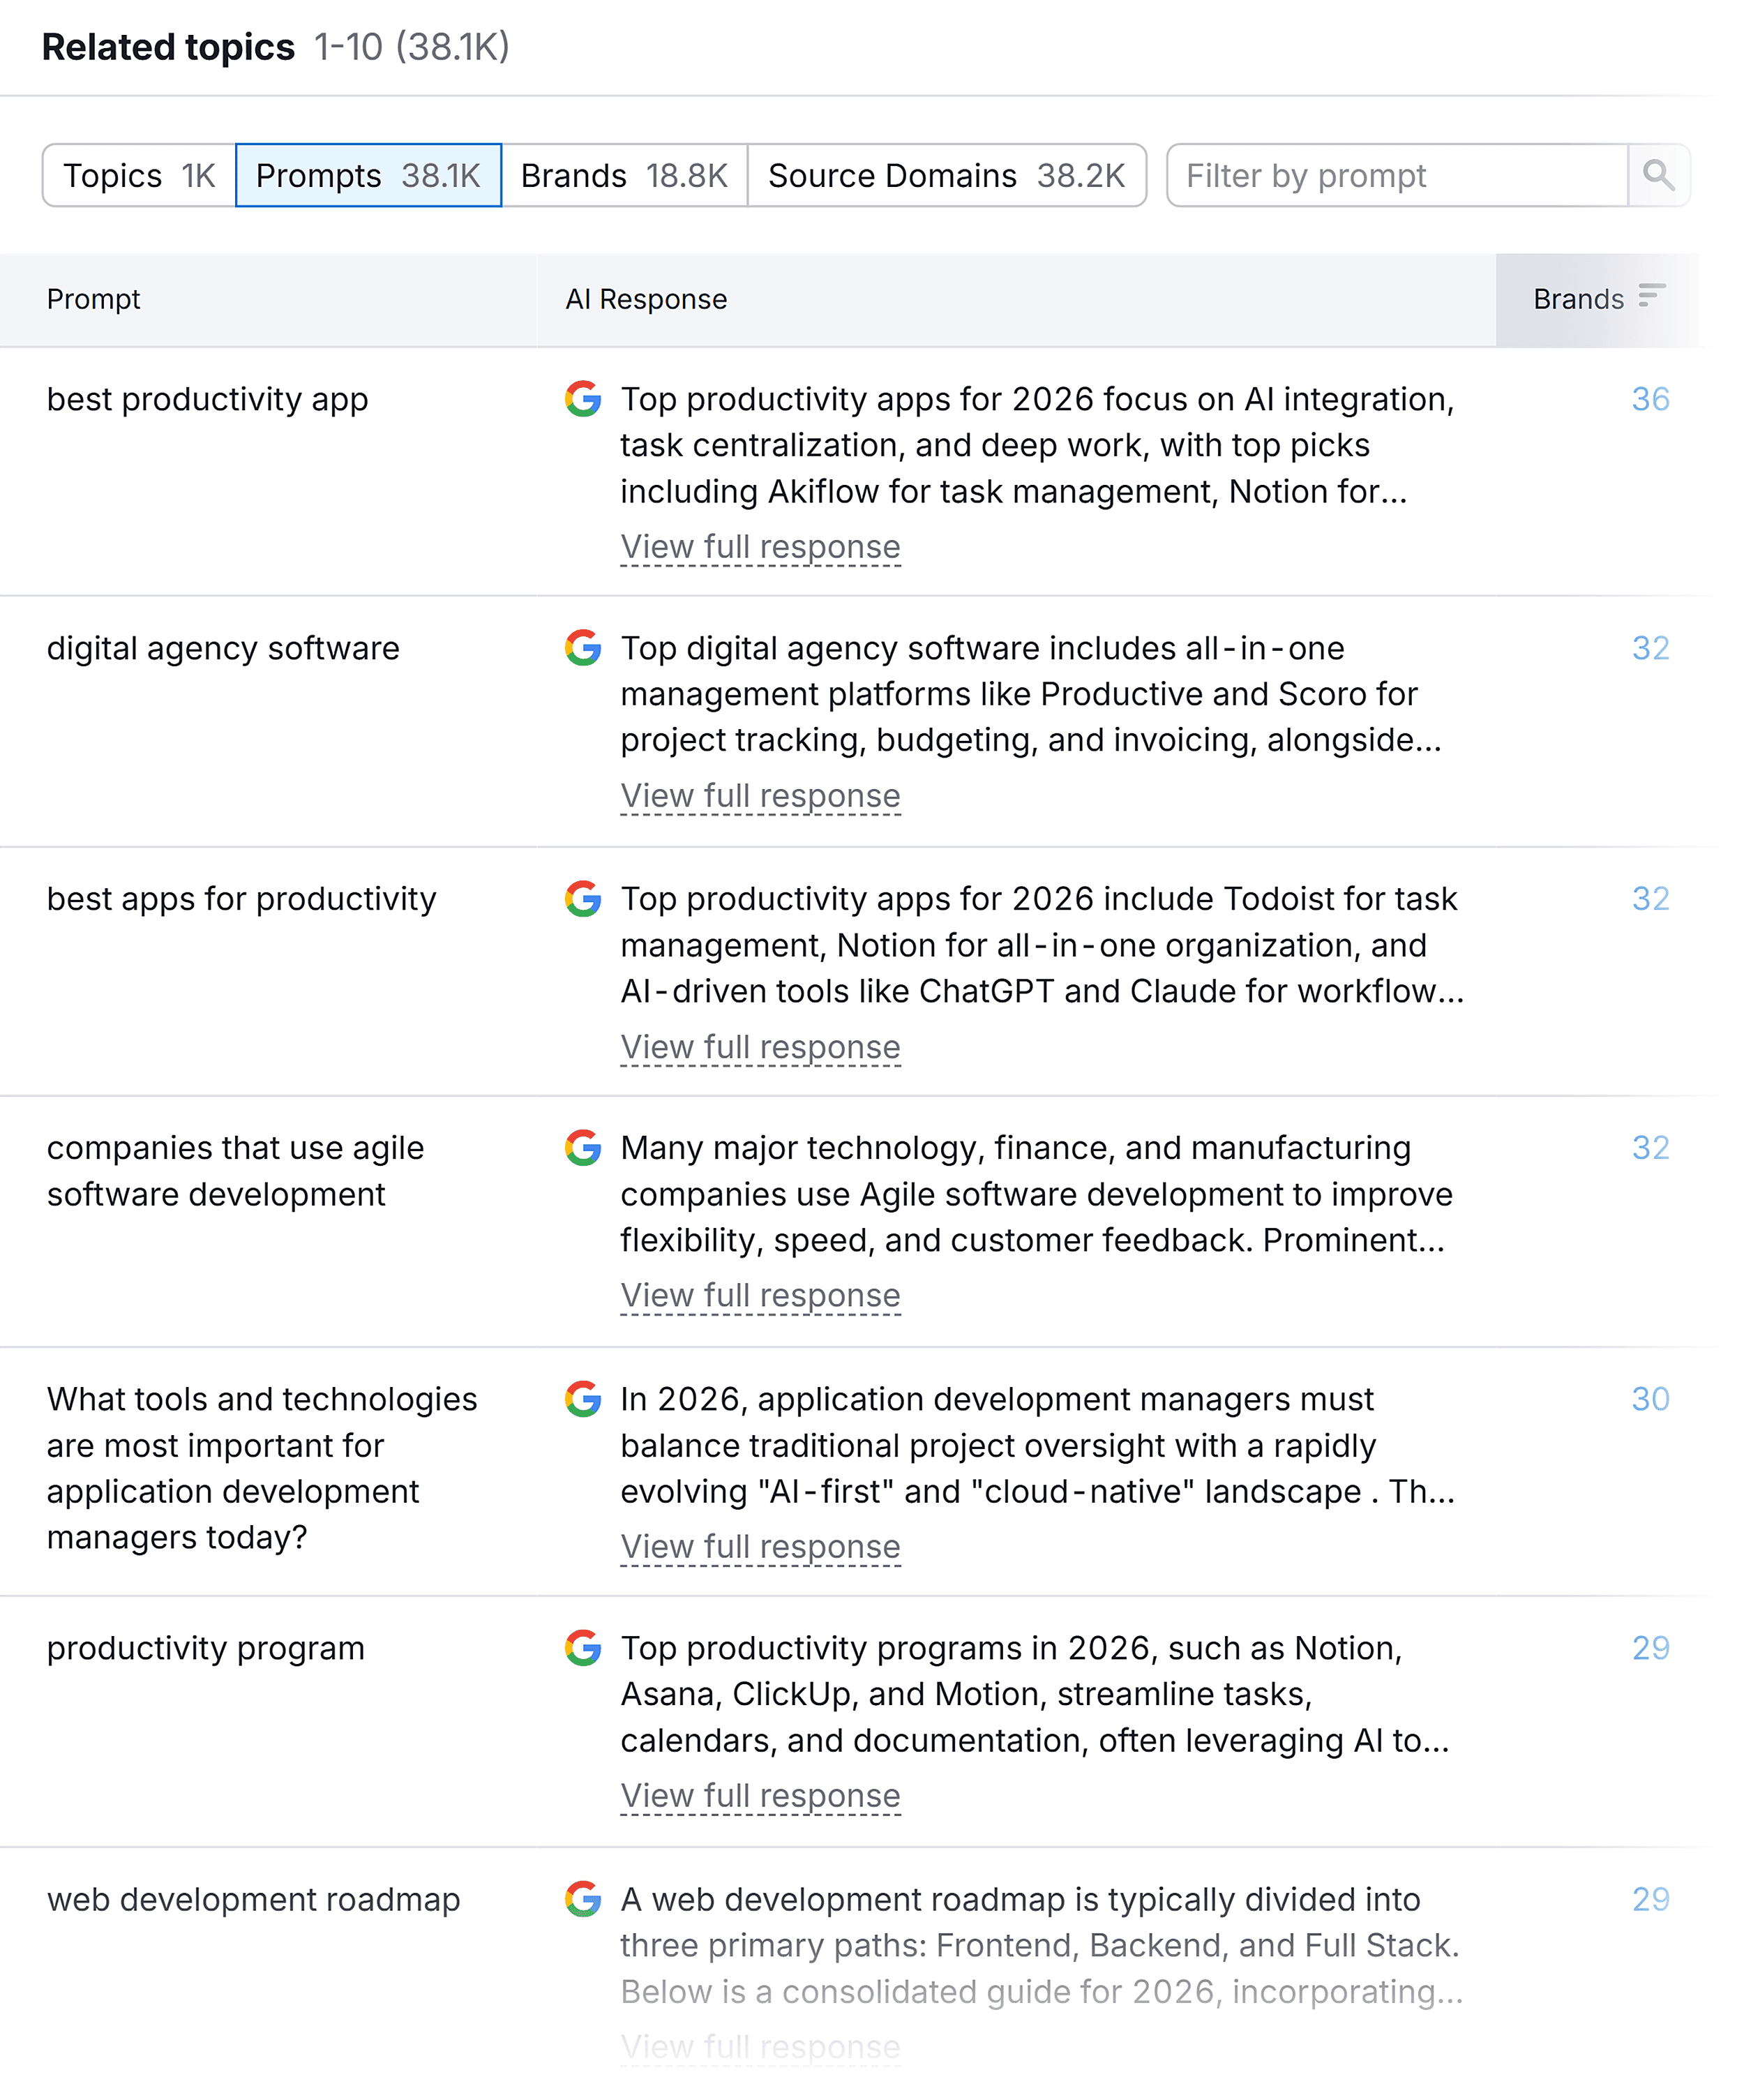
- SEO Data: Export your "Queries" report from Google Search Console and filter for high-impression terms.
- Competitor Intelligence: Use tools like the Semrush Keyword Gap to find "missing" keywords—terms your competitors rank for, but you do not.
- AI Prompting: Monitor community forums like Reddit or Slack to see how users phrase their pain points. Turn these into prompts: "What is the most user-friendly tool for a 10-person design agency?"
Step 3: Calculate Your SoV
Your SoV formula is: (Your Estimated Traffic / Total Market Traffic) × 100.
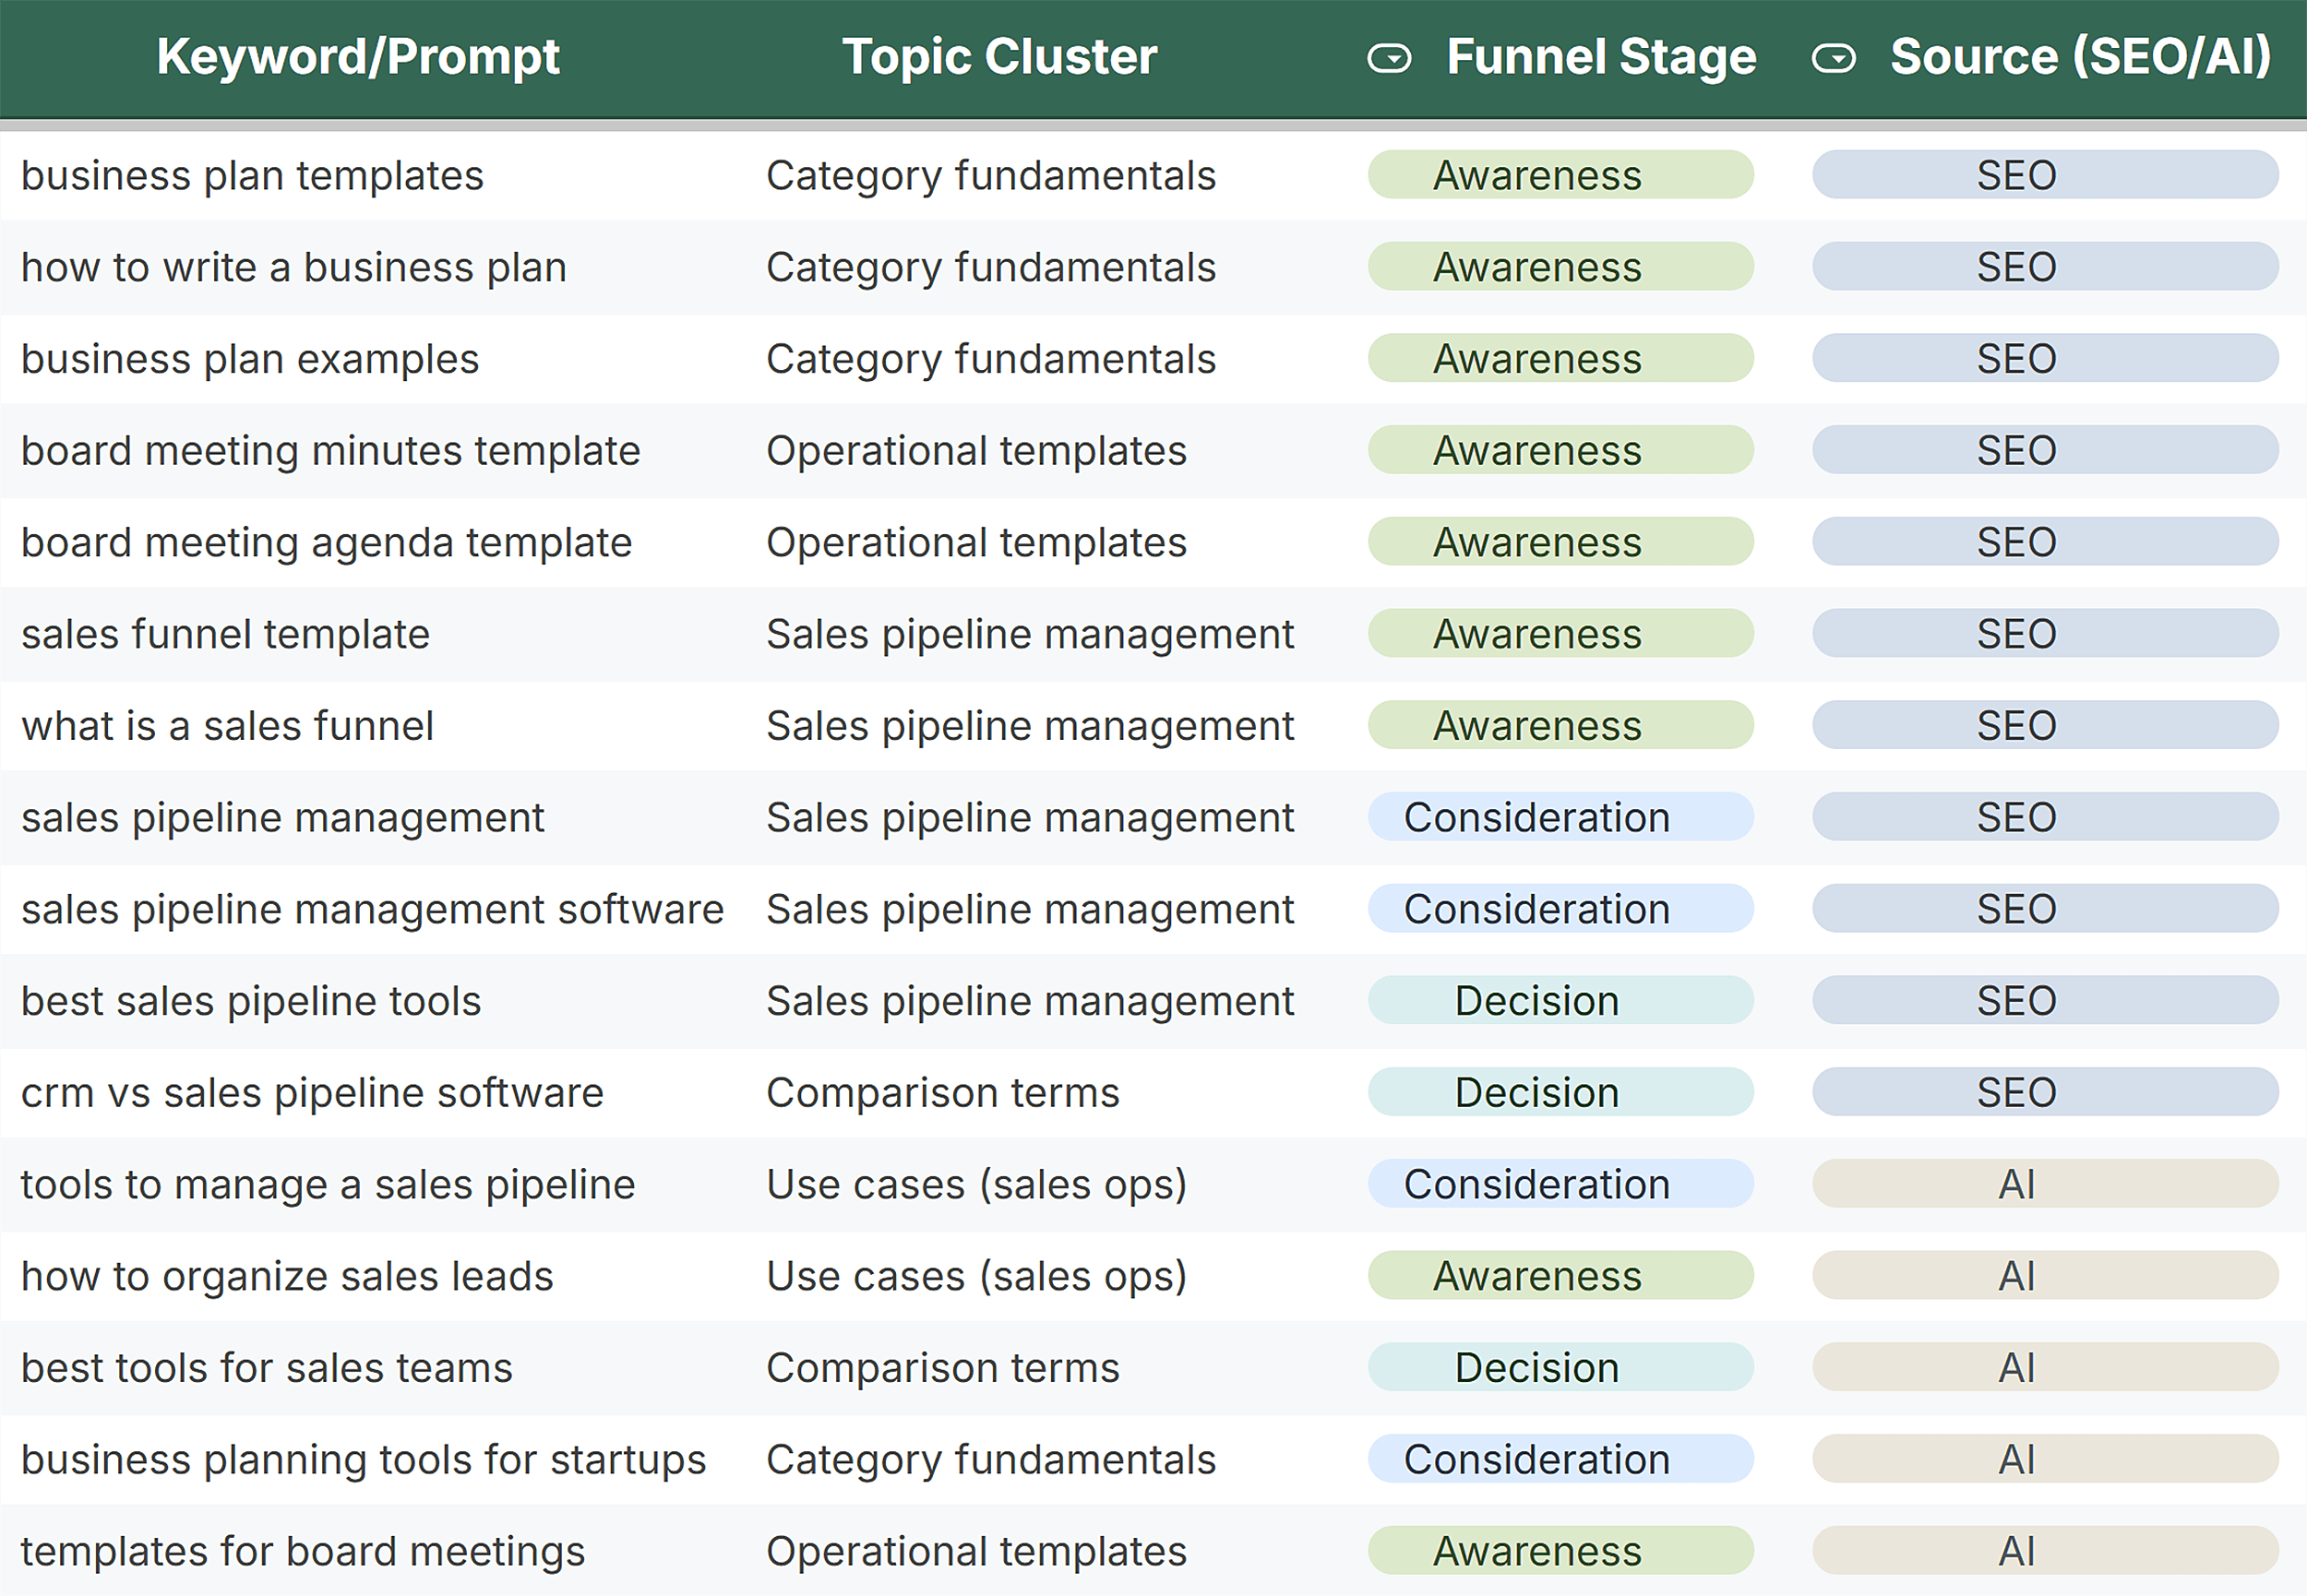
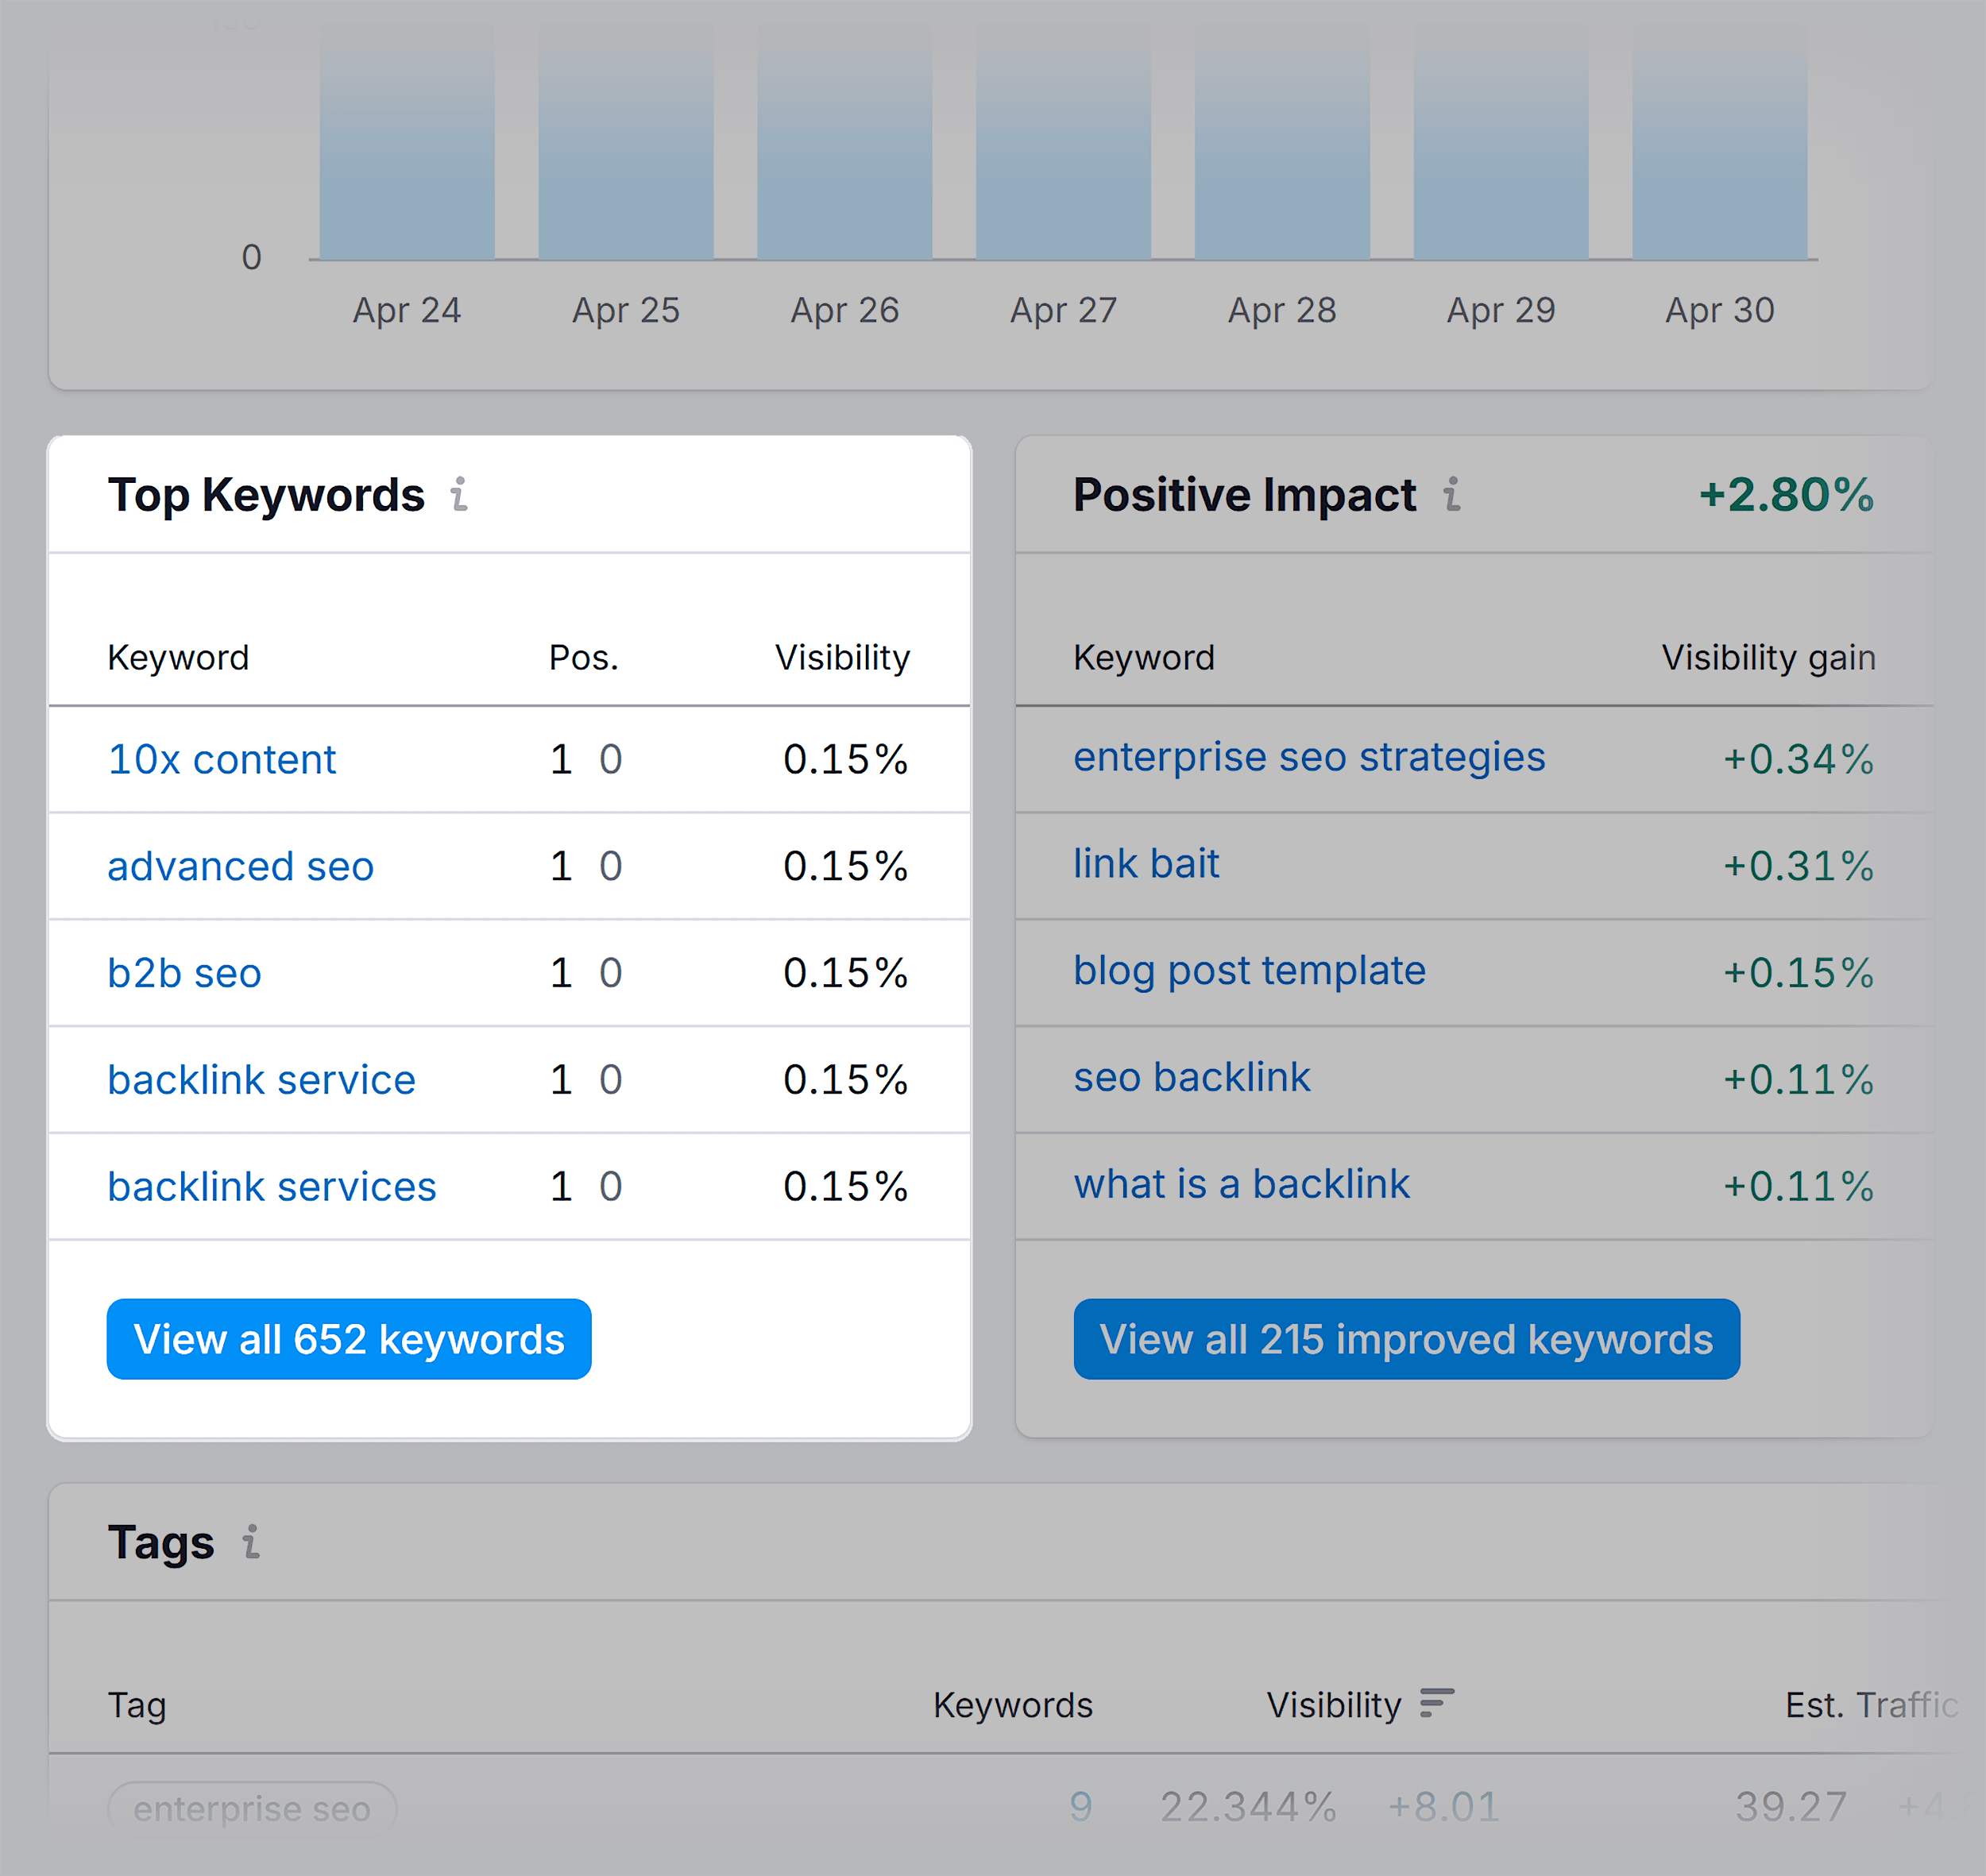
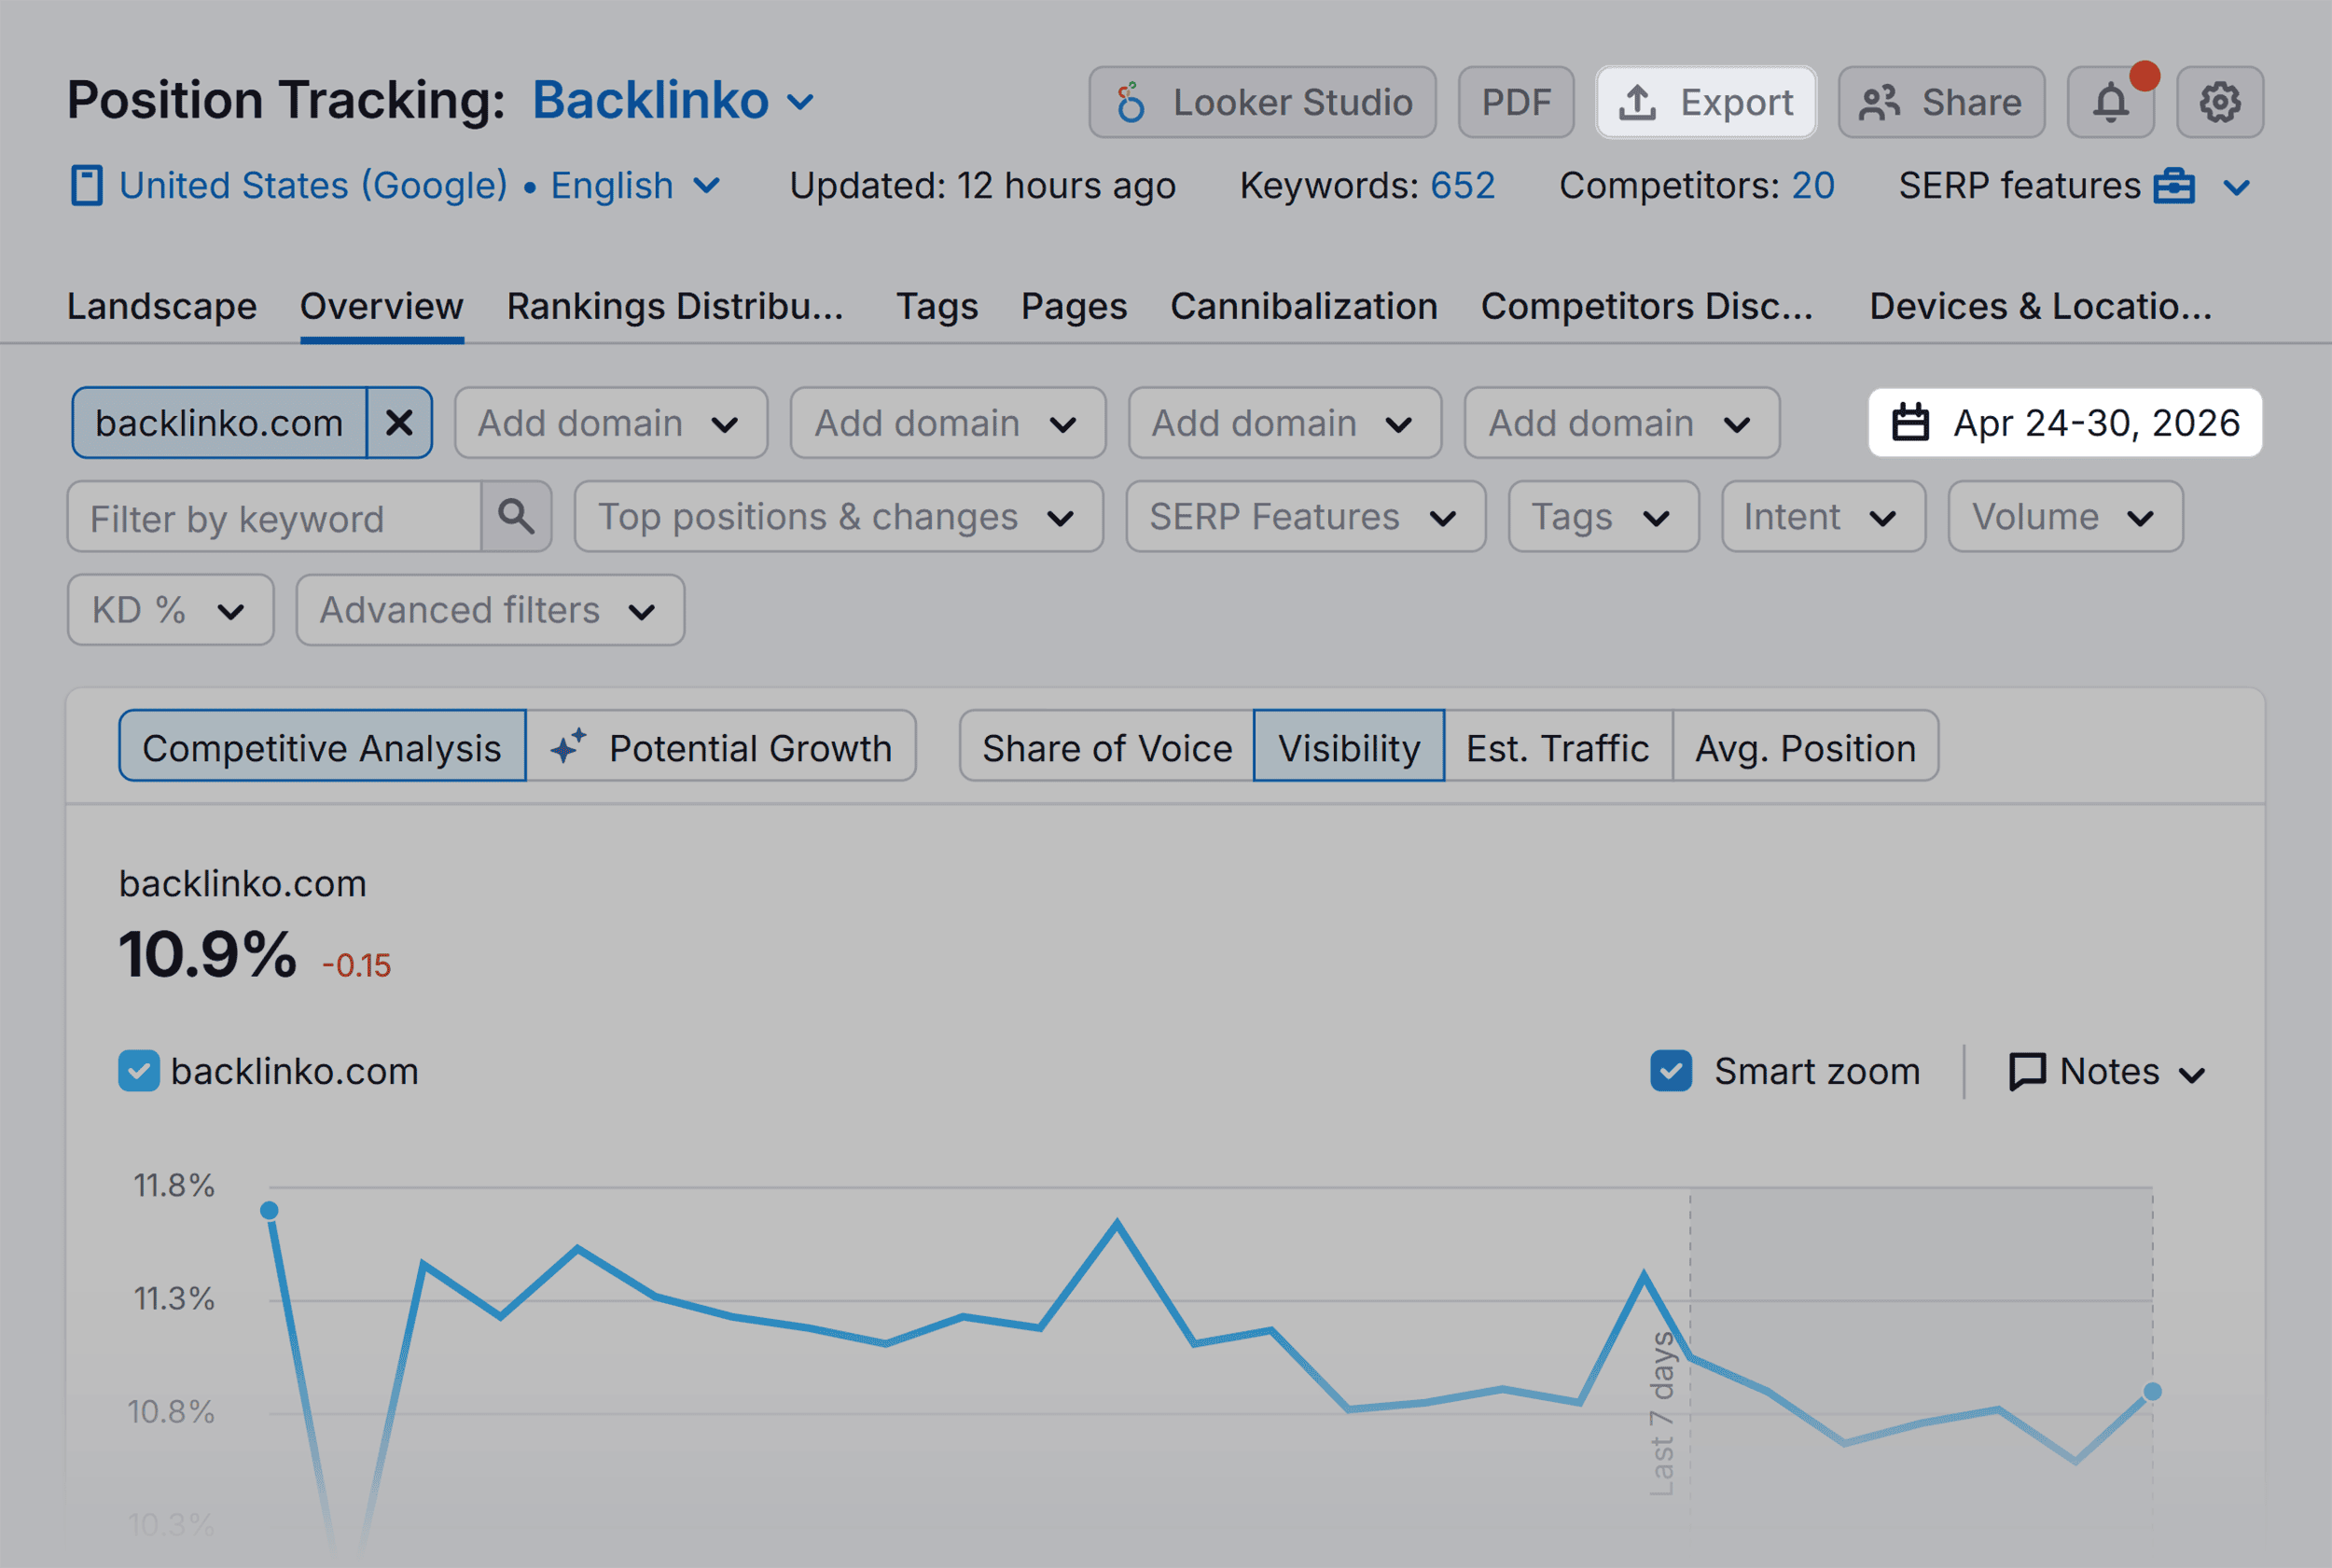
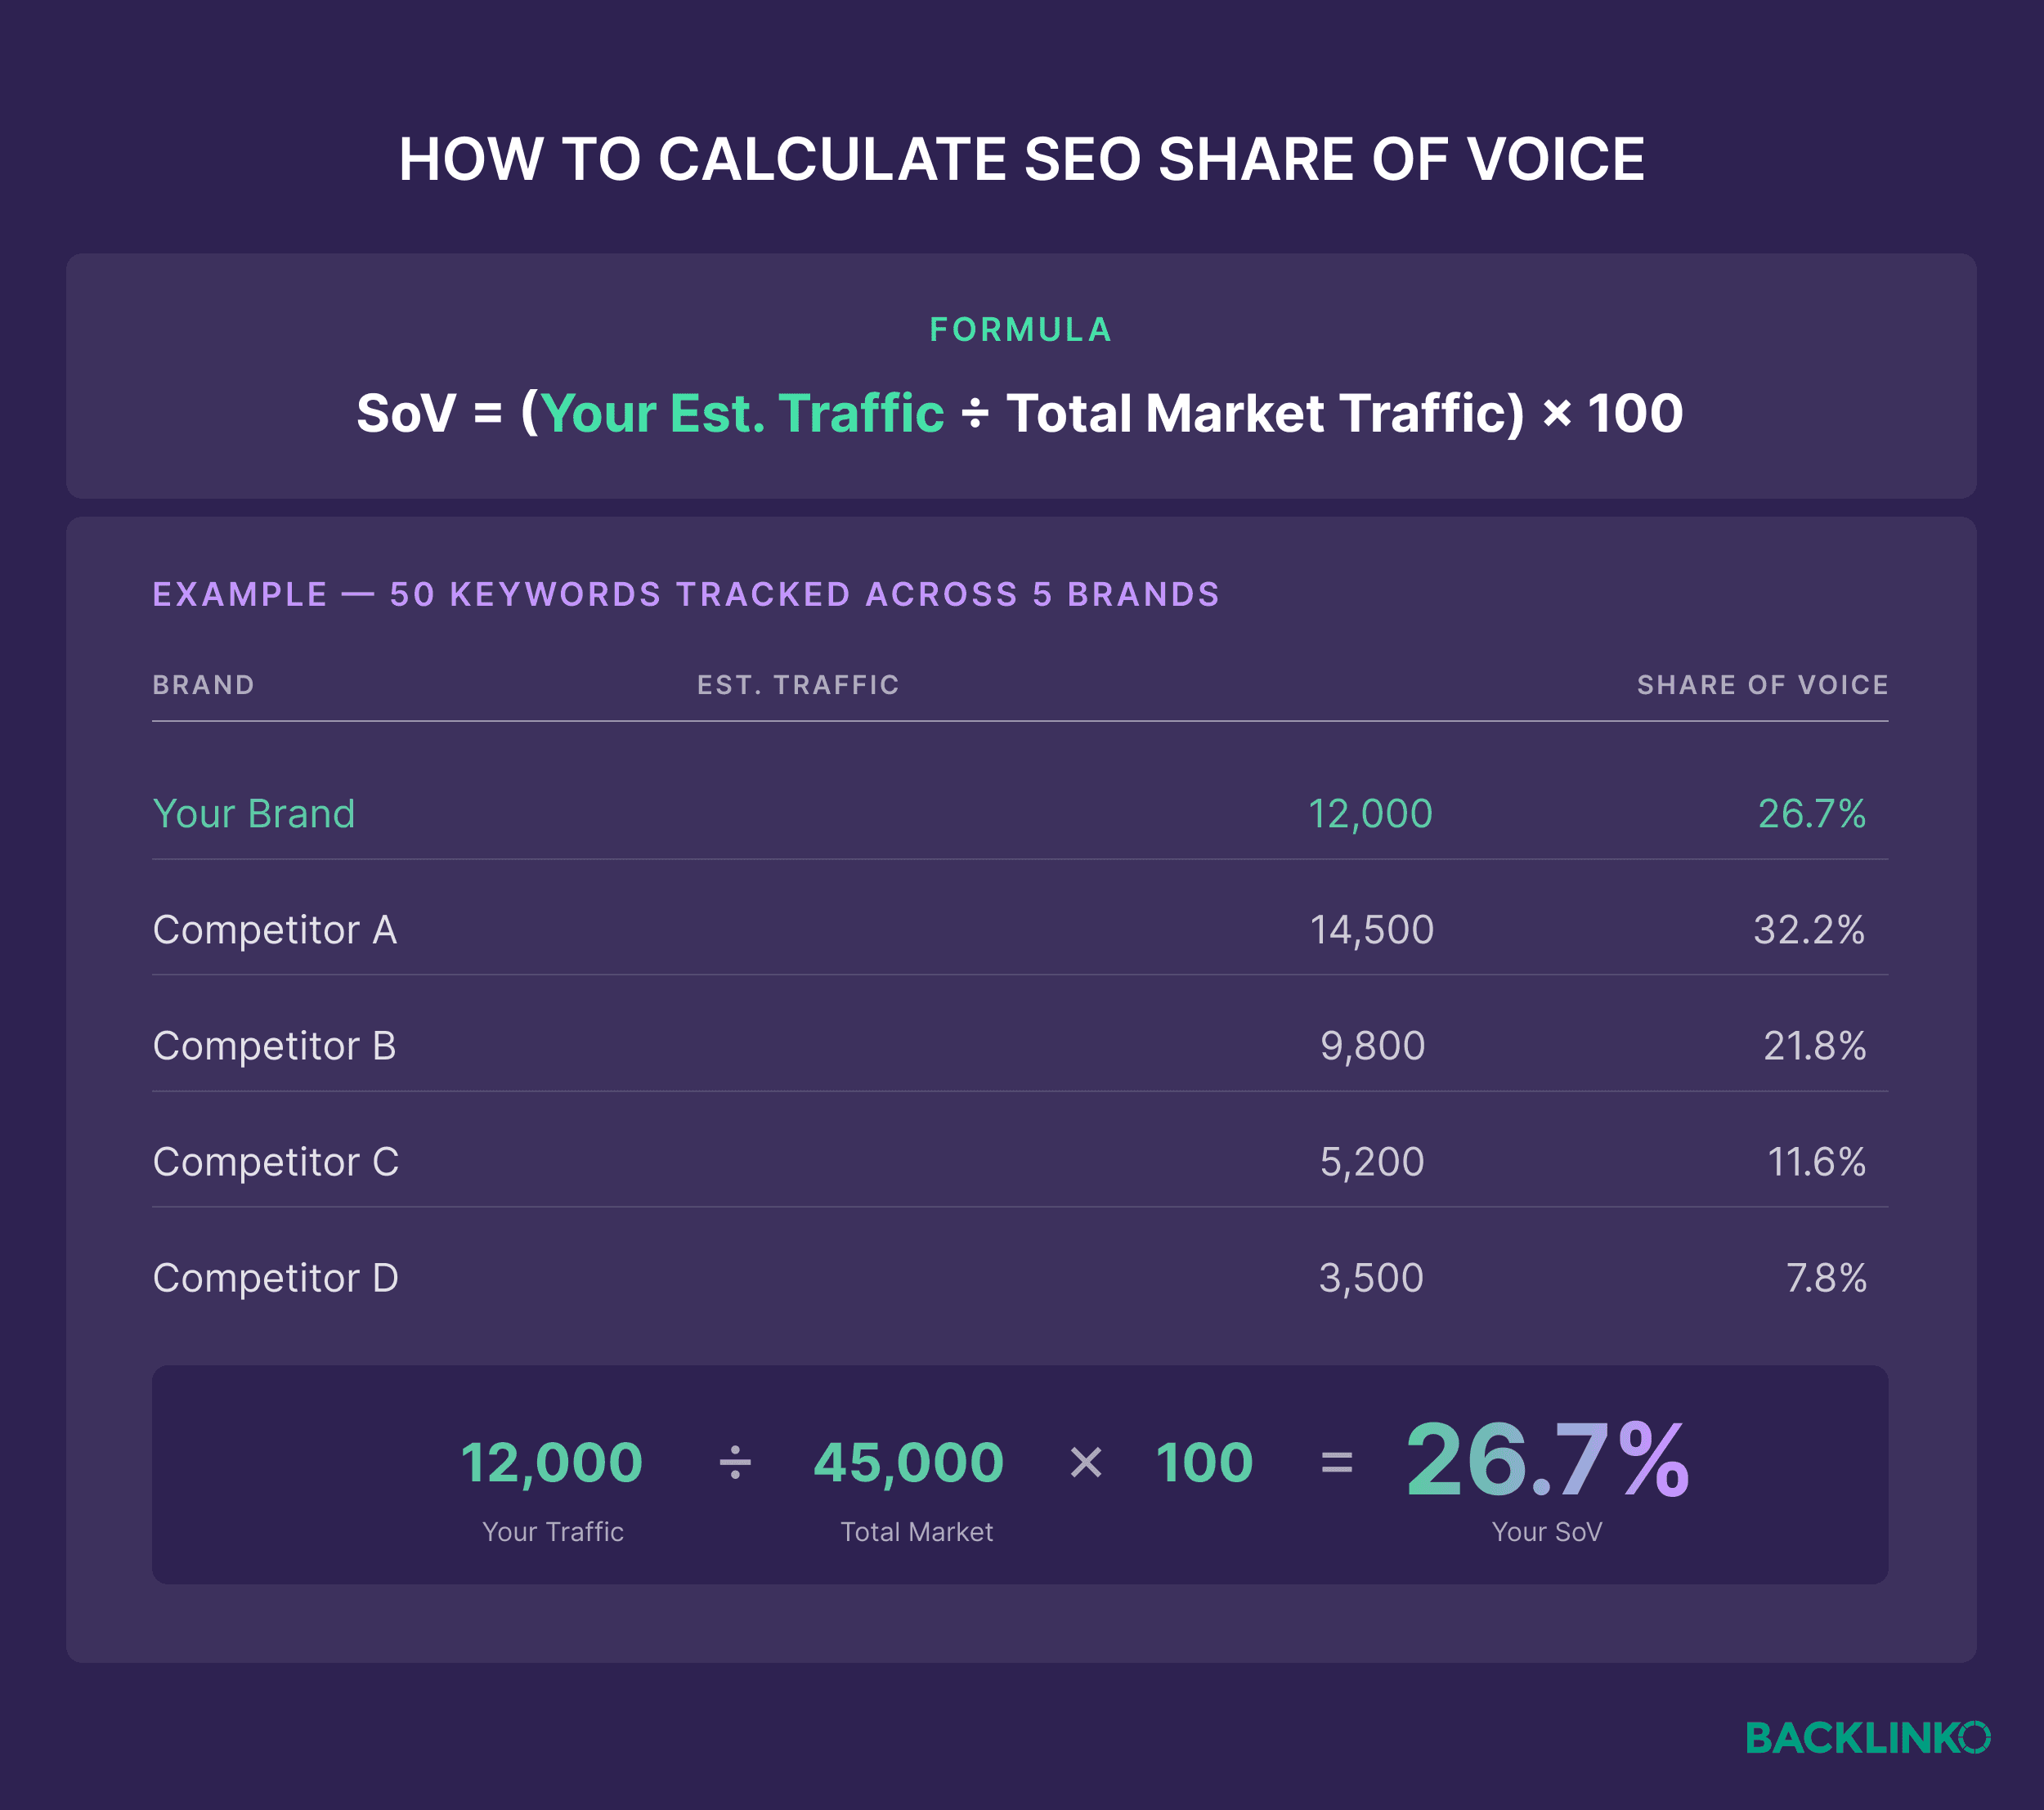
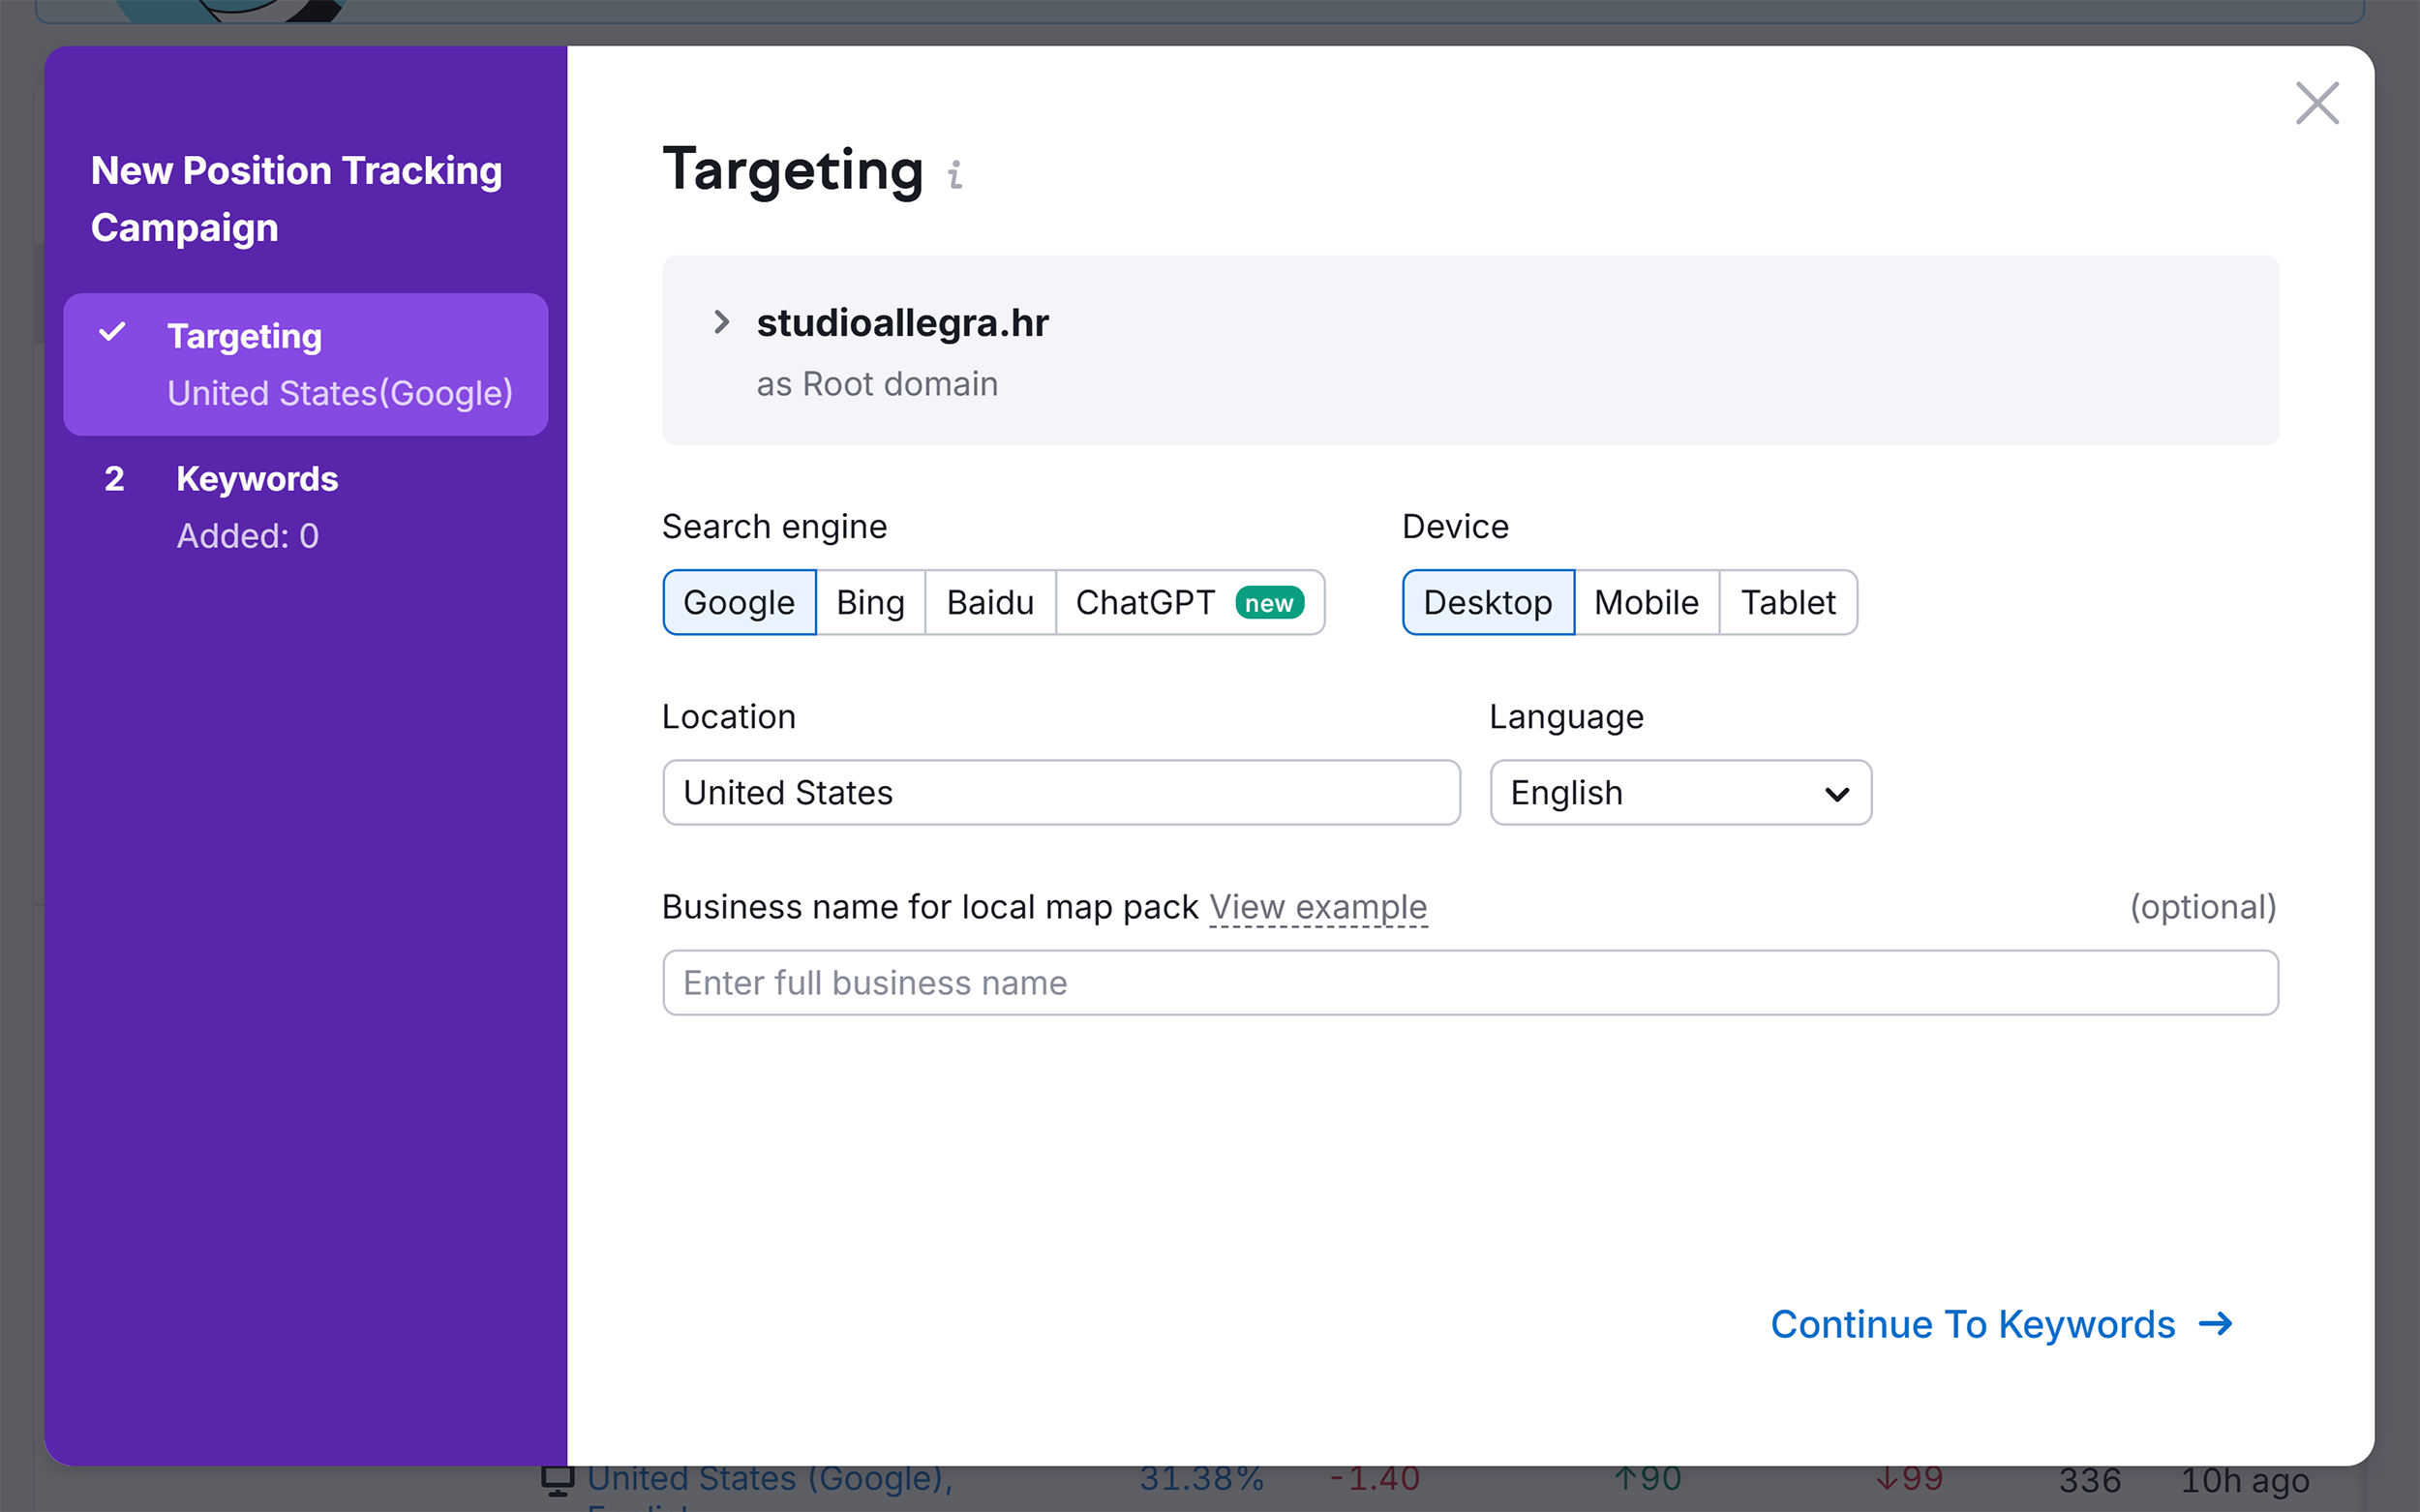
For SEO, use a rank-tracking tool to monitor your position and calculate the estimated click-through rate (CTR). For AI, conduct regular testing of your prompt library across LLMs. While manual tracking is possible for small sets, tools like the Semrush AI Visibility Toolkit automate this by testing hundreds of prompts and analyzing the frequency and sentiment of brand mentions.
Step 4: Establish a Baseline and Track Trends
Create a dashboard that tracks these metrics monthly. A monthly cadence allows you to spot trends without reacting to daily "noise." Use quarterly deep dives to review shifts in competitor strategy. If a competitor begins gaining 5% or more in your core clusters, it’s an early warning signal that your market territory is under threat.
Strategic Implications: How to Move the Needle
Once you have your data, diagnose your gaps:
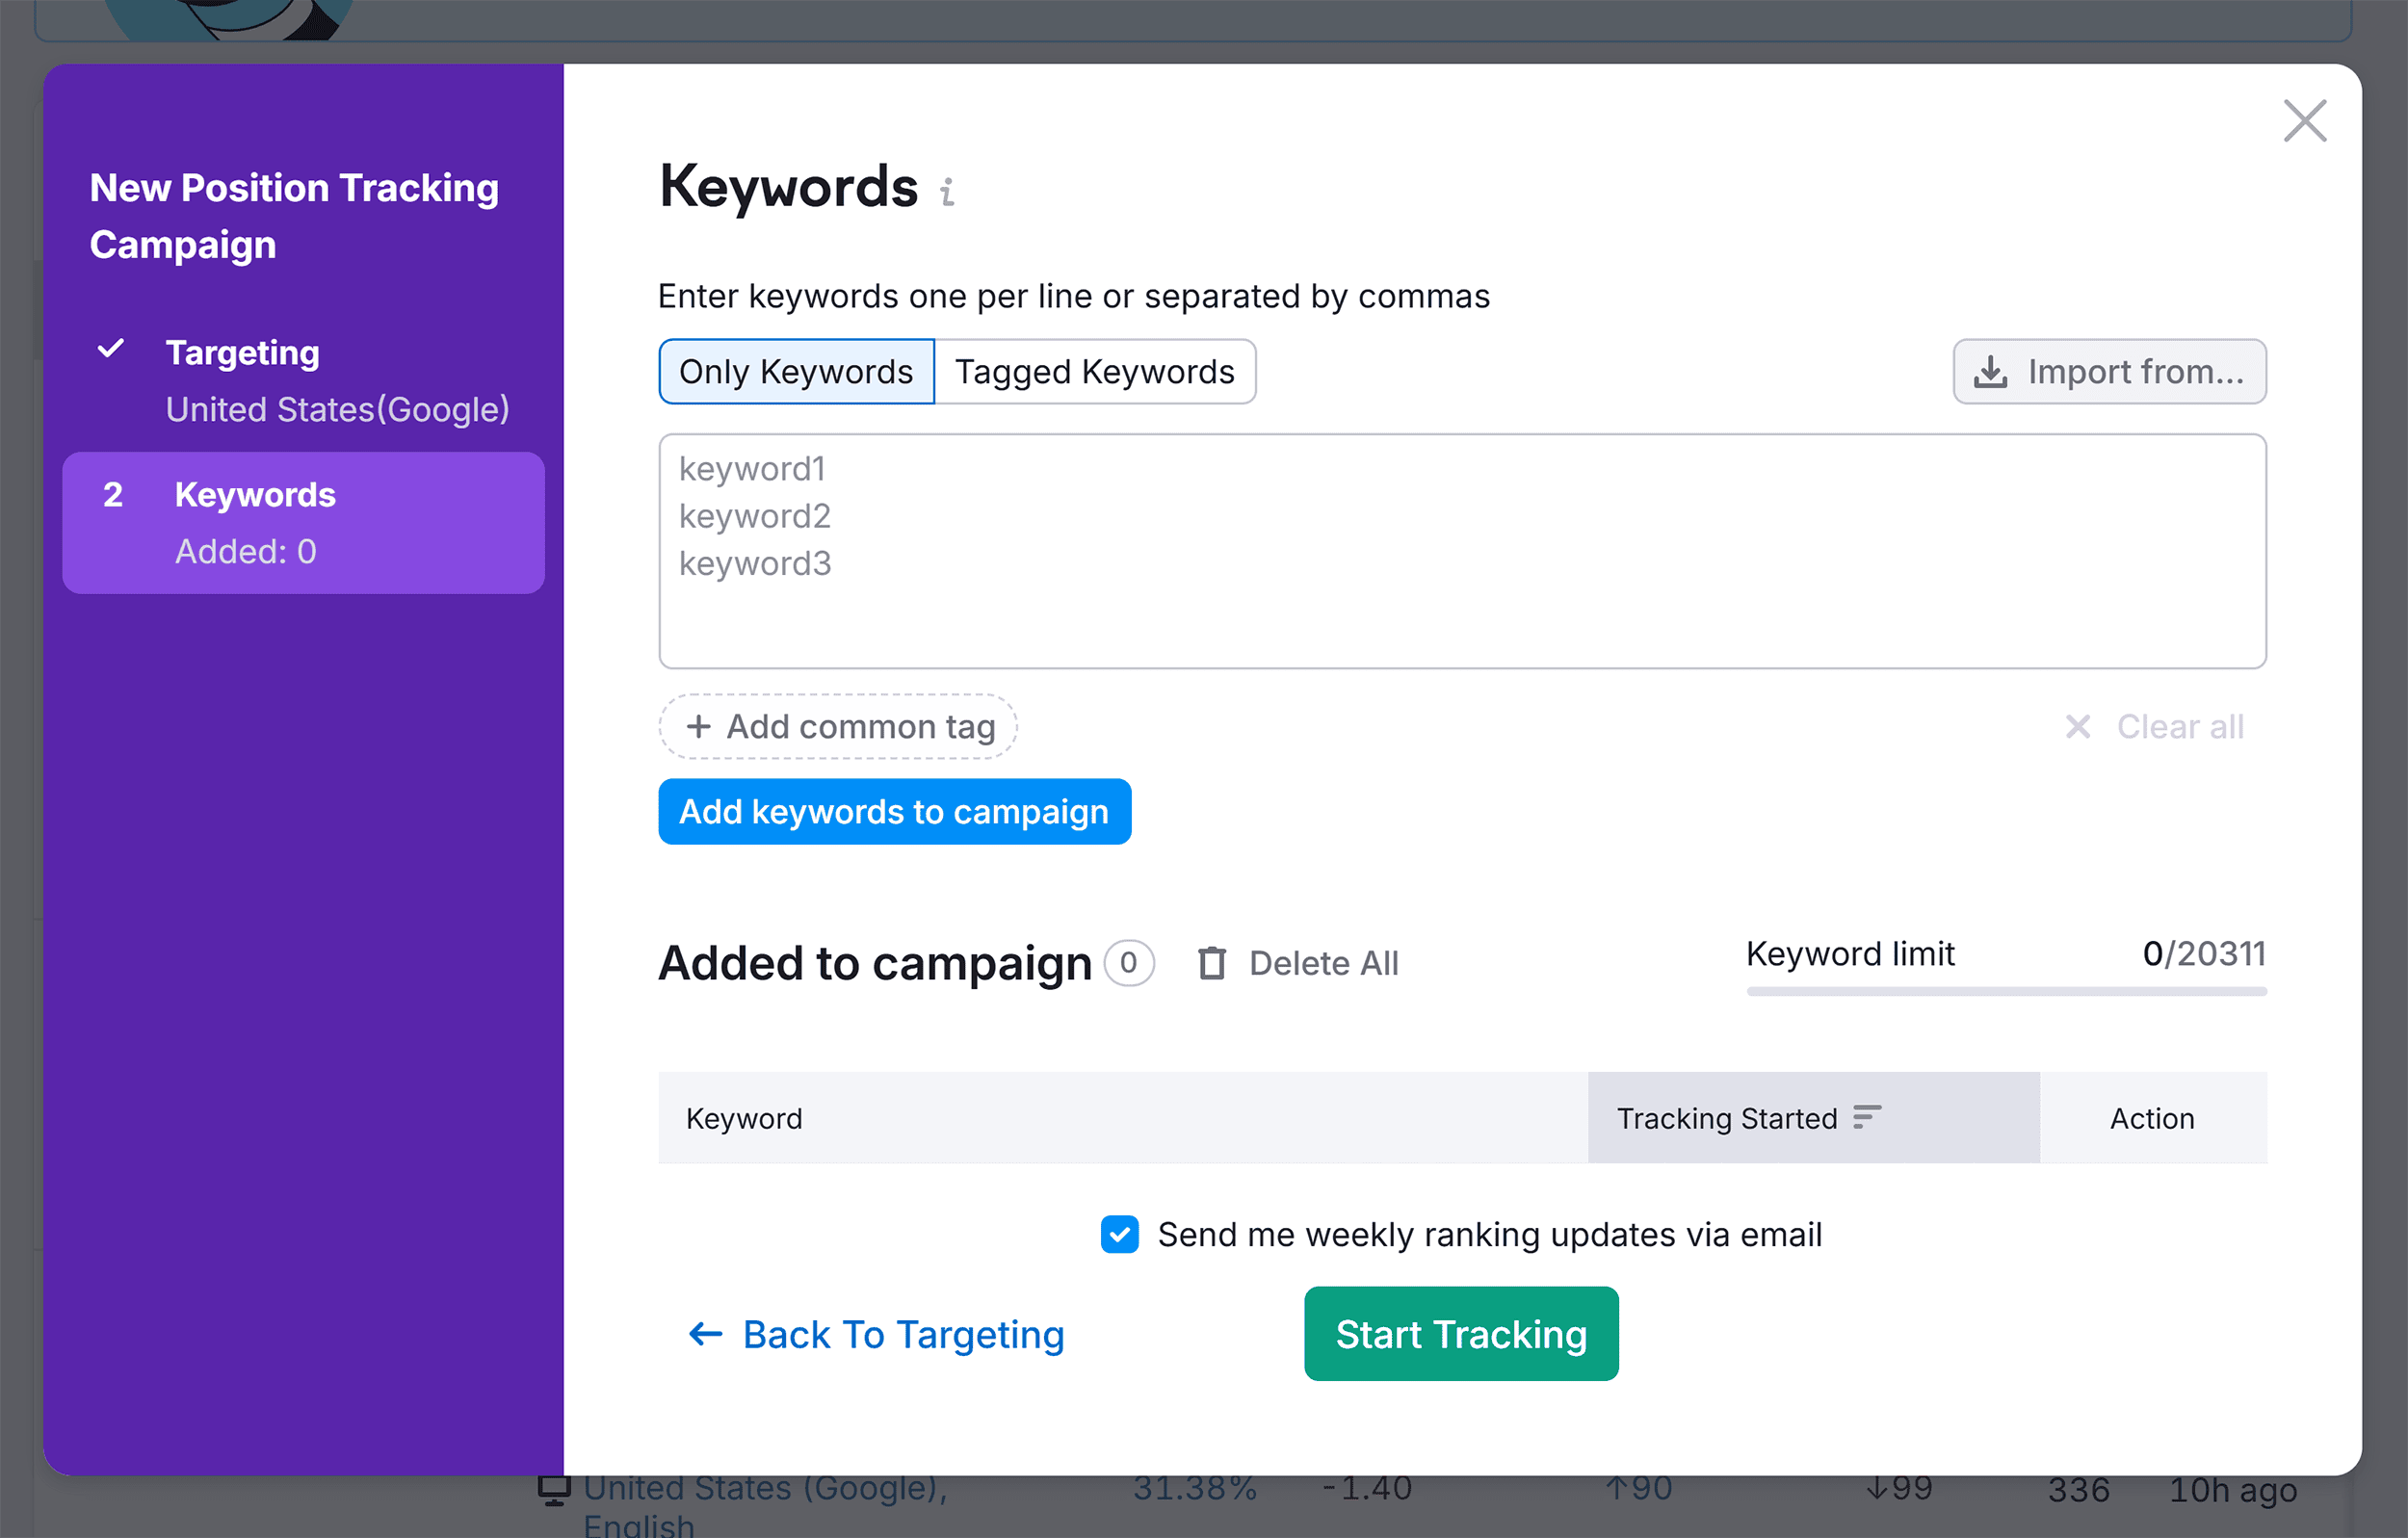
- If you have <10% SoV: You are invisible. Prioritize pillar content and backlink acquisition to build authority in those clusters.
- If you have high SoV but low conversions: You have an efficiency problem. Stop creating top-of-funnel content and shift resources to bottom-of-funnel comparison assets.
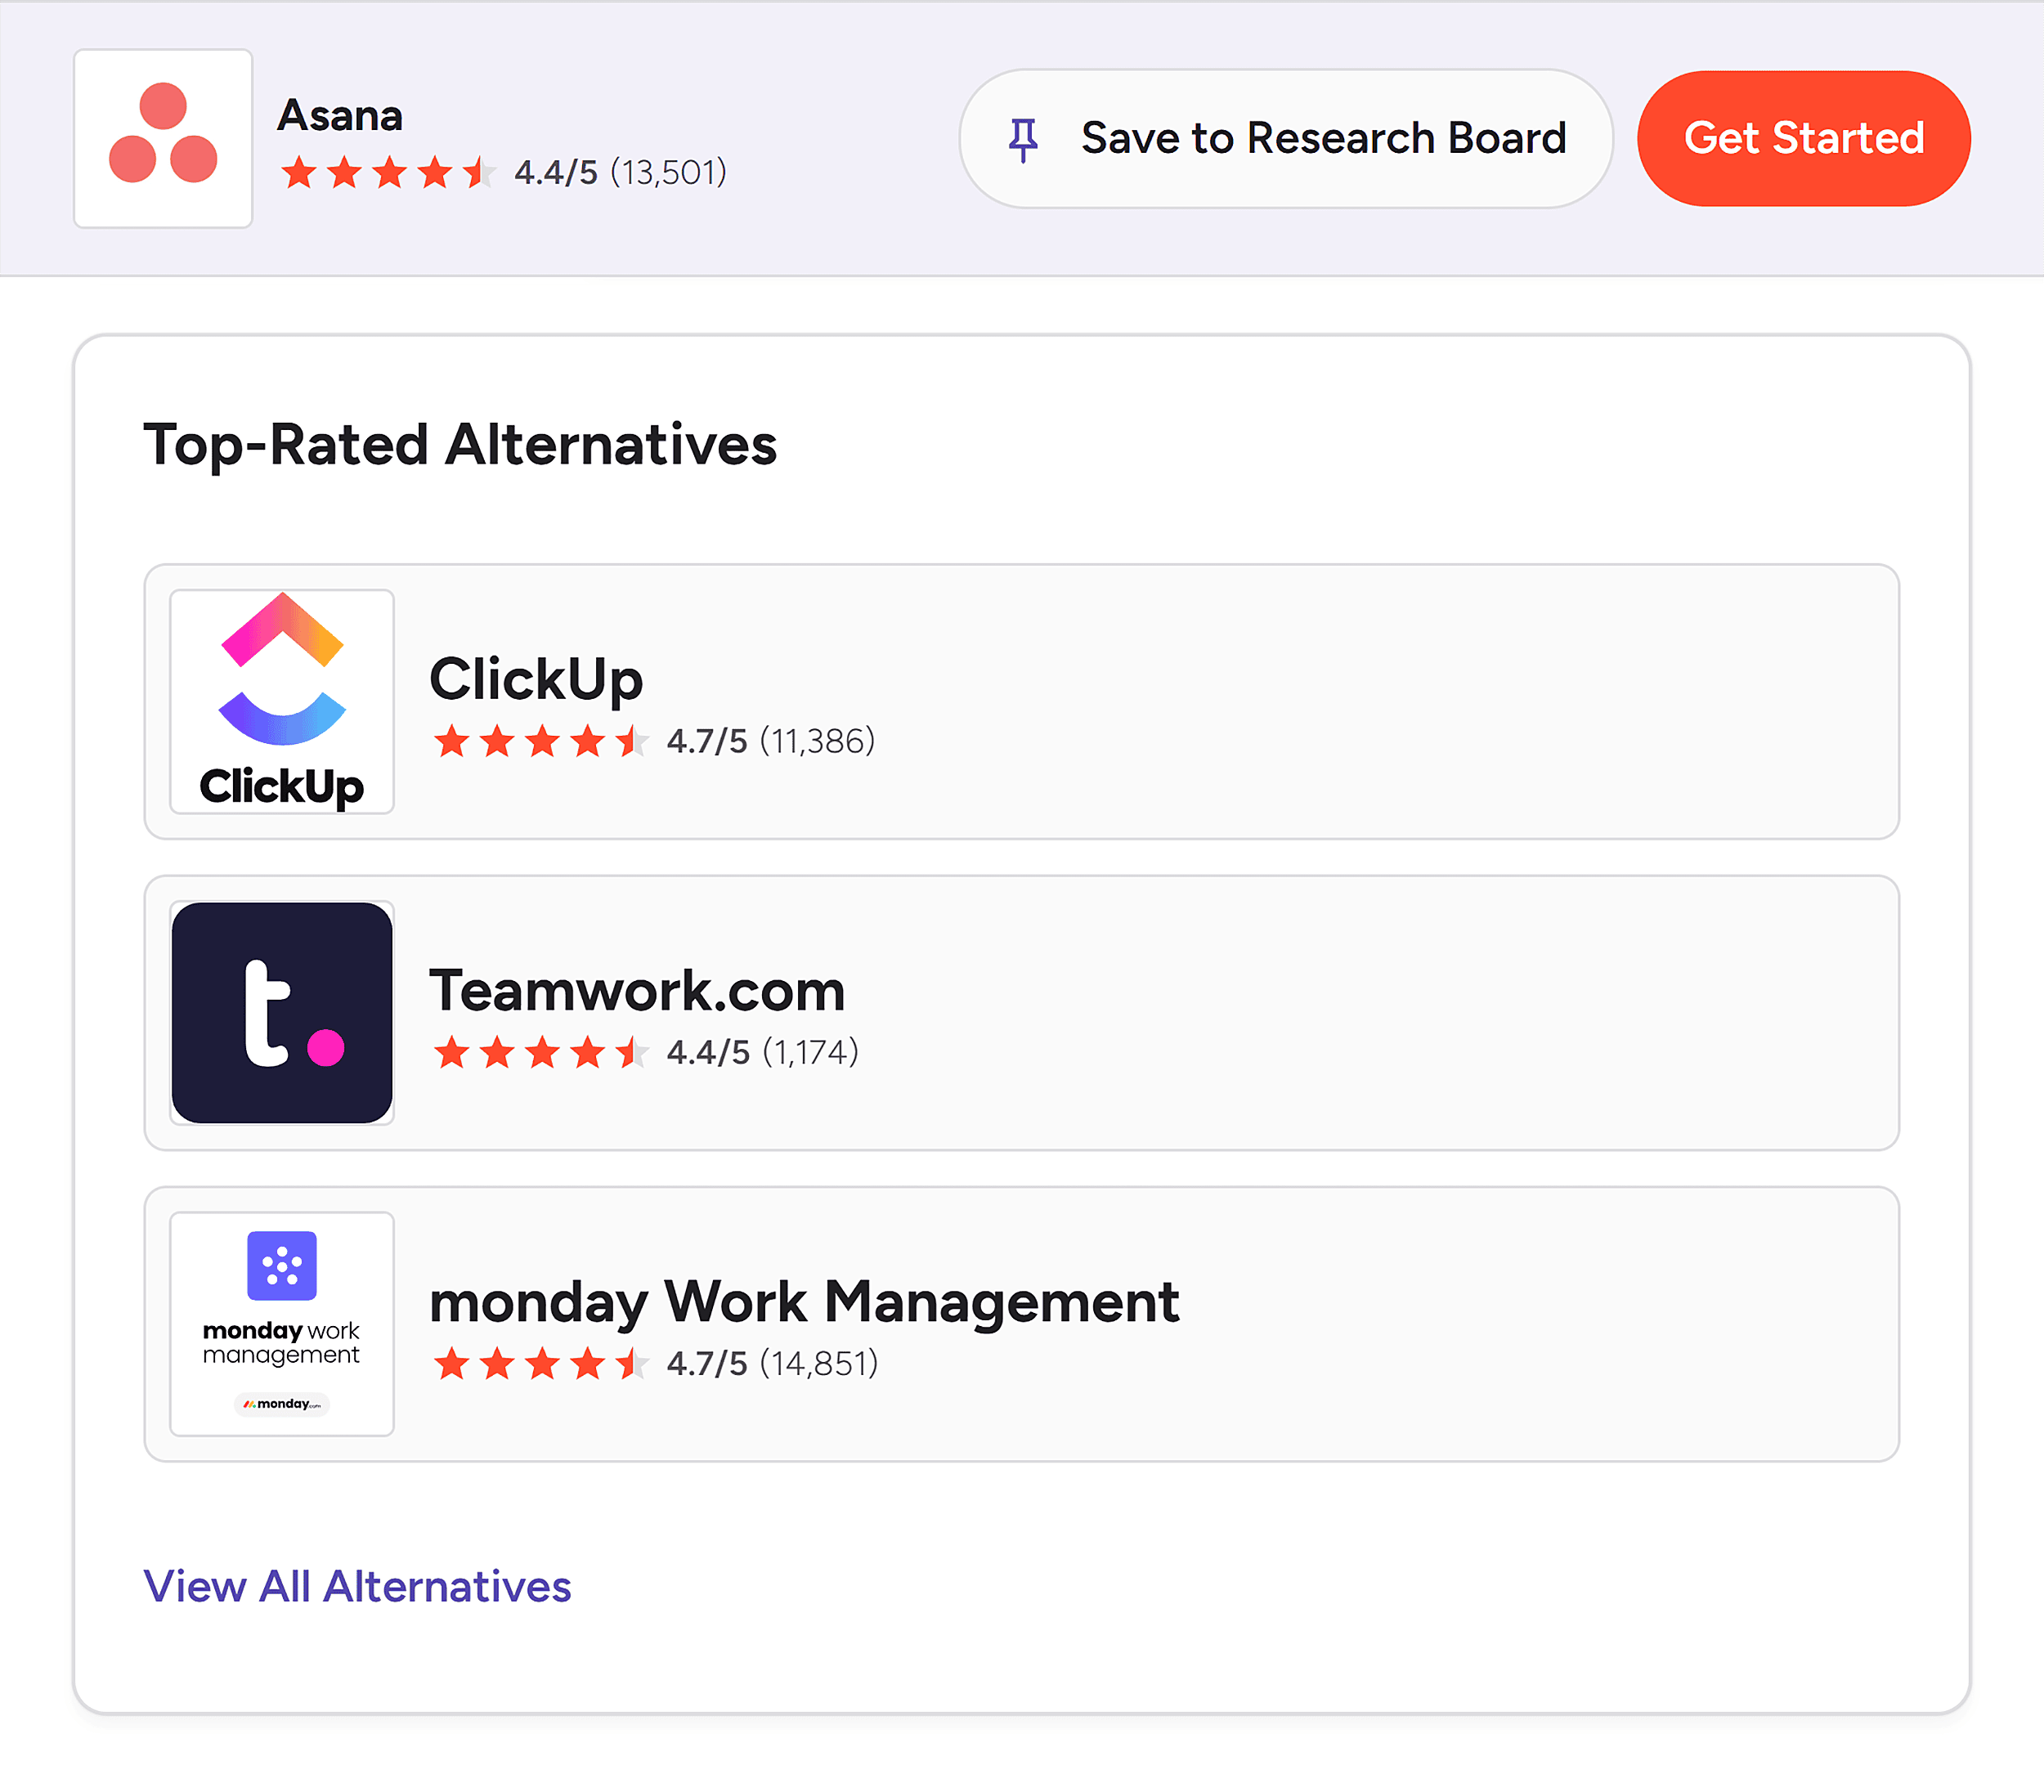
- If competitors are gaining: Optimize your presence on third-party review sites like G2 and Capterra, and increase your engagement in professional communities.
The Future of Marketing Measurement
The transition to a Share of Voice-centric strategy is not just about keeping up with AI; it is about acknowledging that the internet is no longer a simple funnel leading to a website. It is a vast, complex ecosystem of conversations.
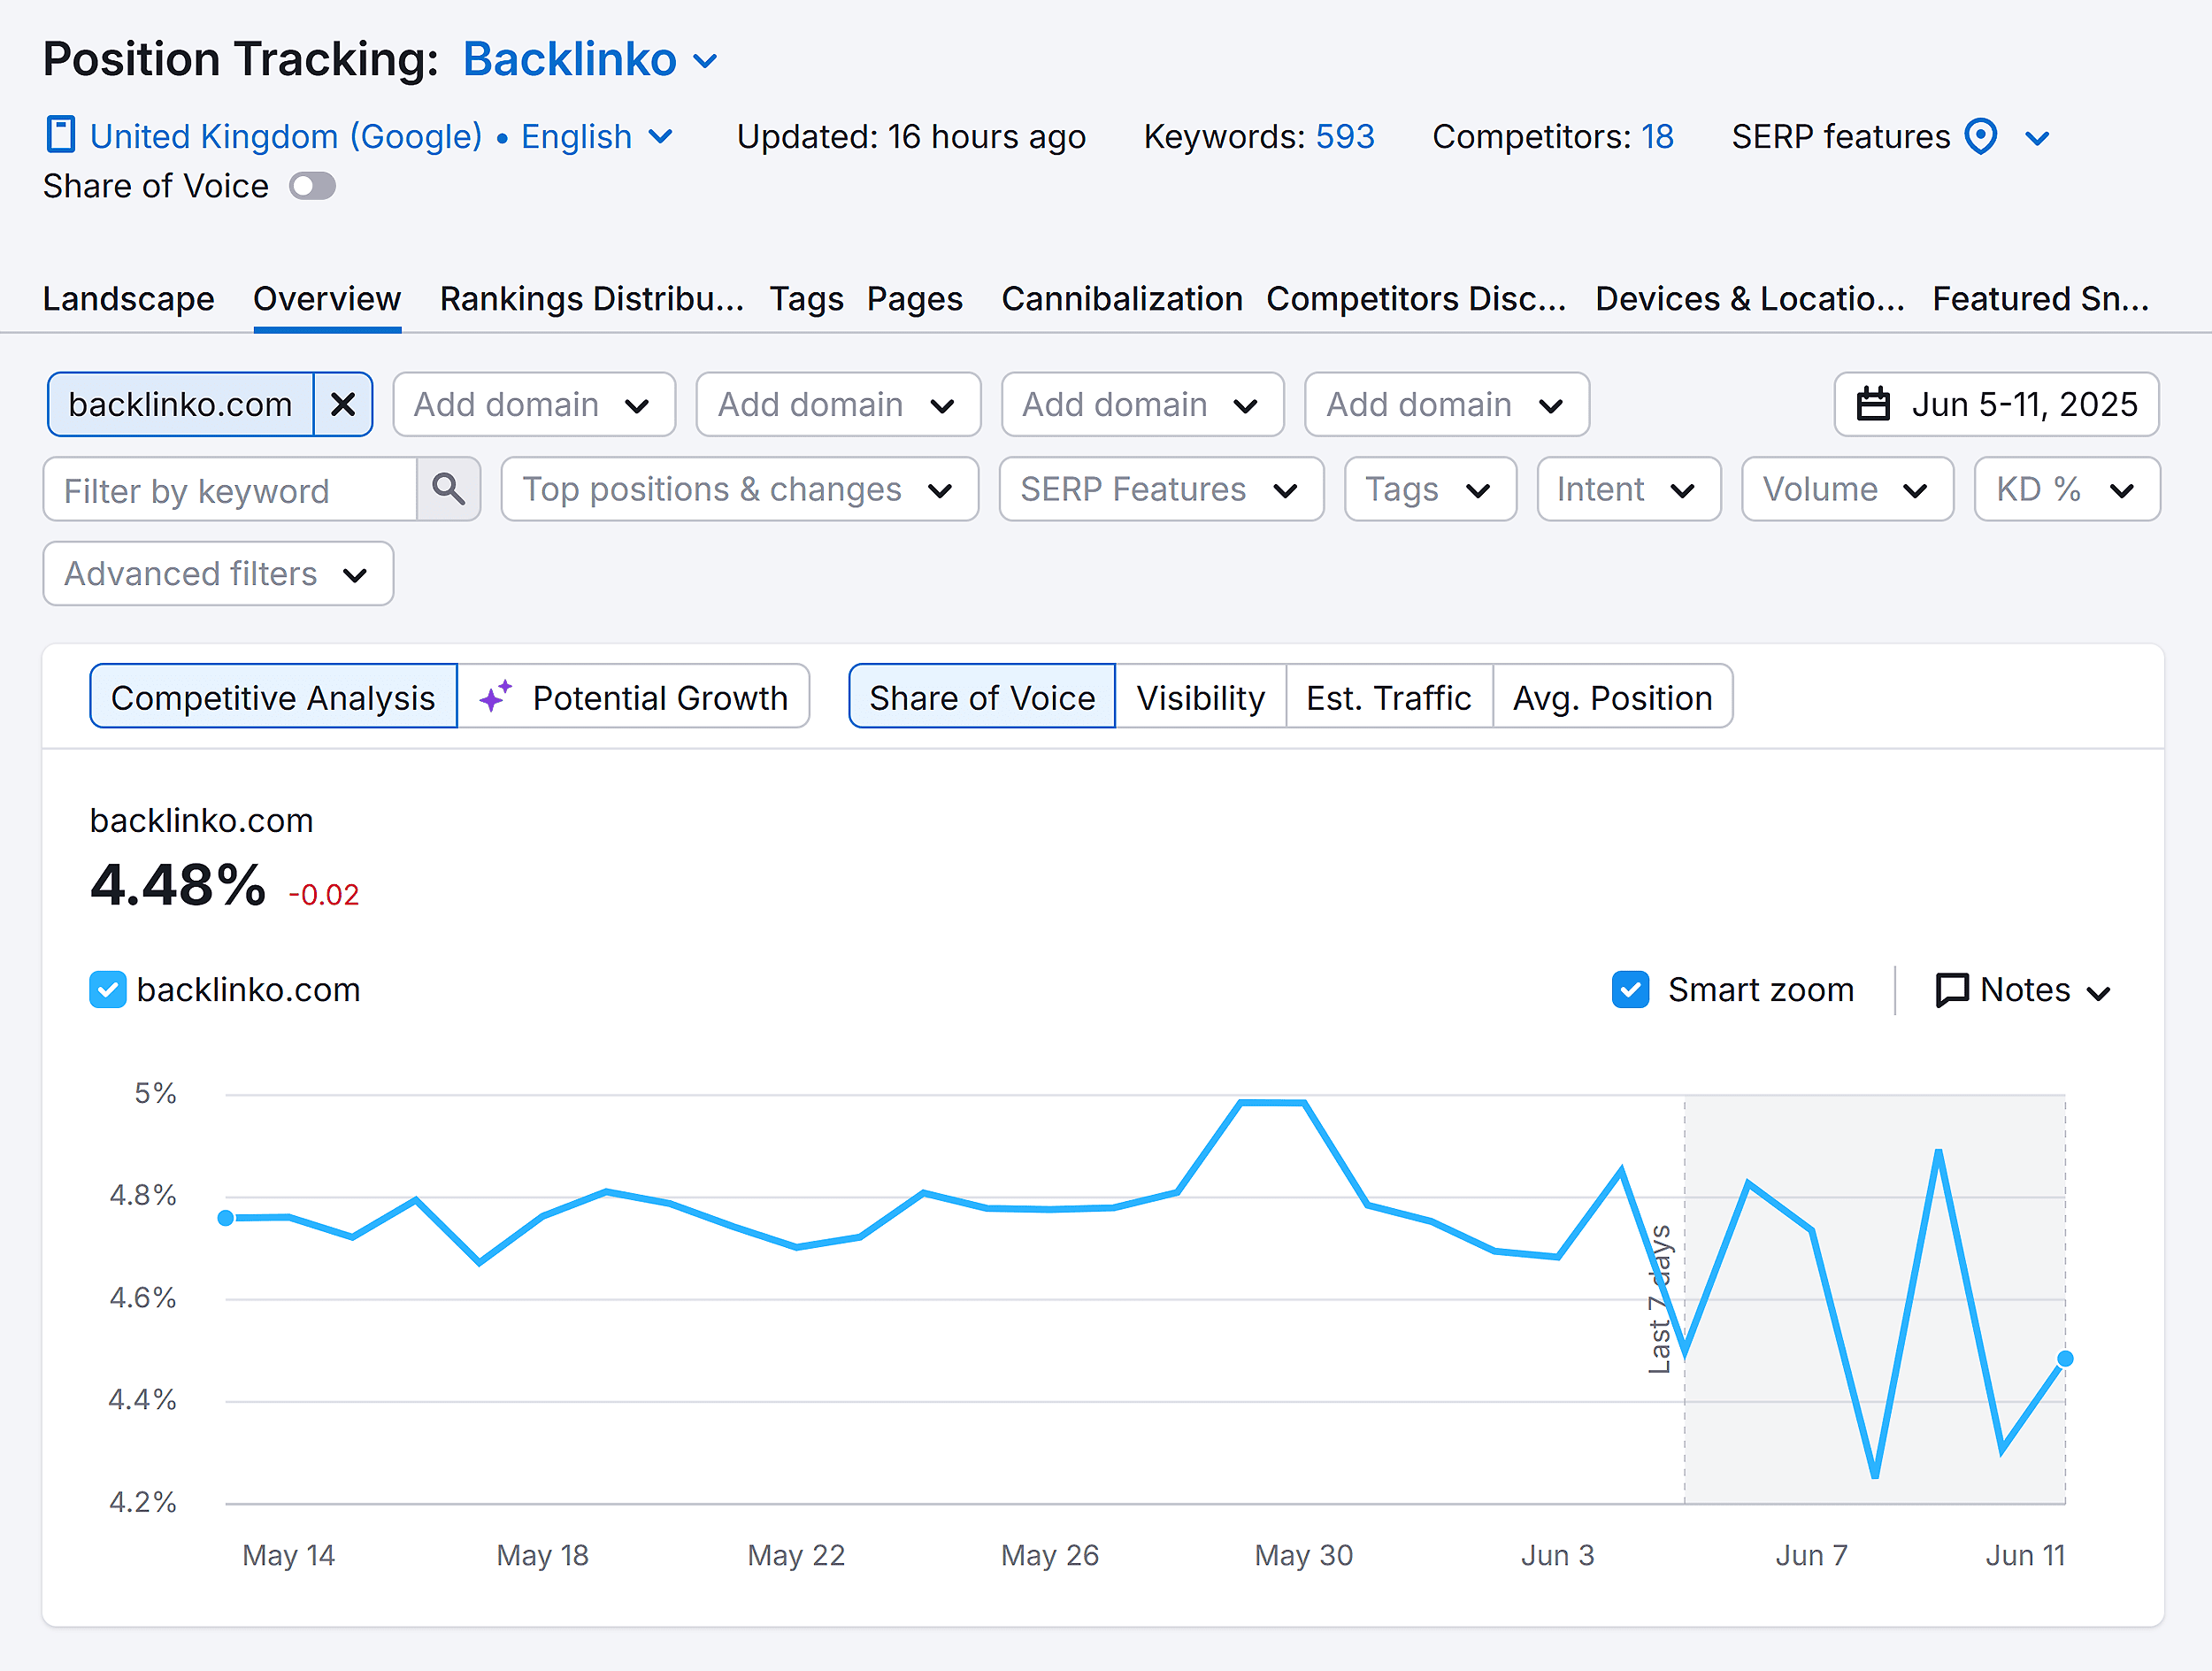
By measuring your Share of Voice, you stop competing for the click and start competing for the market itself. In 2026, that is the only metric that truly matters.

Disclaimer: Backlinko is owned by Semrush. This content was produced by industry experts to provide actionable insights into modern search strategies.