
In the hyper-competitive landscape of digital marketing, the term "good conversion rate" is often treated as a holy grail—a singular, elusive percentage that every marketer chases. However, as the latest data from the Unbounce 2024 Conversion Benchmark Report makes clear, that quest is fundamentally flawed.
Drawing from an expansive dataset of over 57 million conversions, 41,000 unique landing pages, and 464 million pageviews, the findings suggest that a one-size-fits-all approach to conversion rate optimization (CRO) is a recipe for stagnation. To truly understand performance, marketers must move beyond aggregate averages and embrace the nuance of industry-specific benchmarks.

The Myth of the "Average"
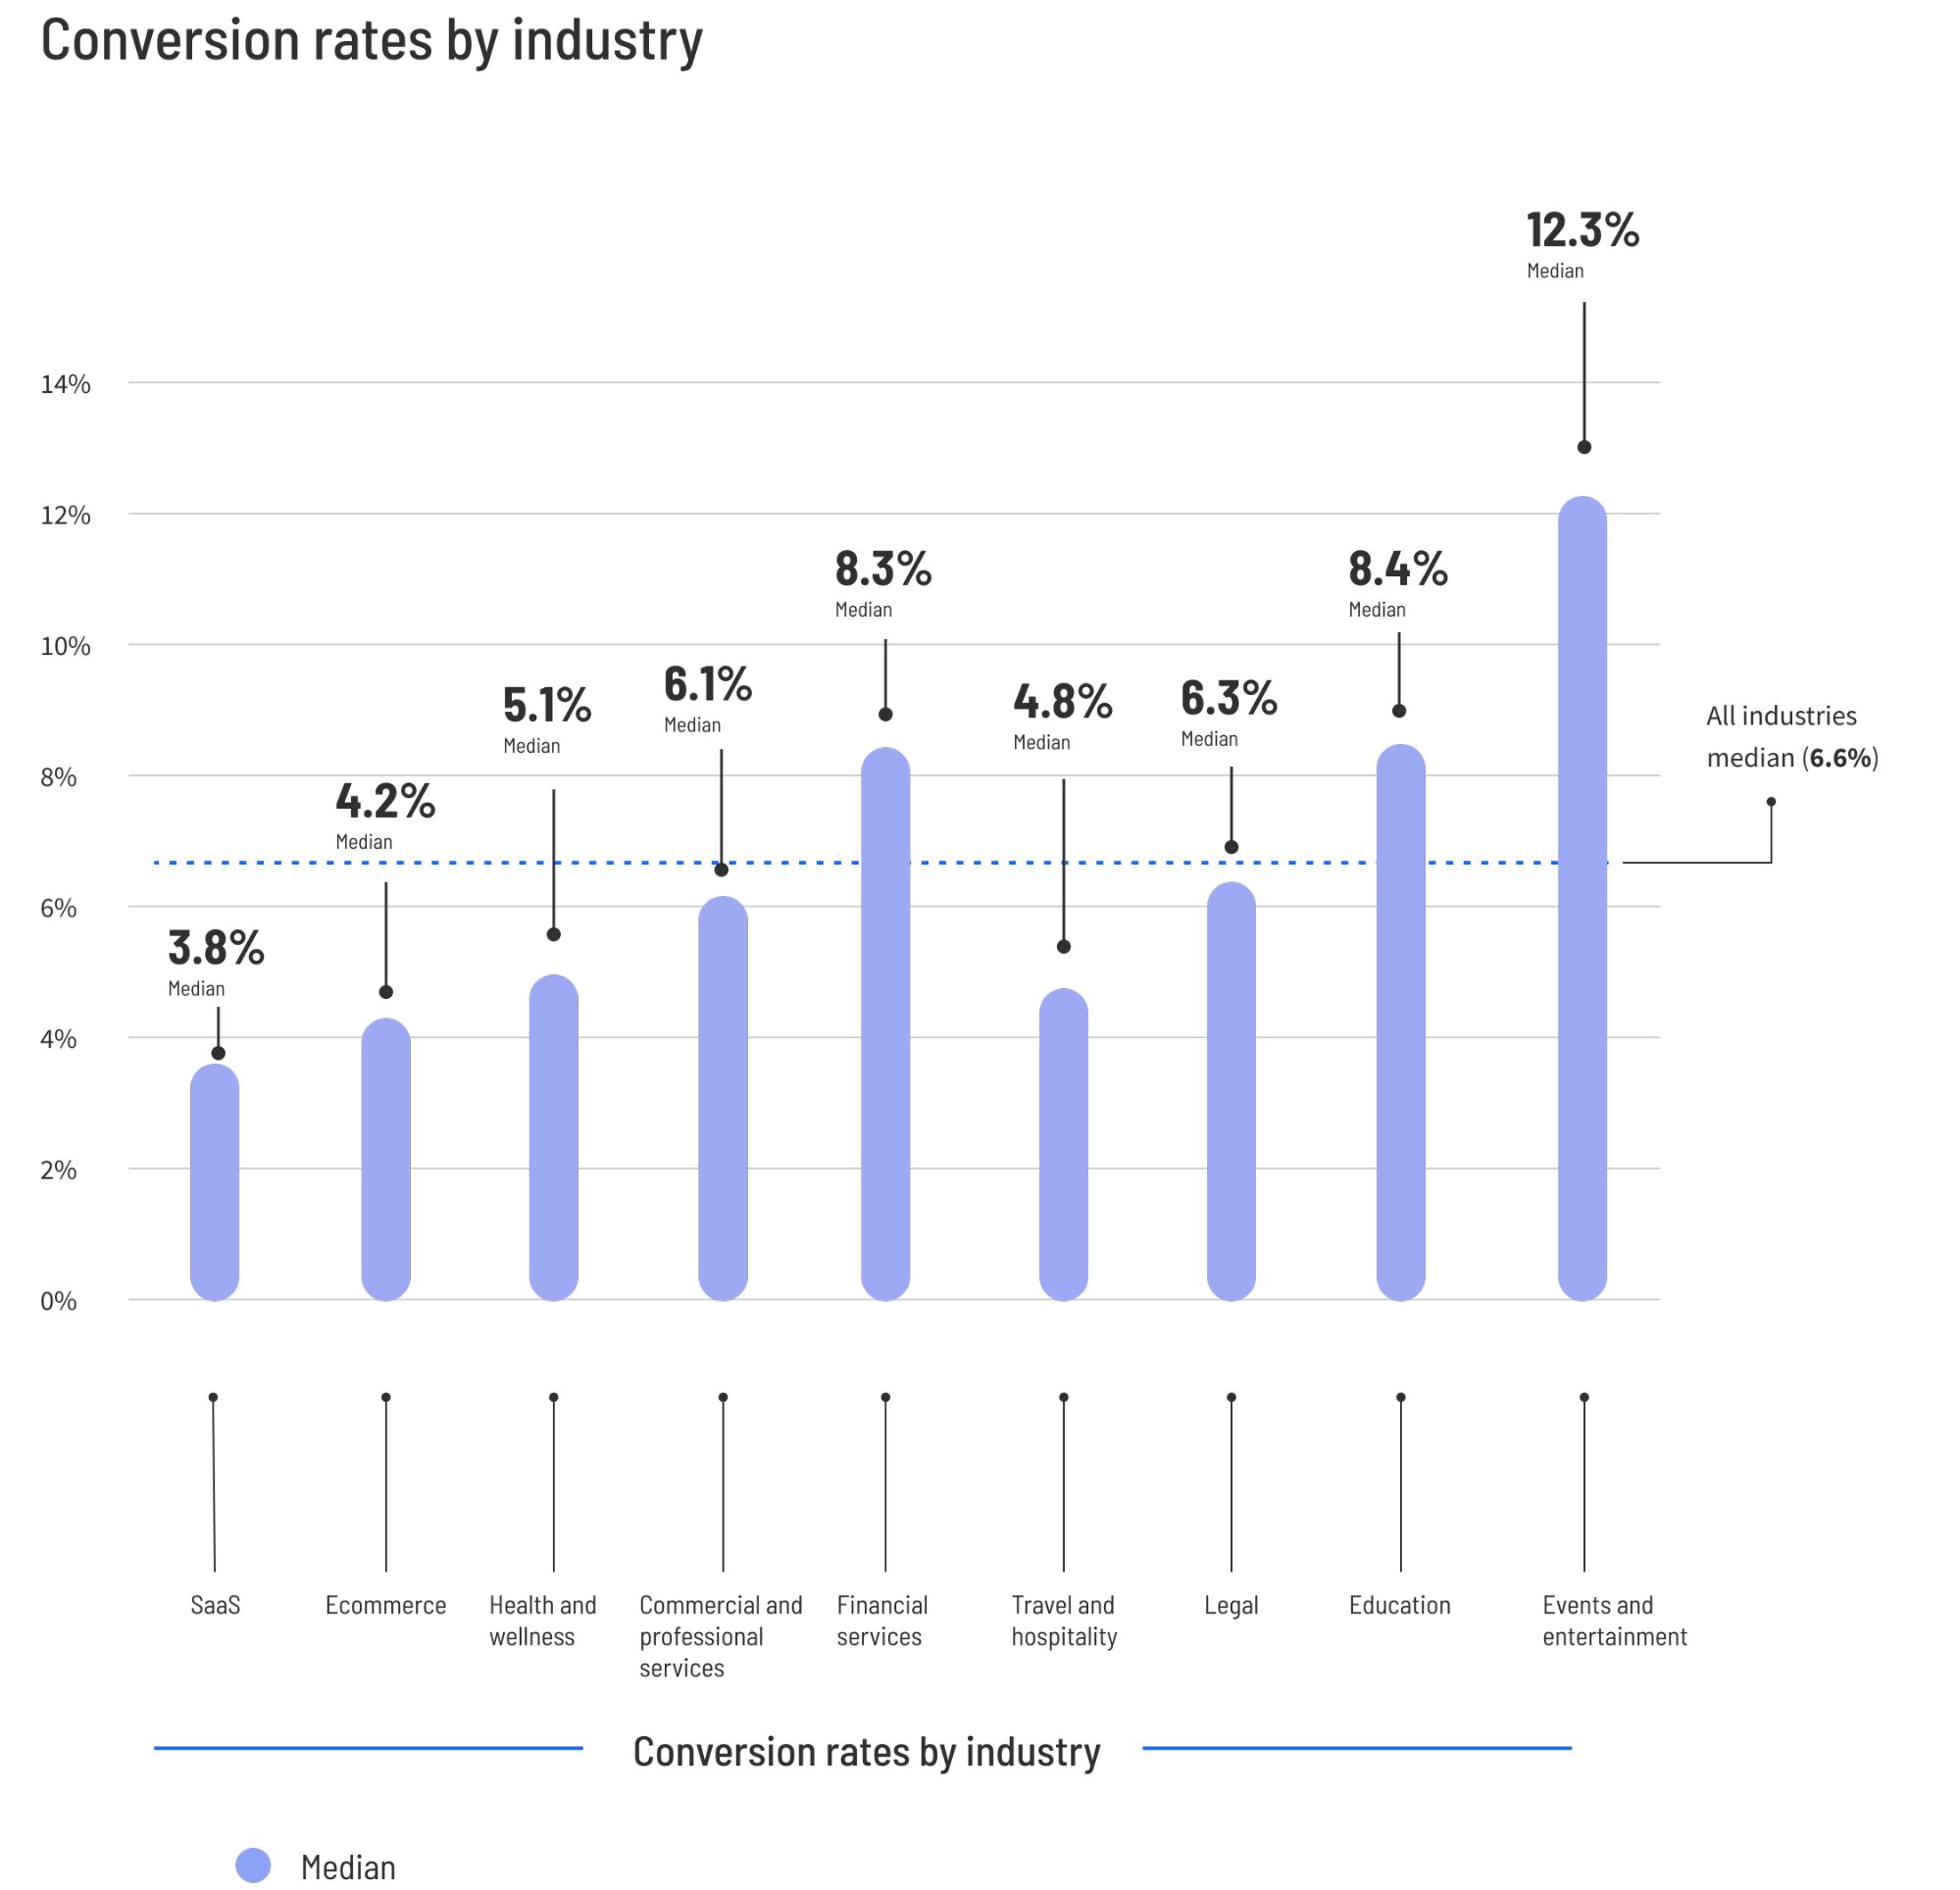
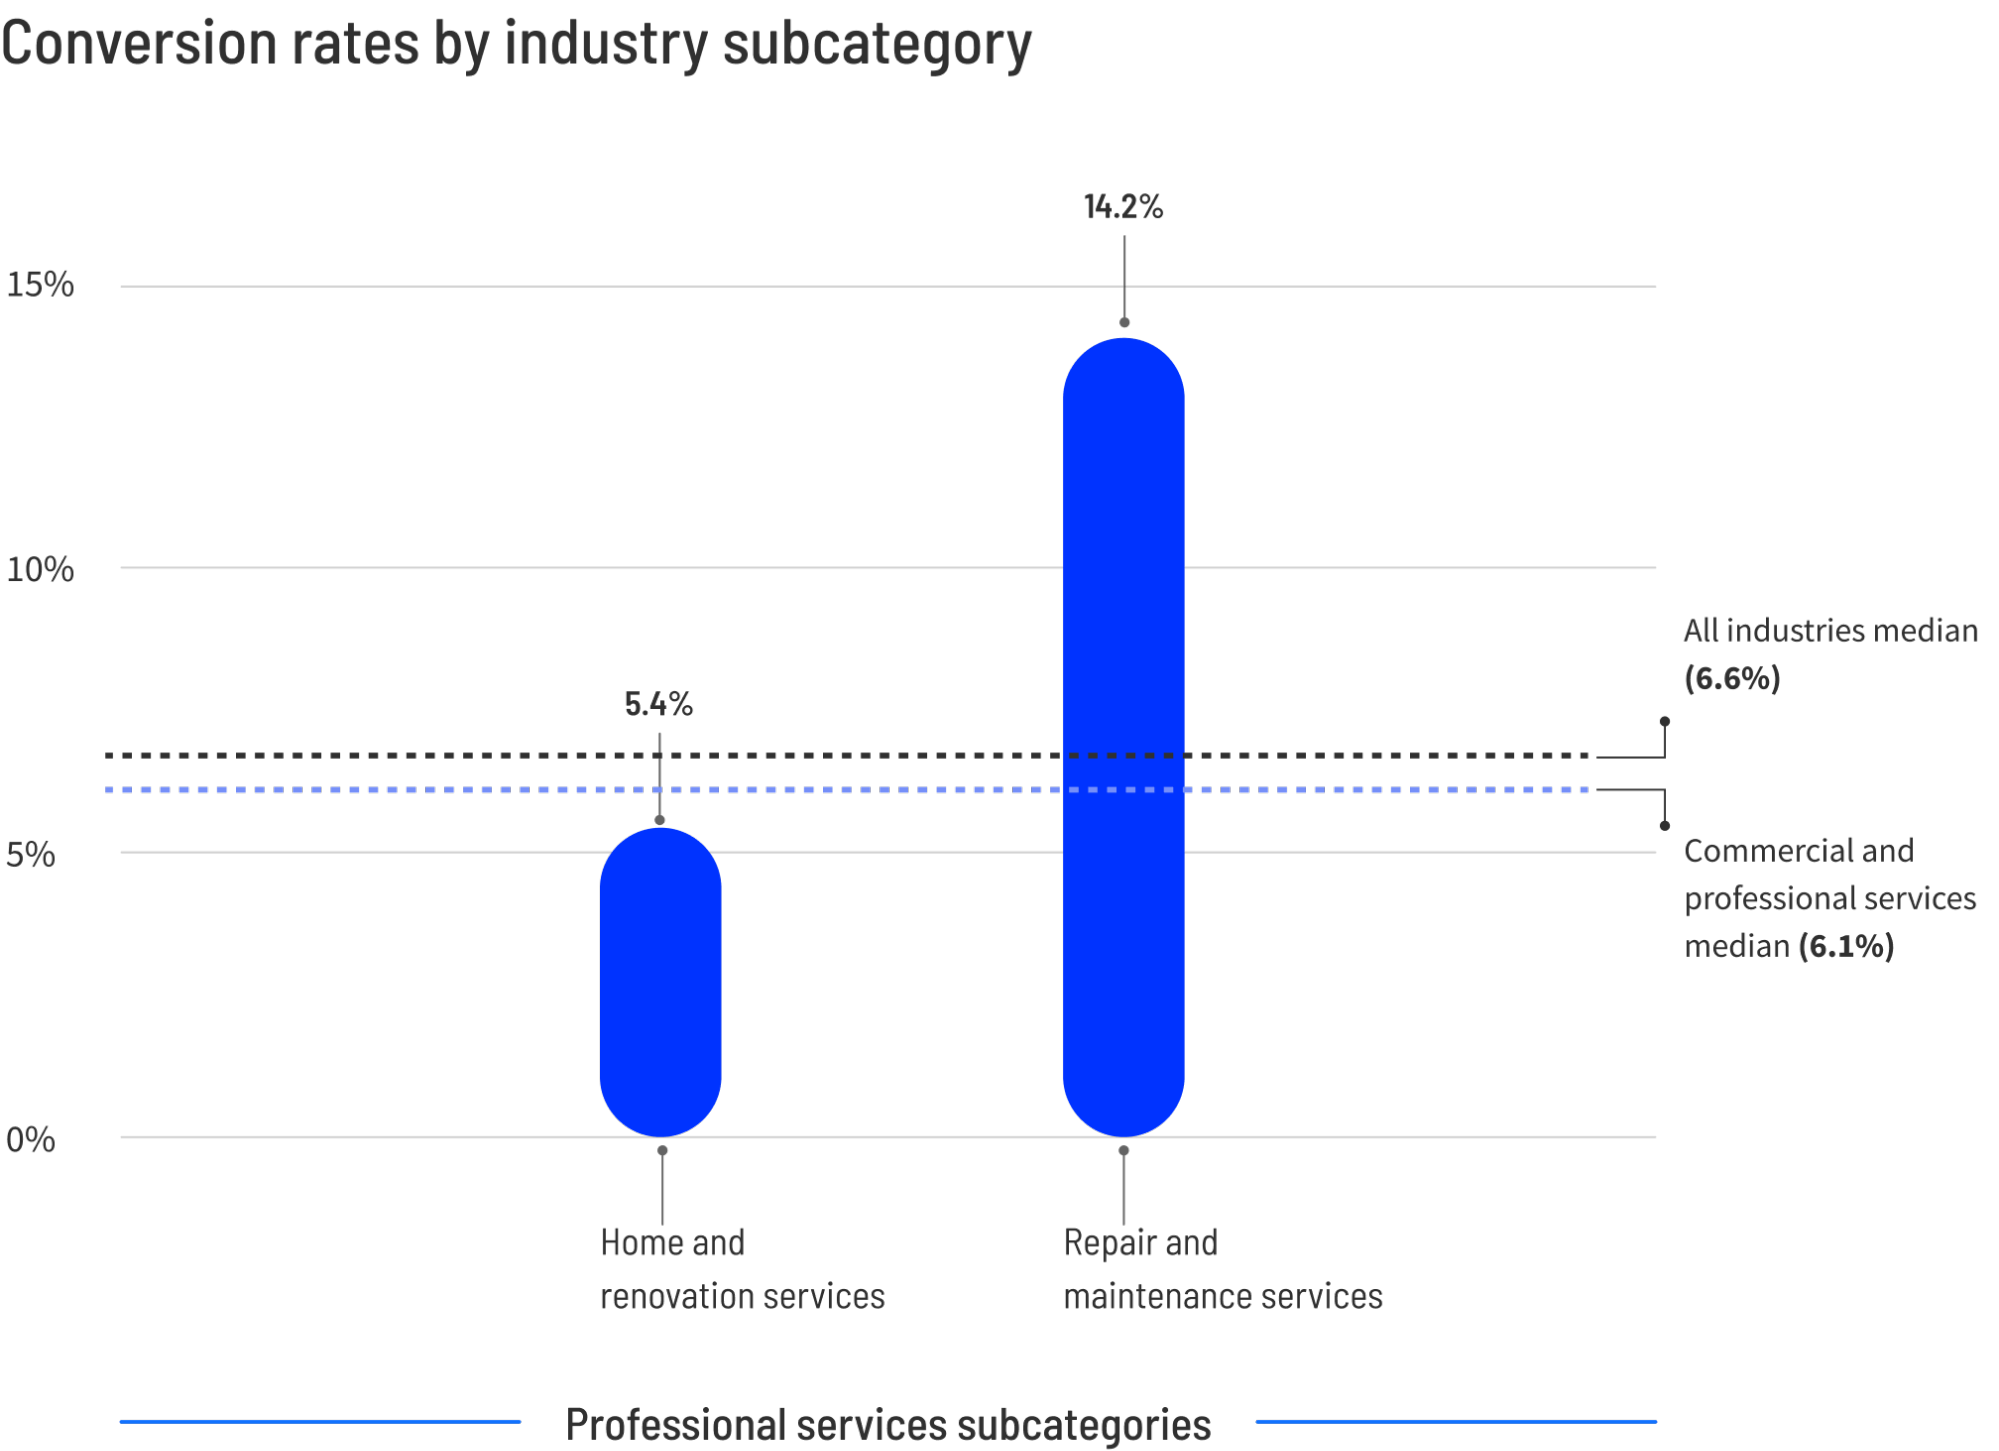
The median conversion rate across all industries currently sits at 6.6%. While this number provides a basic reference point, it is not a target. Using a generic average to measure your success is akin to measuring human health based on the average height of the global population; it provides a statistic, but it offers zero actionable insight into your specific situation.
"A good conversion rate isn’t a static number," explains the report. "It’s a moving target that shifts based on your sector, your audience’s intent, and the specific channel through which they arrived at your page." To be considered a "top performer"—ranking in the top 25% of your industry—you often need to hit conversion rates ranging from 11.4% to upwards of 40%.

Industry-Specific Realities: A Comparative Analysis
To understand why these disparities exist, we must look at the unique pressures facing different sectors.
Ecommerce: The Volume Game
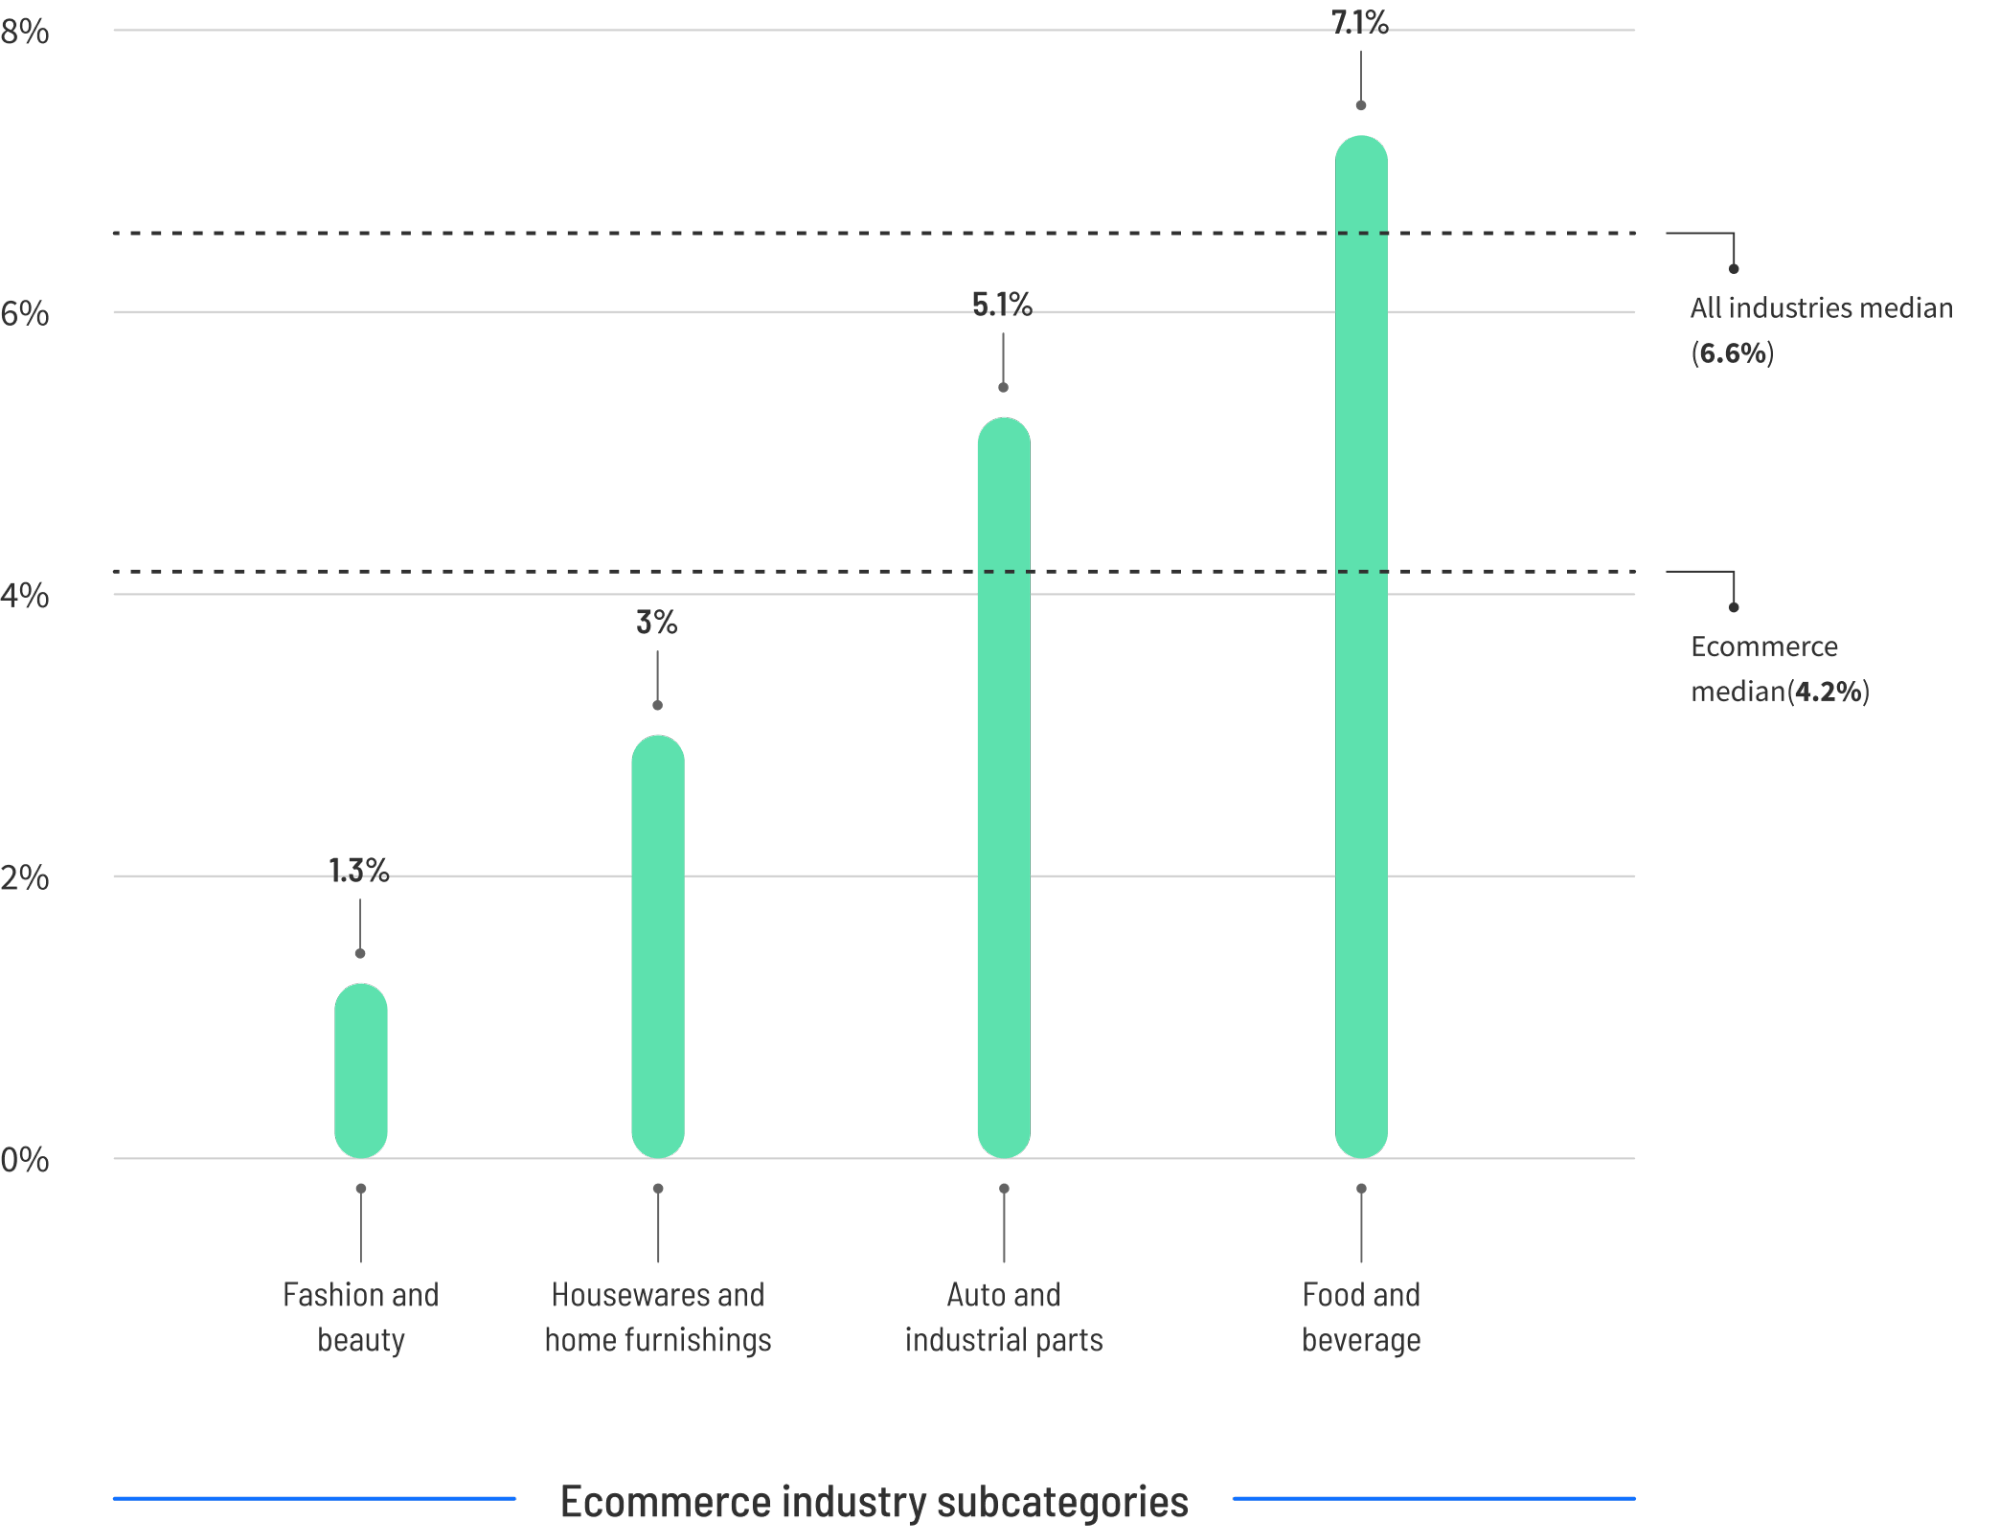
Ecommerce brands operate at a median conversion rate of 4.2%. However, the top 25% of performers in this space are achieving rates of 11.4% or higher—nearly triple the median. This represents a massive revenue opportunity. For a site with 10,000 monthly visitors, that jump from 4.2% to 11.4% could translate to an additional 720 conversions, potentially adding tens of thousands of dollars in monthly revenue depending on the average order value.
SaaS: Navigating Complexity
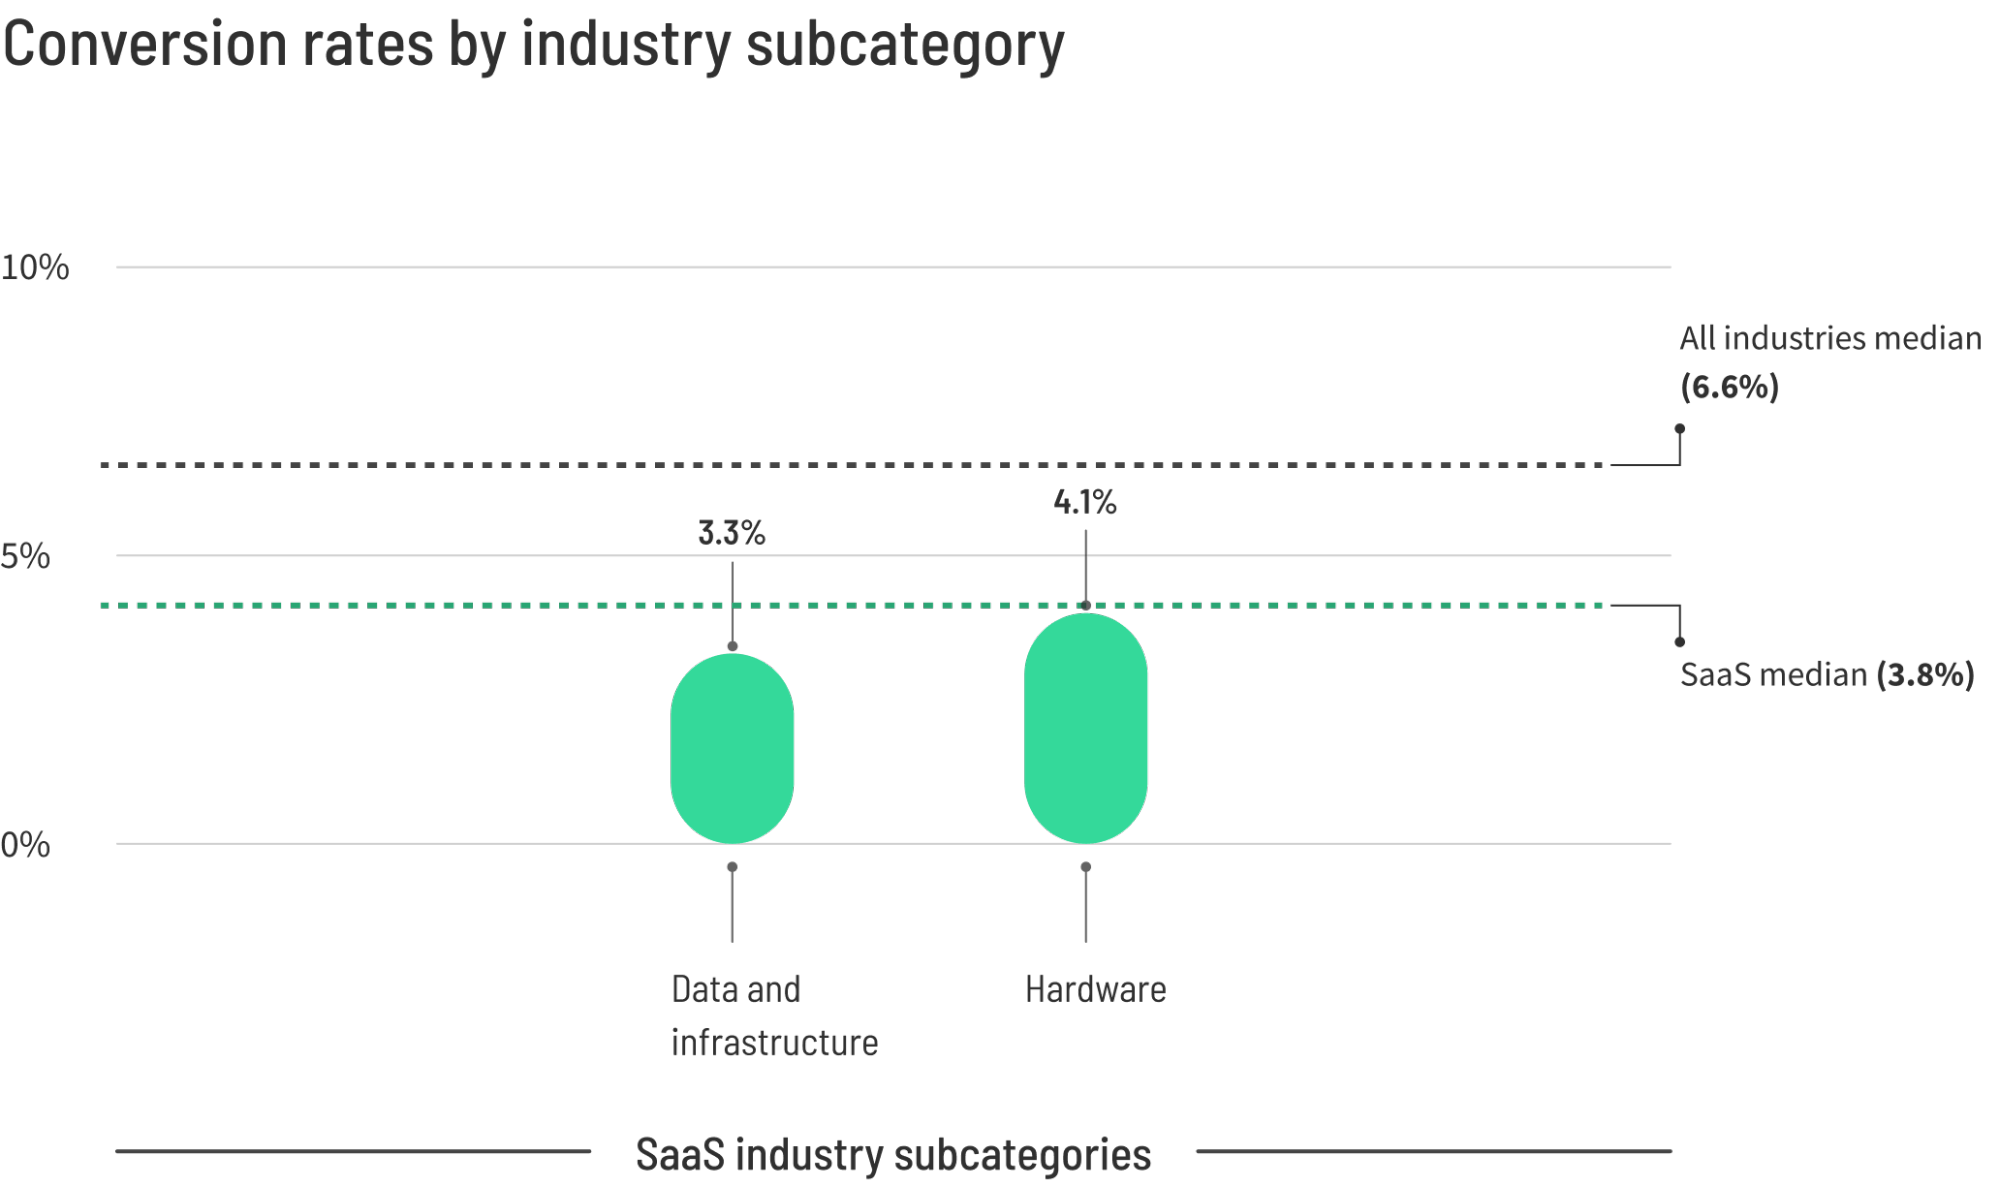
Software-as-a-Service (SaaS) companies face a median conversion rate of 3.8%. This lower baseline reflects the complexity of the products involved and the varying levels of buyer intent. A user clicking on a SaaS ad may be a high-intent buyer ready for a trial, or a top-of-funnel researcher just gathering information. The high-performers here—those hitting 11.6%—are those that have mastered the art of reducing friction through "no-credit-card-required" trials and highly targeted value propositions.
Financial Services: High-Intent, High-Stakes
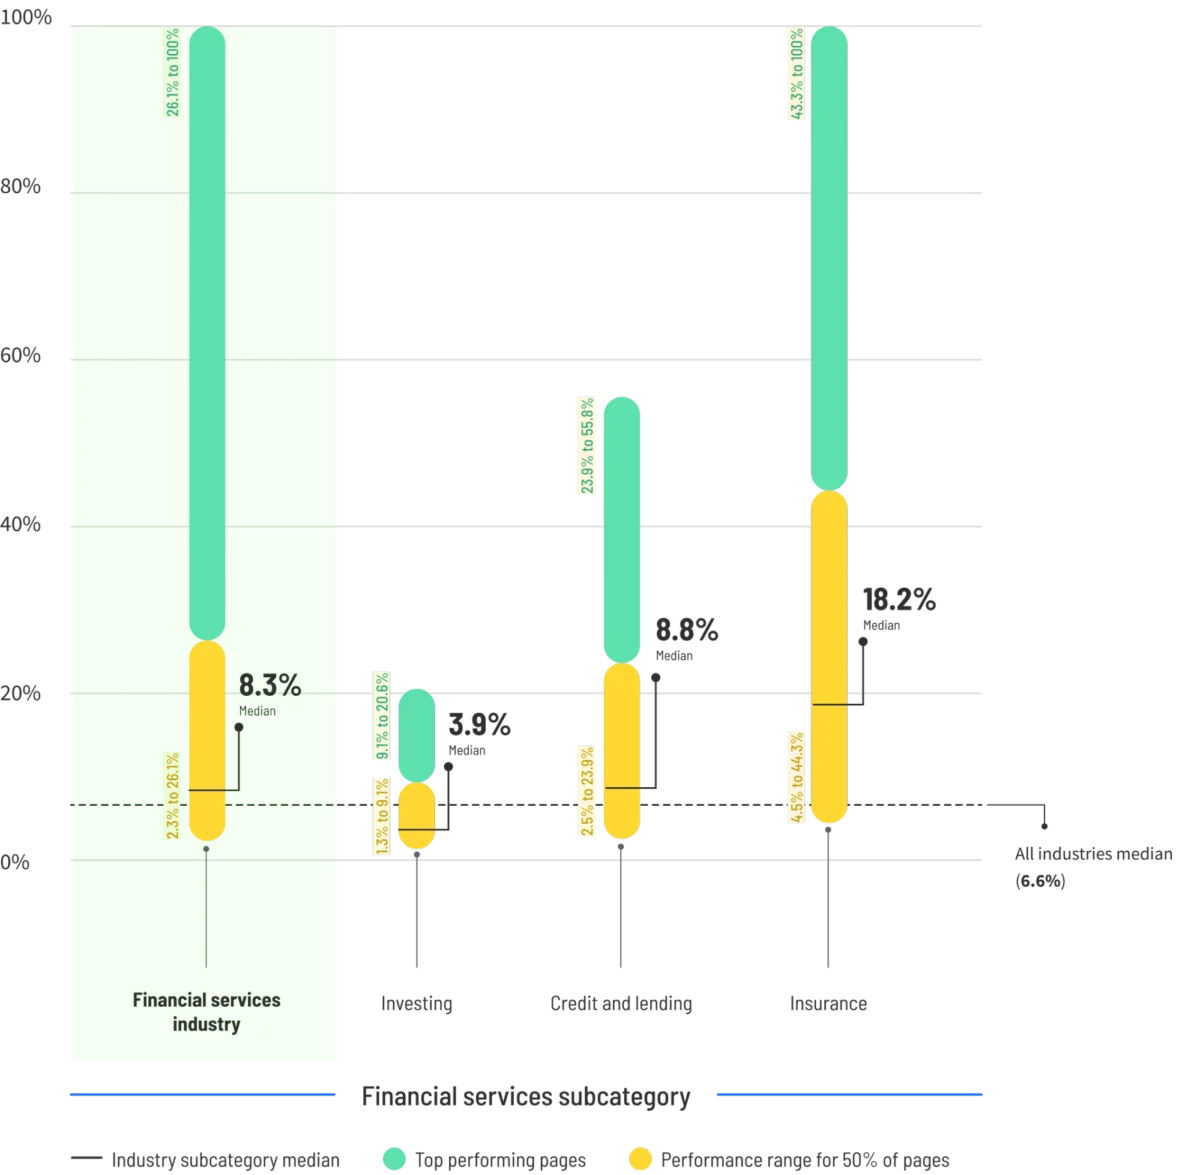
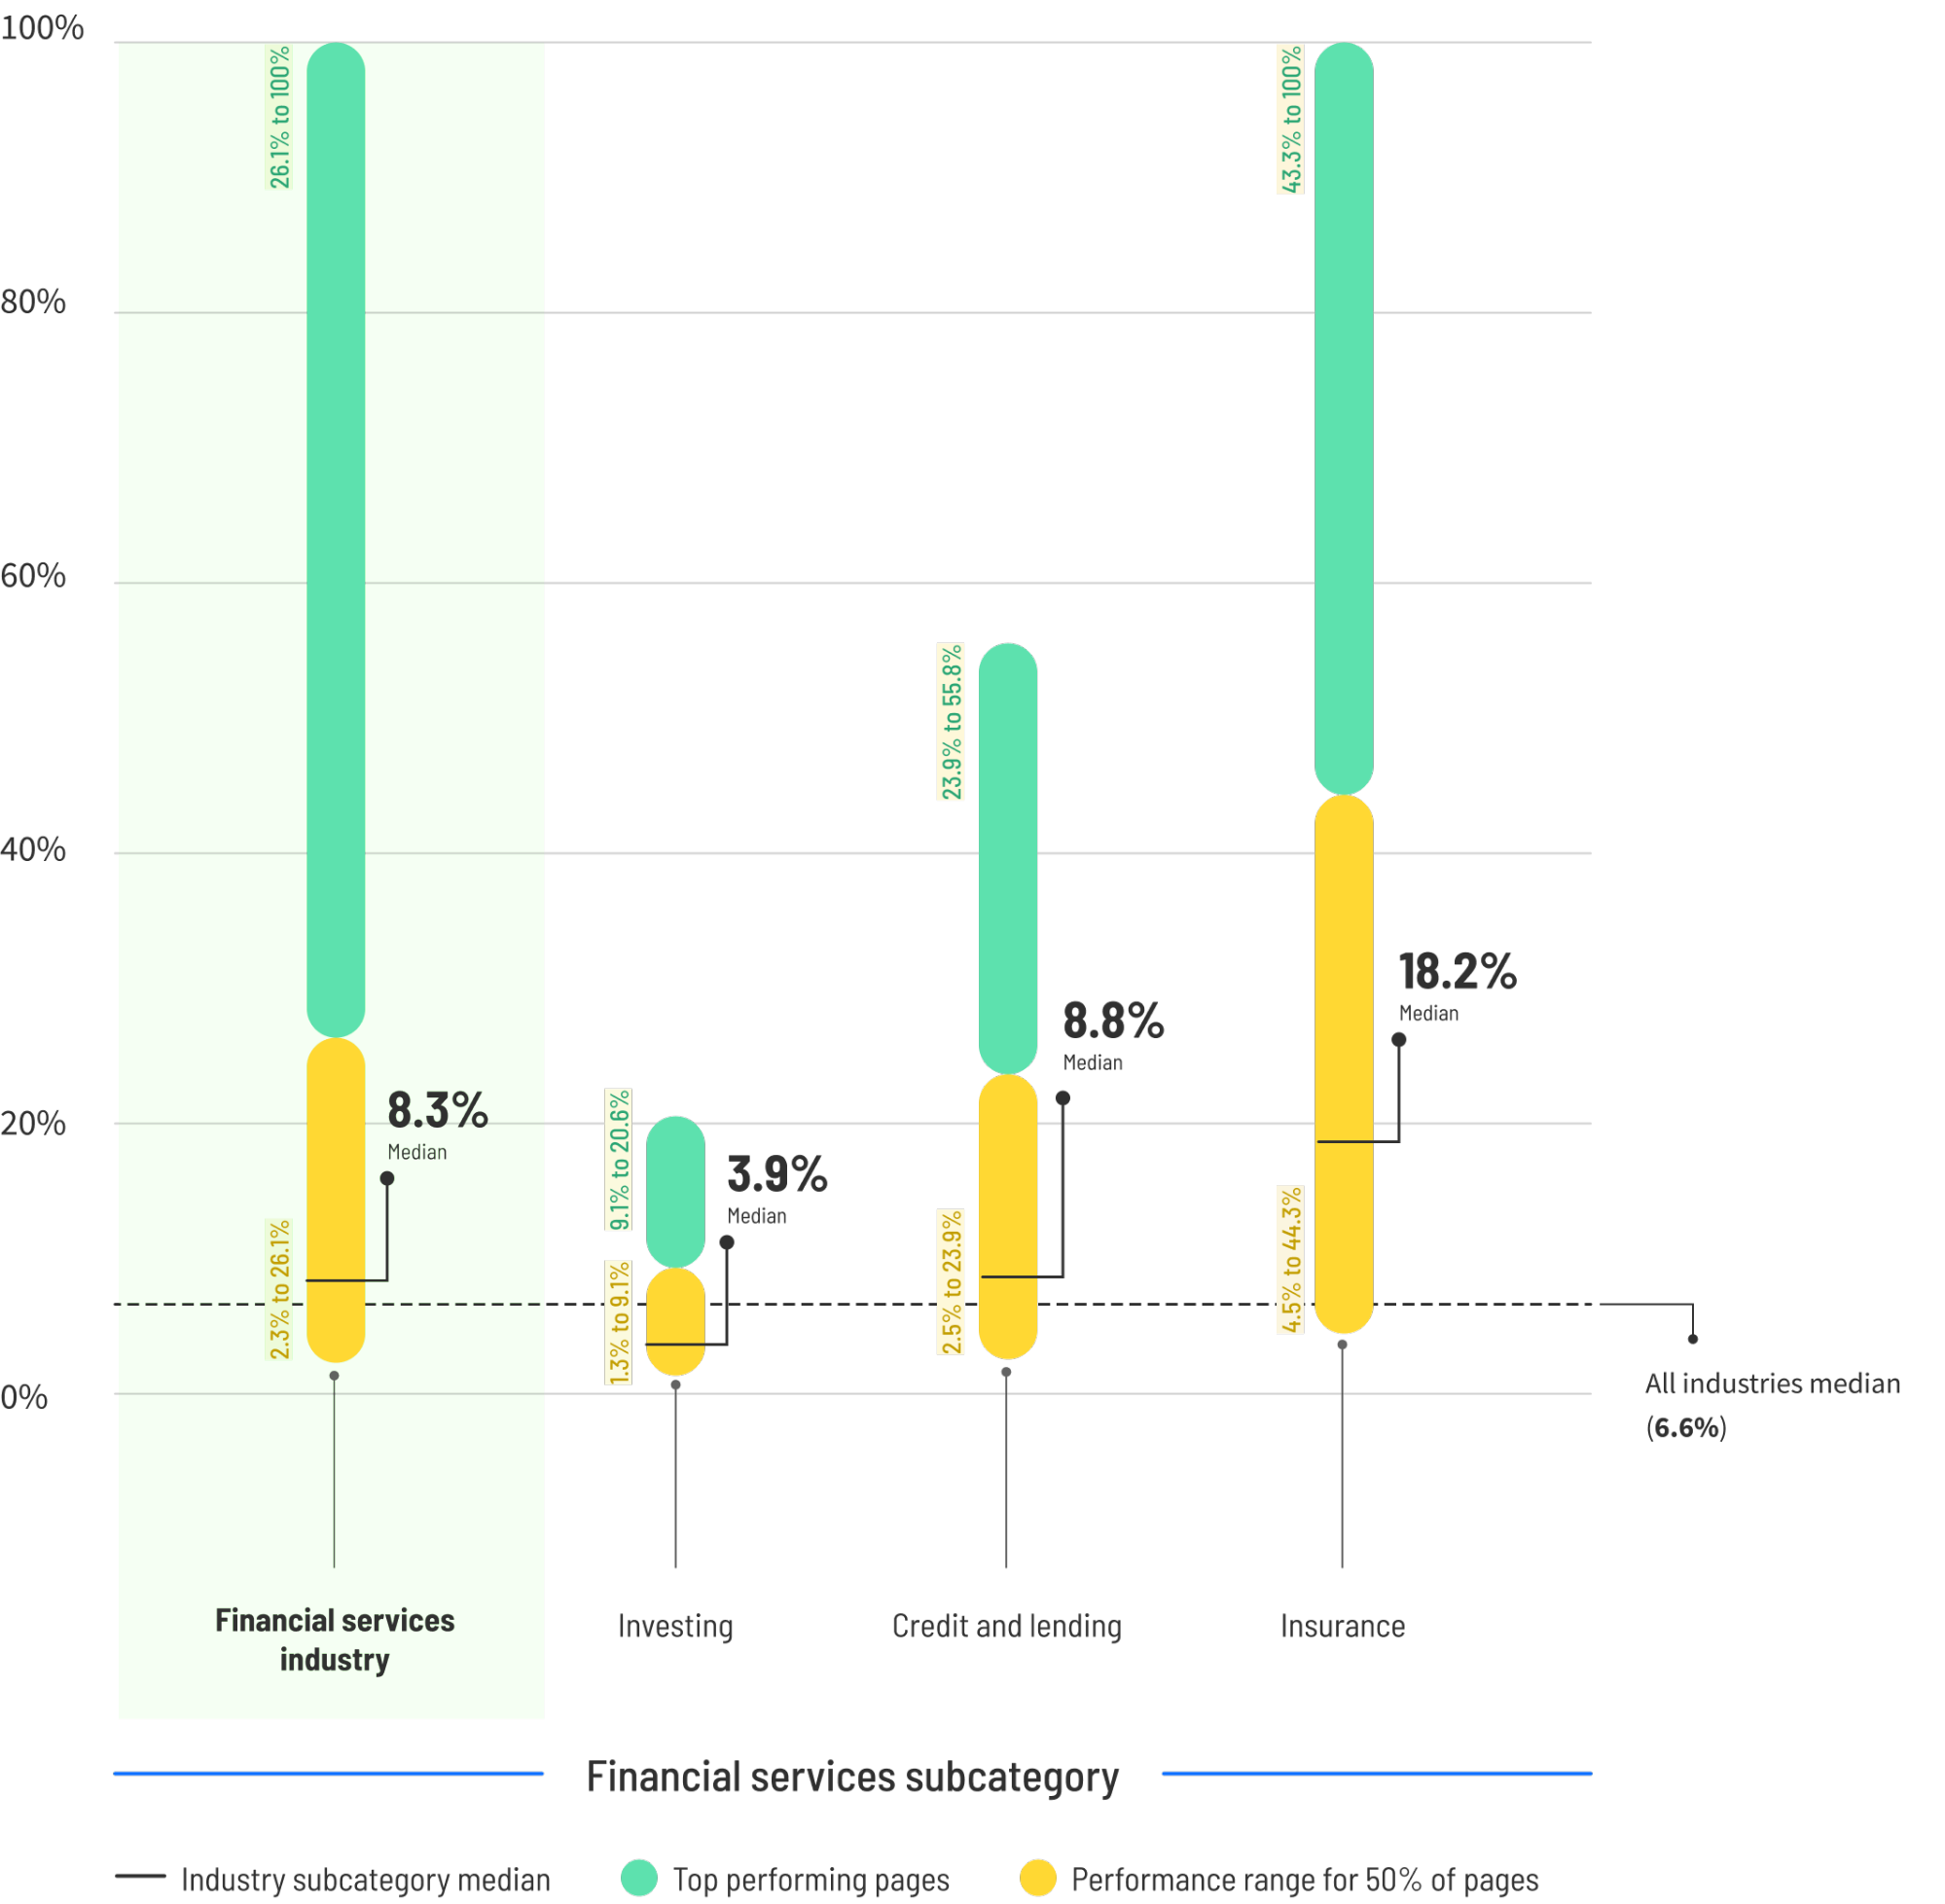
Financial services buck the trend with a median conversion rate of 8.3%. Because financial decisions—such as choosing insurance or an investment vehicle—are high-stakes and high-intent, users are more likely to commit once they land on a page that addresses their specific financial needs. Notably, mobile traffic in this sector converts 27.8% better than desktop, a direct reversal of the trend seen in most other industries.
Legal: The Urgency Factor
Legal services present a unique behavioral case study. With a median conversion rate of 6.3%, the top performers reach 13.1% or higher. Interestingly, legal pages see higher conversion rates on mobile (21%) than on desktop (15.9%). This is largely attributed to the "frantic search" phenomenon: someone needing a lawyer after an accident or a legal citation is often on their phone, looking for immediate help, and they are likely to convert on the first credible link they find.
The Data Behind the Differences: Median vs. Average
One of the most critical aspects of the Unbounce report is its reliance on median values rather than arithmetic averages. If you put a billionaire in a room with ten teachers, the "average" income is millions, but the "median" reflects the teacher’s salary.
In marketing data, extreme outliers—like a single landing page with a 90% conversion rate or one that struggles at 0.001%—can skew the average to the point of uselessness. By focusing on the median, the report provides a realistic middle-of-the-pack baseline that allows marketers to benchmark their actual performance against their true peers.
Strategic Implications: How to Move the Needle
If benchmarks tell you where you stand, the next logical question is how to progress. Data-backed evidence points to five key areas where optimization efforts yield the highest returns.
1. The Power of Simple Language
Sophistication in copy is often mistaken for authority, but the data tells a different story. Content written at a 5th-to-7th-grade reading level converts at 11.1%—a 56% improvement over content written for an 8th-to-9th-grade level. By removing jargon and adopting conversational, accessible language, brands can significantly lower the cognitive load on their visitors.
2. Strategic Social Proof
Trust is the currency of the internet. Placing testimonials, review counts, or client logos directly adjacent to the call-to-action (CTA) is far more effective than burying them in a footer where they remain unseen.
3. Mobile-First Optimization
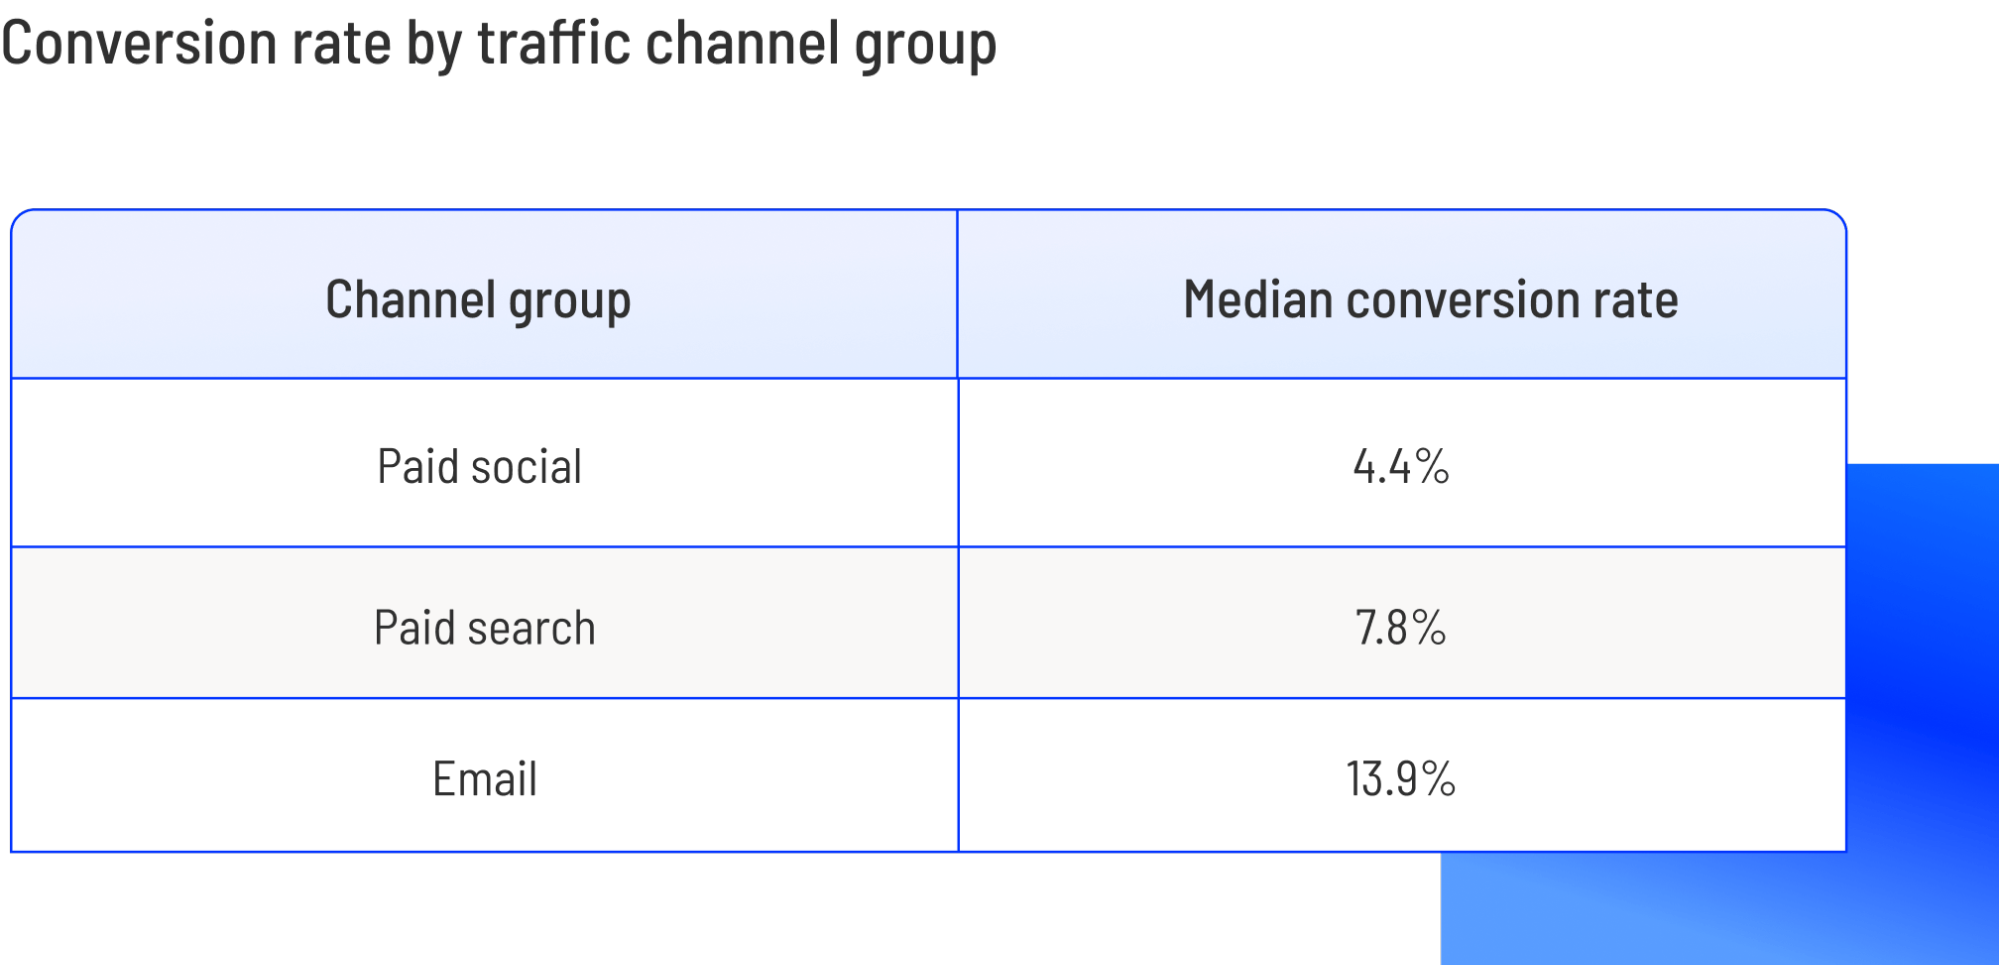
With mobile accounting for 83% of landing page traffic, it is no longer optional to have a "decent" mobile experience. It must be seamless. If your mobile conversion rate is lagging, it is likely due to slow load times or overly complex forms that are difficult to navigate on small screens.
4. Eliminating Friction
Every element on a page that is not the primary CTA is a potential exit route. Navigation menus, social media buttons, and external links are "distractions" that pull the user away from the conversion goal. High-performing pages are often minimalist, stripping away anything that doesn’t serve the specific purpose of the visitor.
5. Systematic Testing
The most successful marketers treat conversion optimization as an ongoing, iterative process rather than a one-time project. By utilizing A/B testing for button colors, headline variations, and form lengths, companies can gather empirical evidence on what resonates with their specific audience.
Conclusion: The Path to Excellence
The gap between the "average" and the "top-performing" 25% represents the most significant growth opportunity for businesses in 2025. This gap is rarely closed by luck or by chasing arbitrary industry trends. Instead, it is bridged by companies that are systematic in their approach: they understand their audience’s intent, they optimize for the specific devices their users prefer, and they continuously test their assumptions.
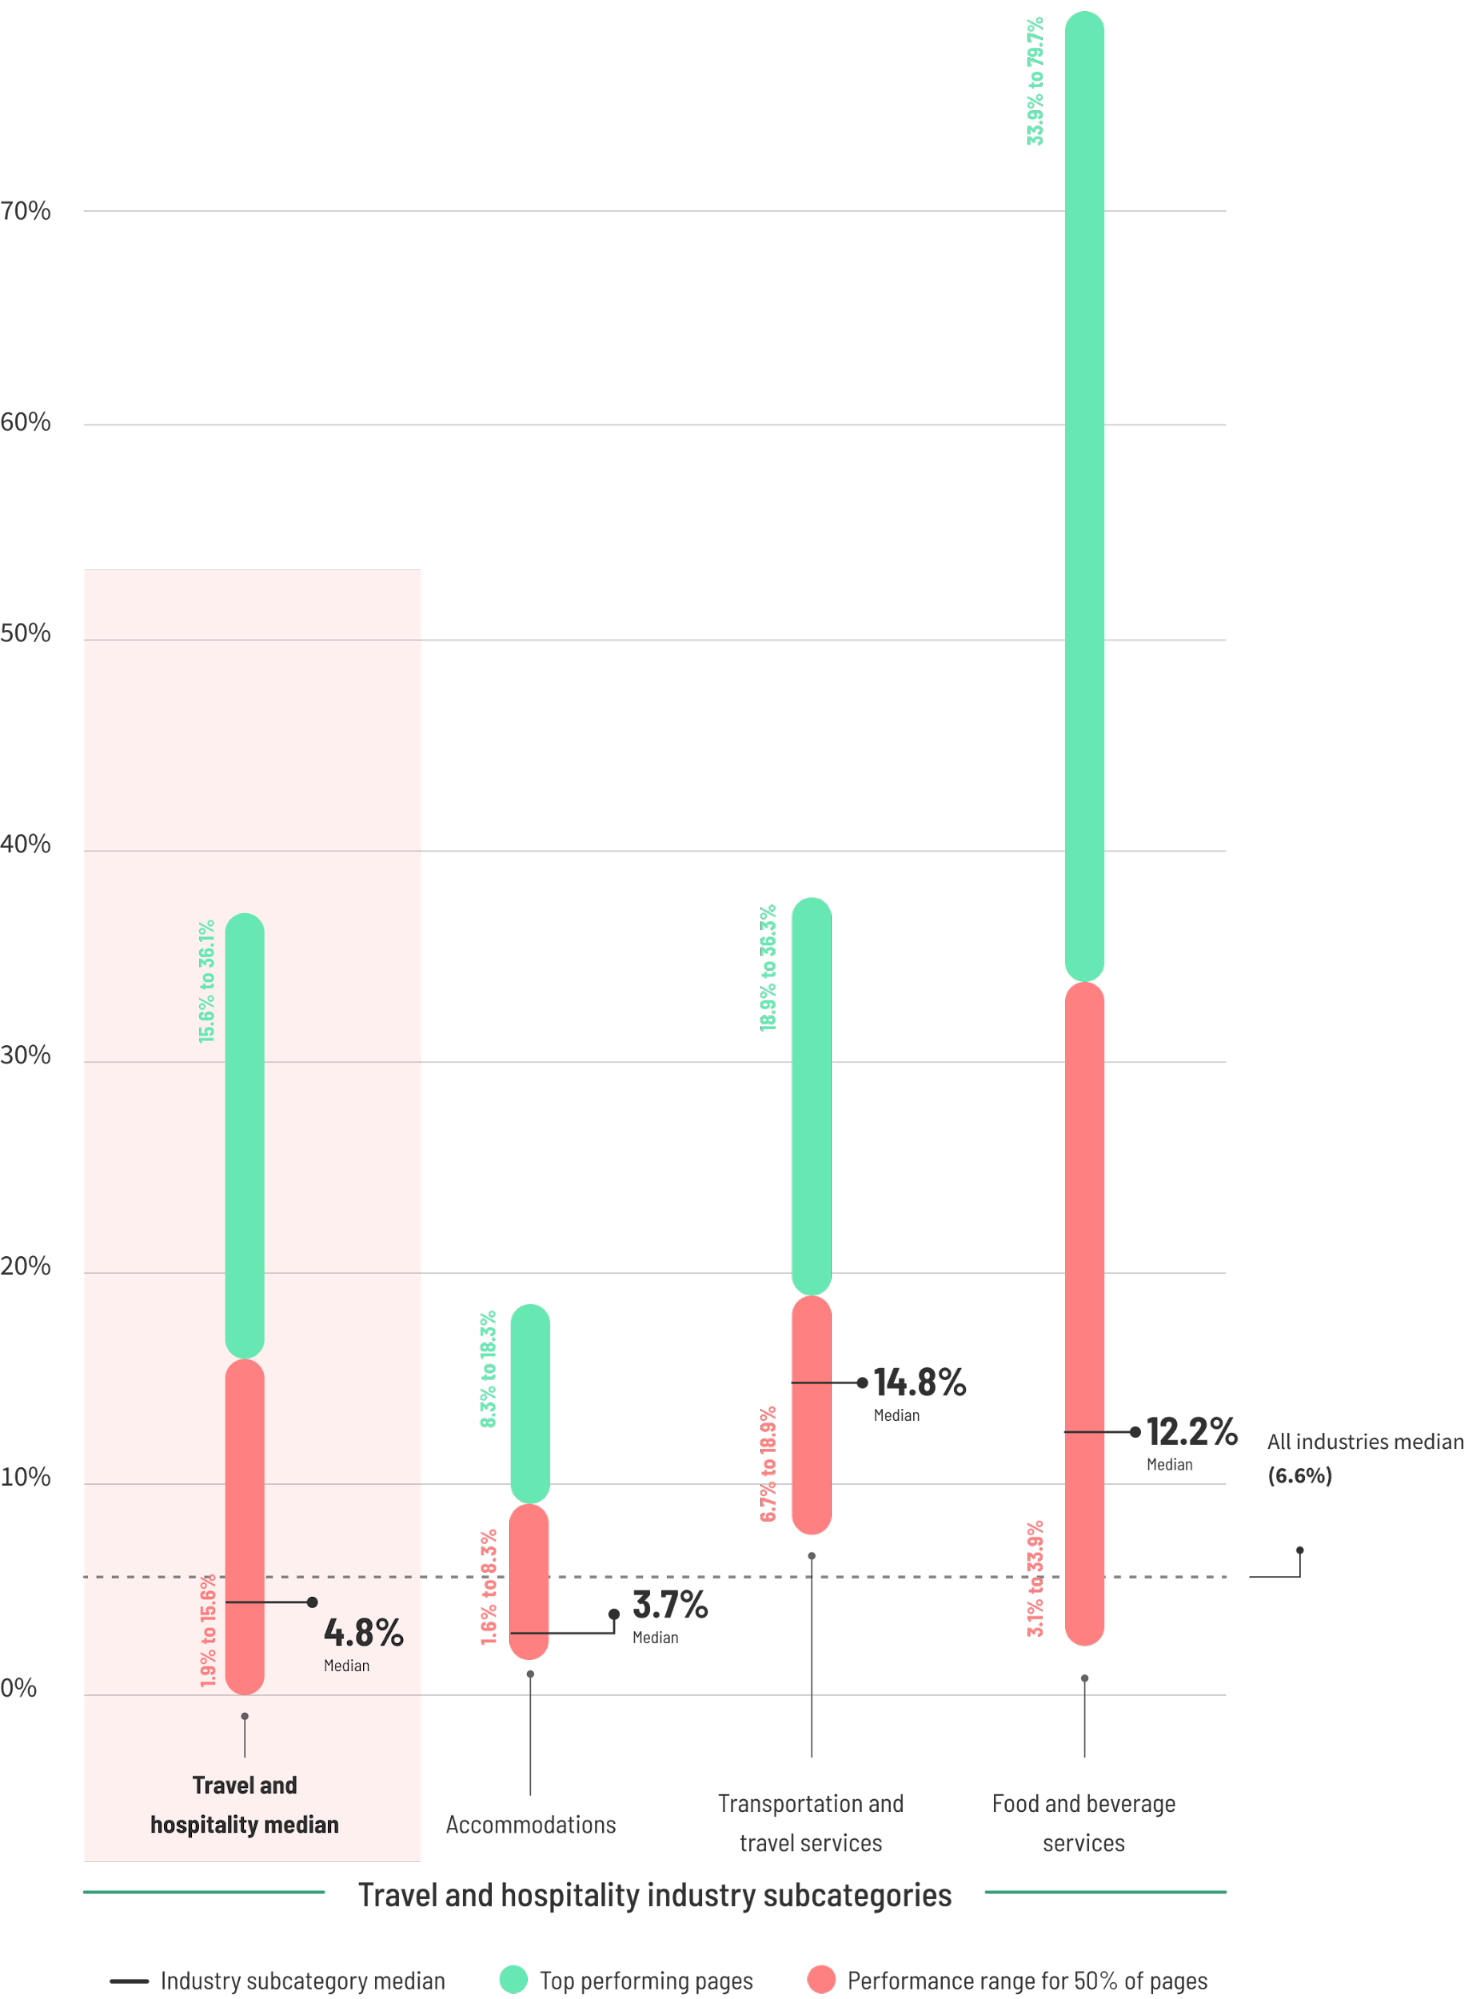
As the industry moves forward, the focus must shift from chasing the "average" to mastering the fundamentals of clarity, speed, and trust. The data confirms that while the baseline is fixed, the potential for growth is entirely within the control of the marketer. Whether you are a small ecommerce shop or a large-scale SaaS enterprise, the path to outperforming your competition starts with one constant: testing, refining, and never settling for "good enough."