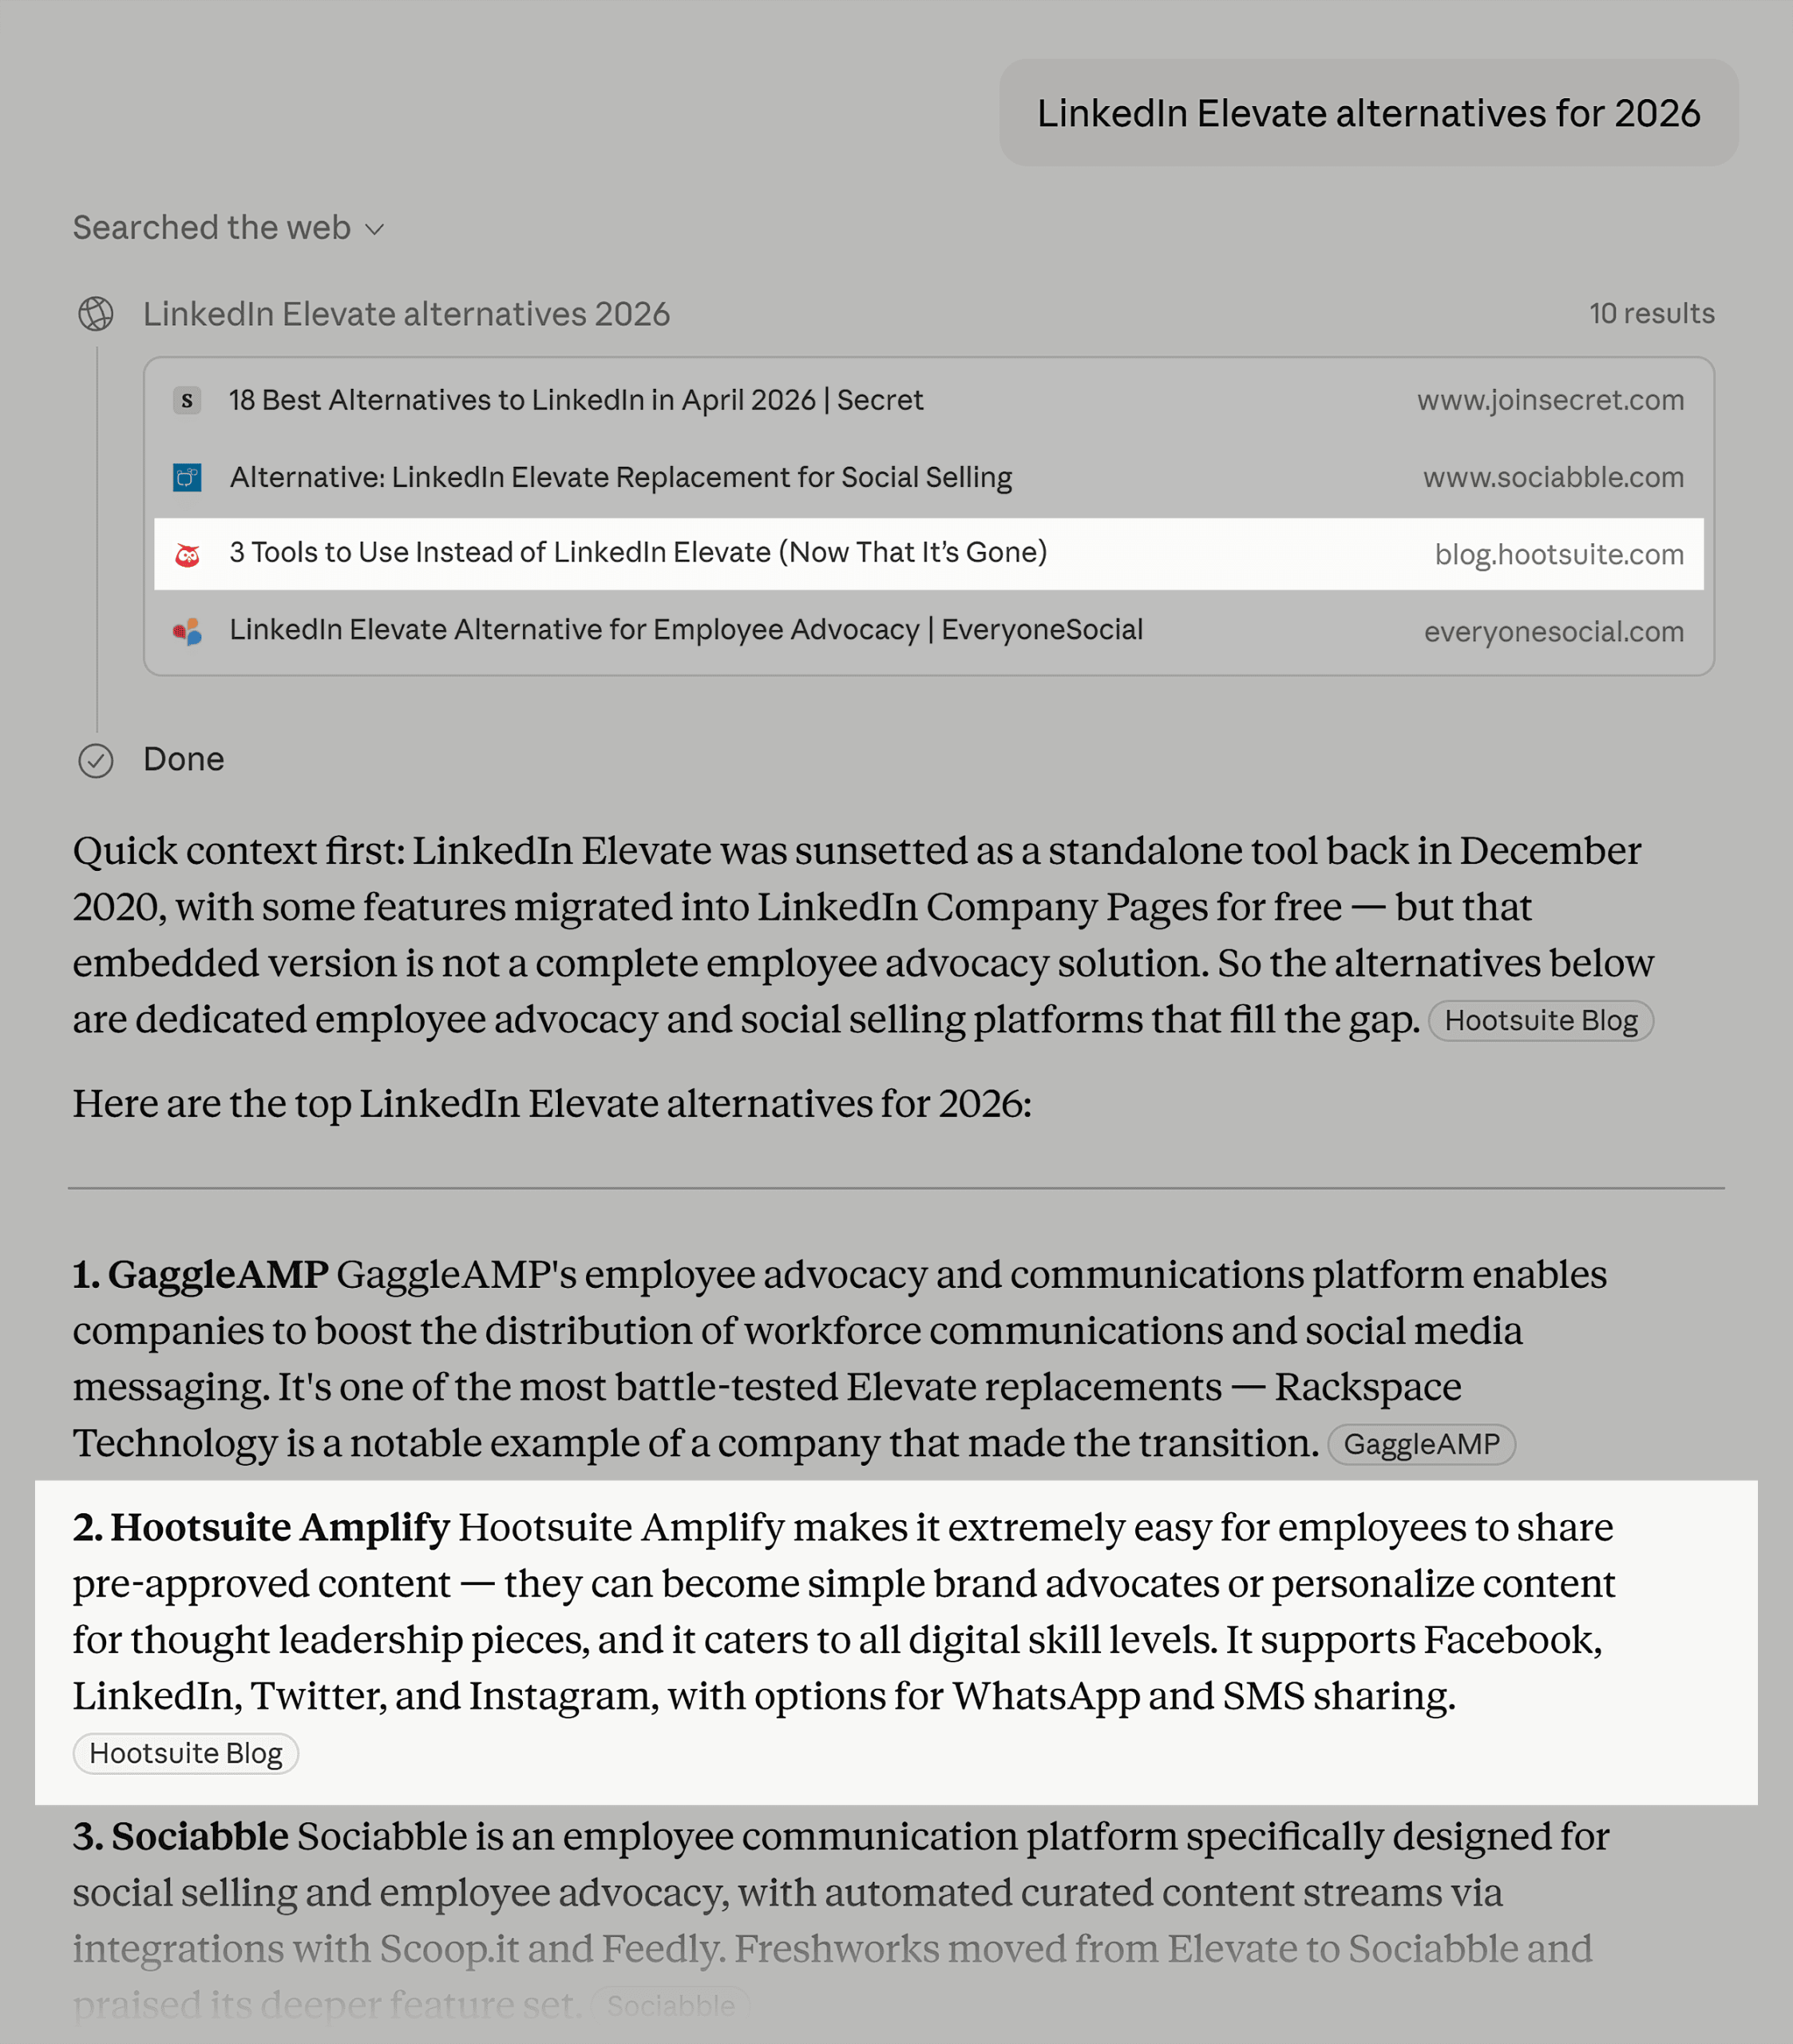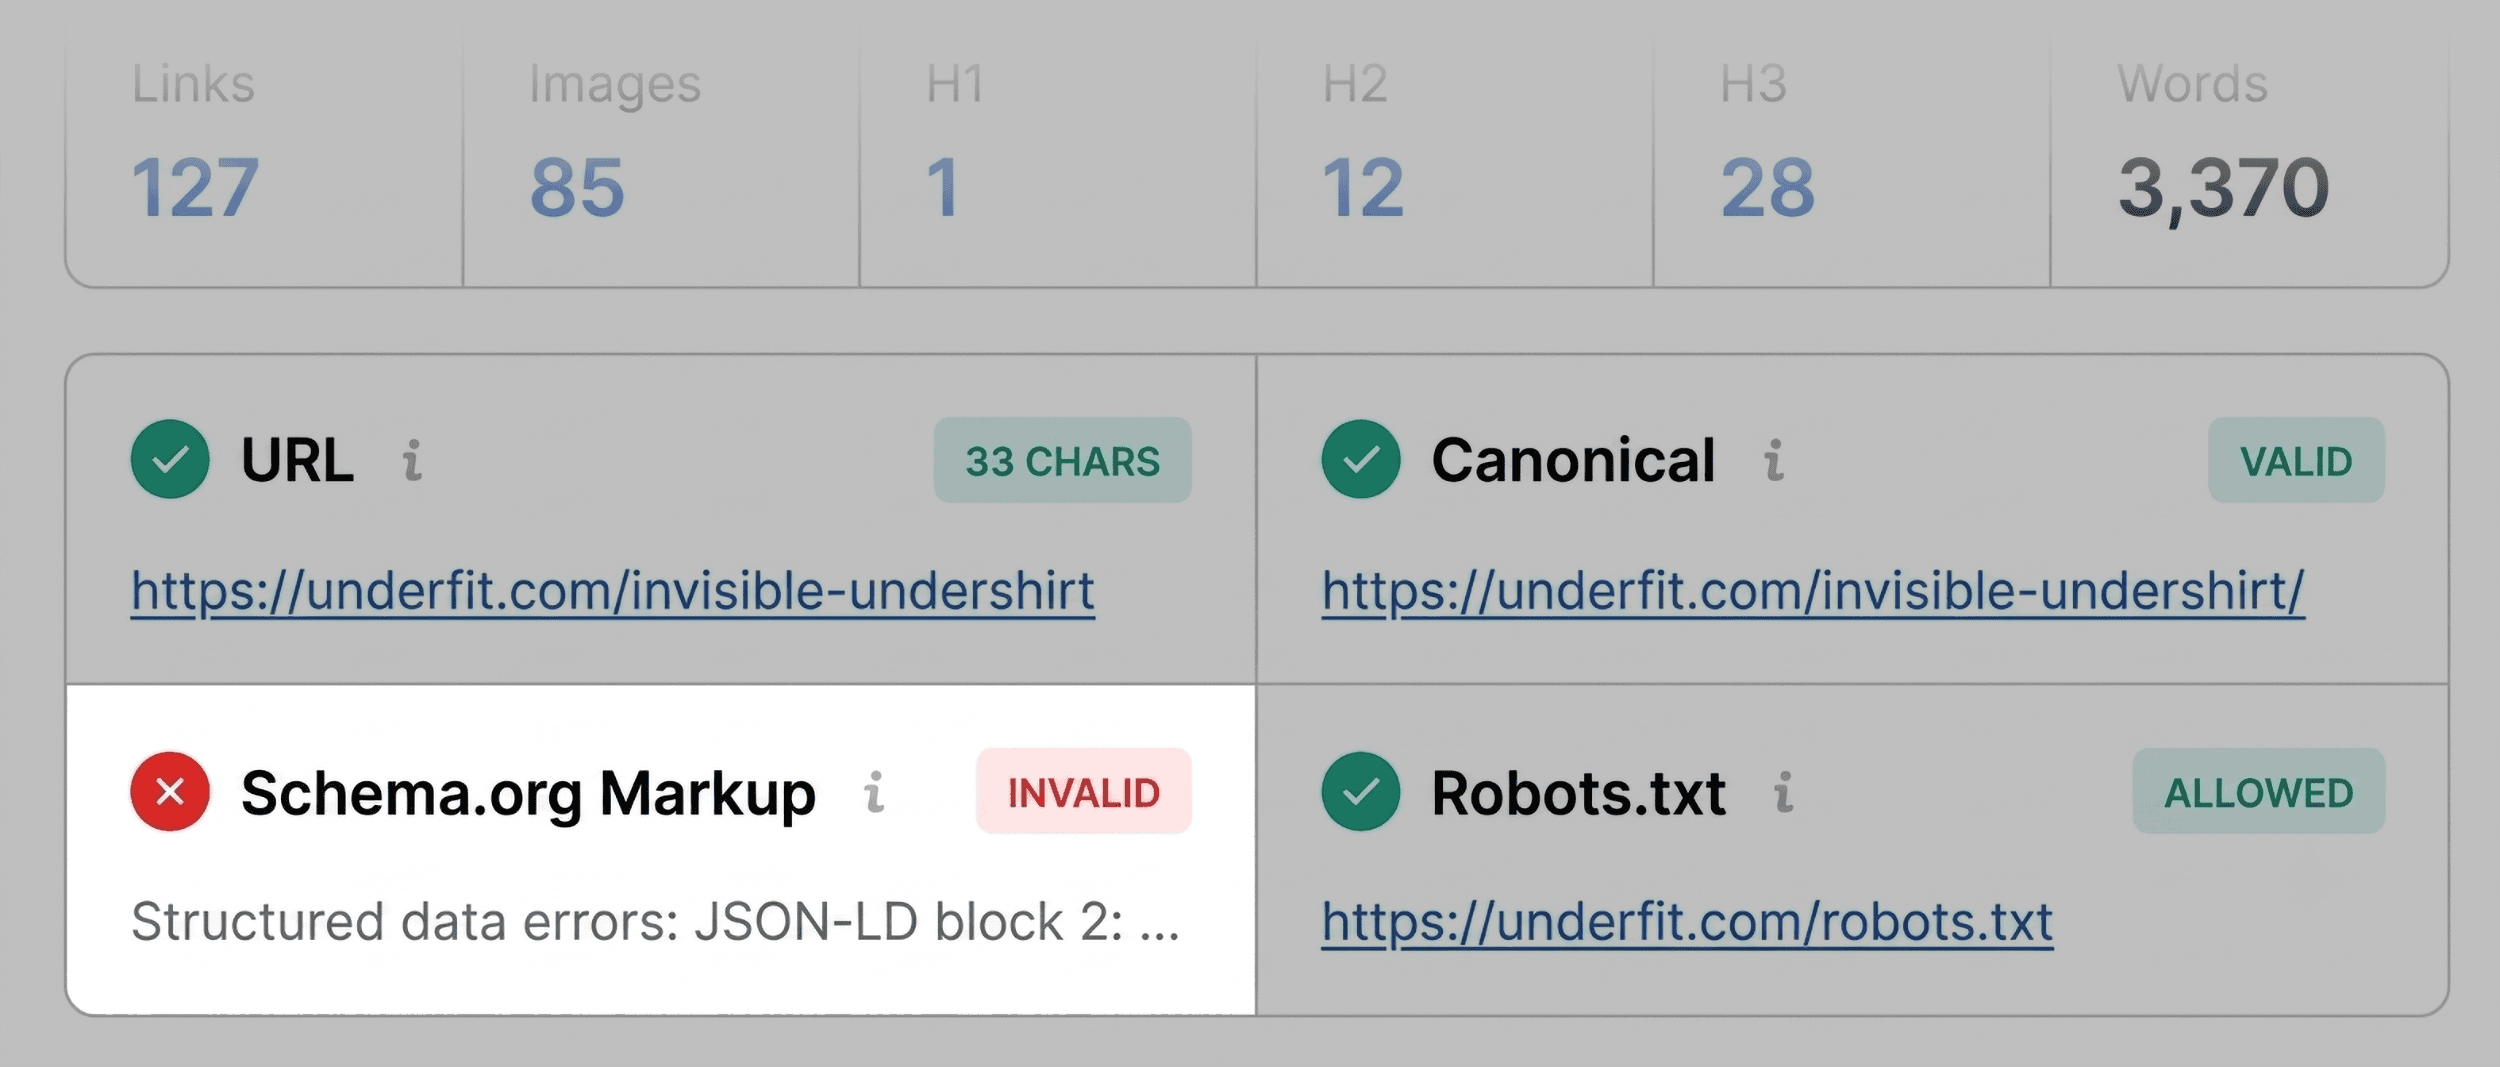

In the traditional digital marketing playbook, success was measured by a simple, linear path: a user searched, they clicked, and they converted. Analytics dashboards were the final word on performance. However, as the digital landscape shifts toward decentralized discovery—where AI-generated summaries and community threads carry as much weight as a traditional Google search result—that old playbook is becoming obsolete.

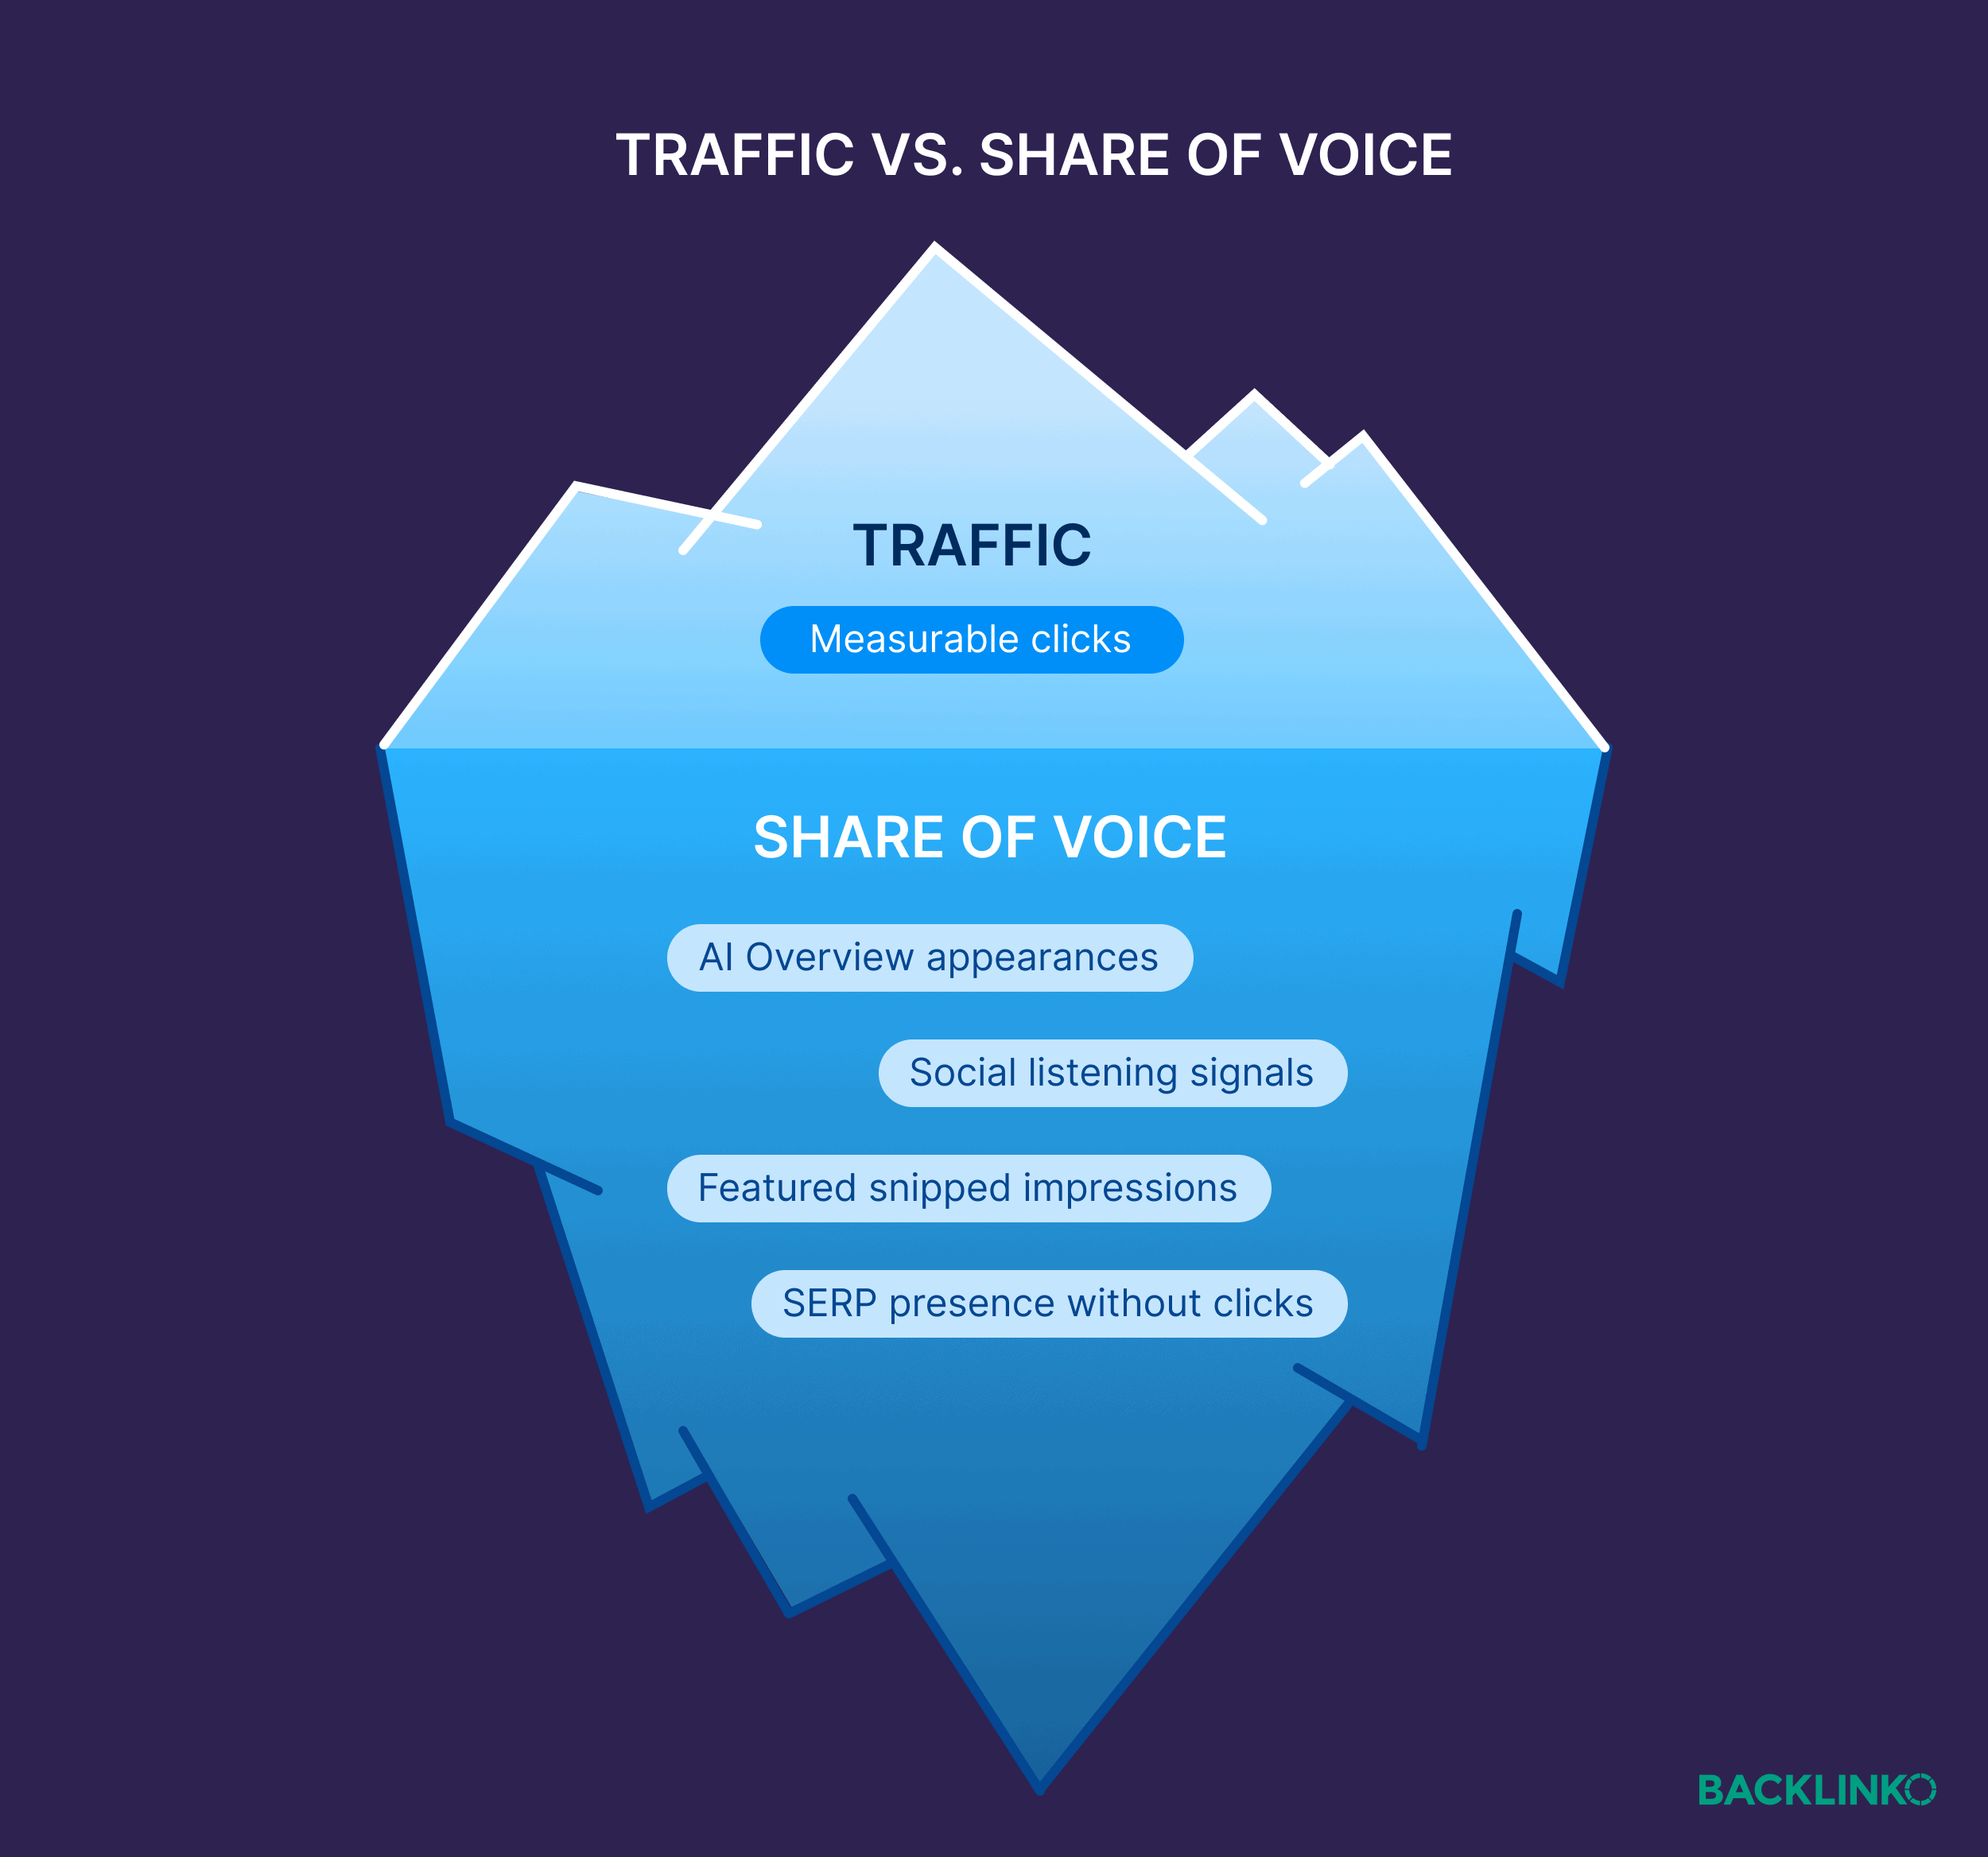
Your analytics dashboard tracks clicks, but it no longer conveys the complete picture. When a potential buyer reads an AI-generated answer that highlights your competitor, or scrolls through a Reddit thread about your category where your brand is conspicuously absent, that represents "lost visibility." Crucially, this loss will not appear in your traffic data. This is why forward-thinking marketers are shifting their focus toward Share of Voice (SoV).
SoV captures what traffic metrics cannot. It measures your brand’s visibility relative to your competitors across the specific channels where your buyers actually research and make critical purchasing decisions. While SoV traditionally spanned social, PR, and paid media, search—both organic and AI-driven—is the most vital frontier for most brands today. It is where buyers with the strongest purchase intent congregate, and it is the most accessible channel to measure with precision.
What Is Share of Voice?
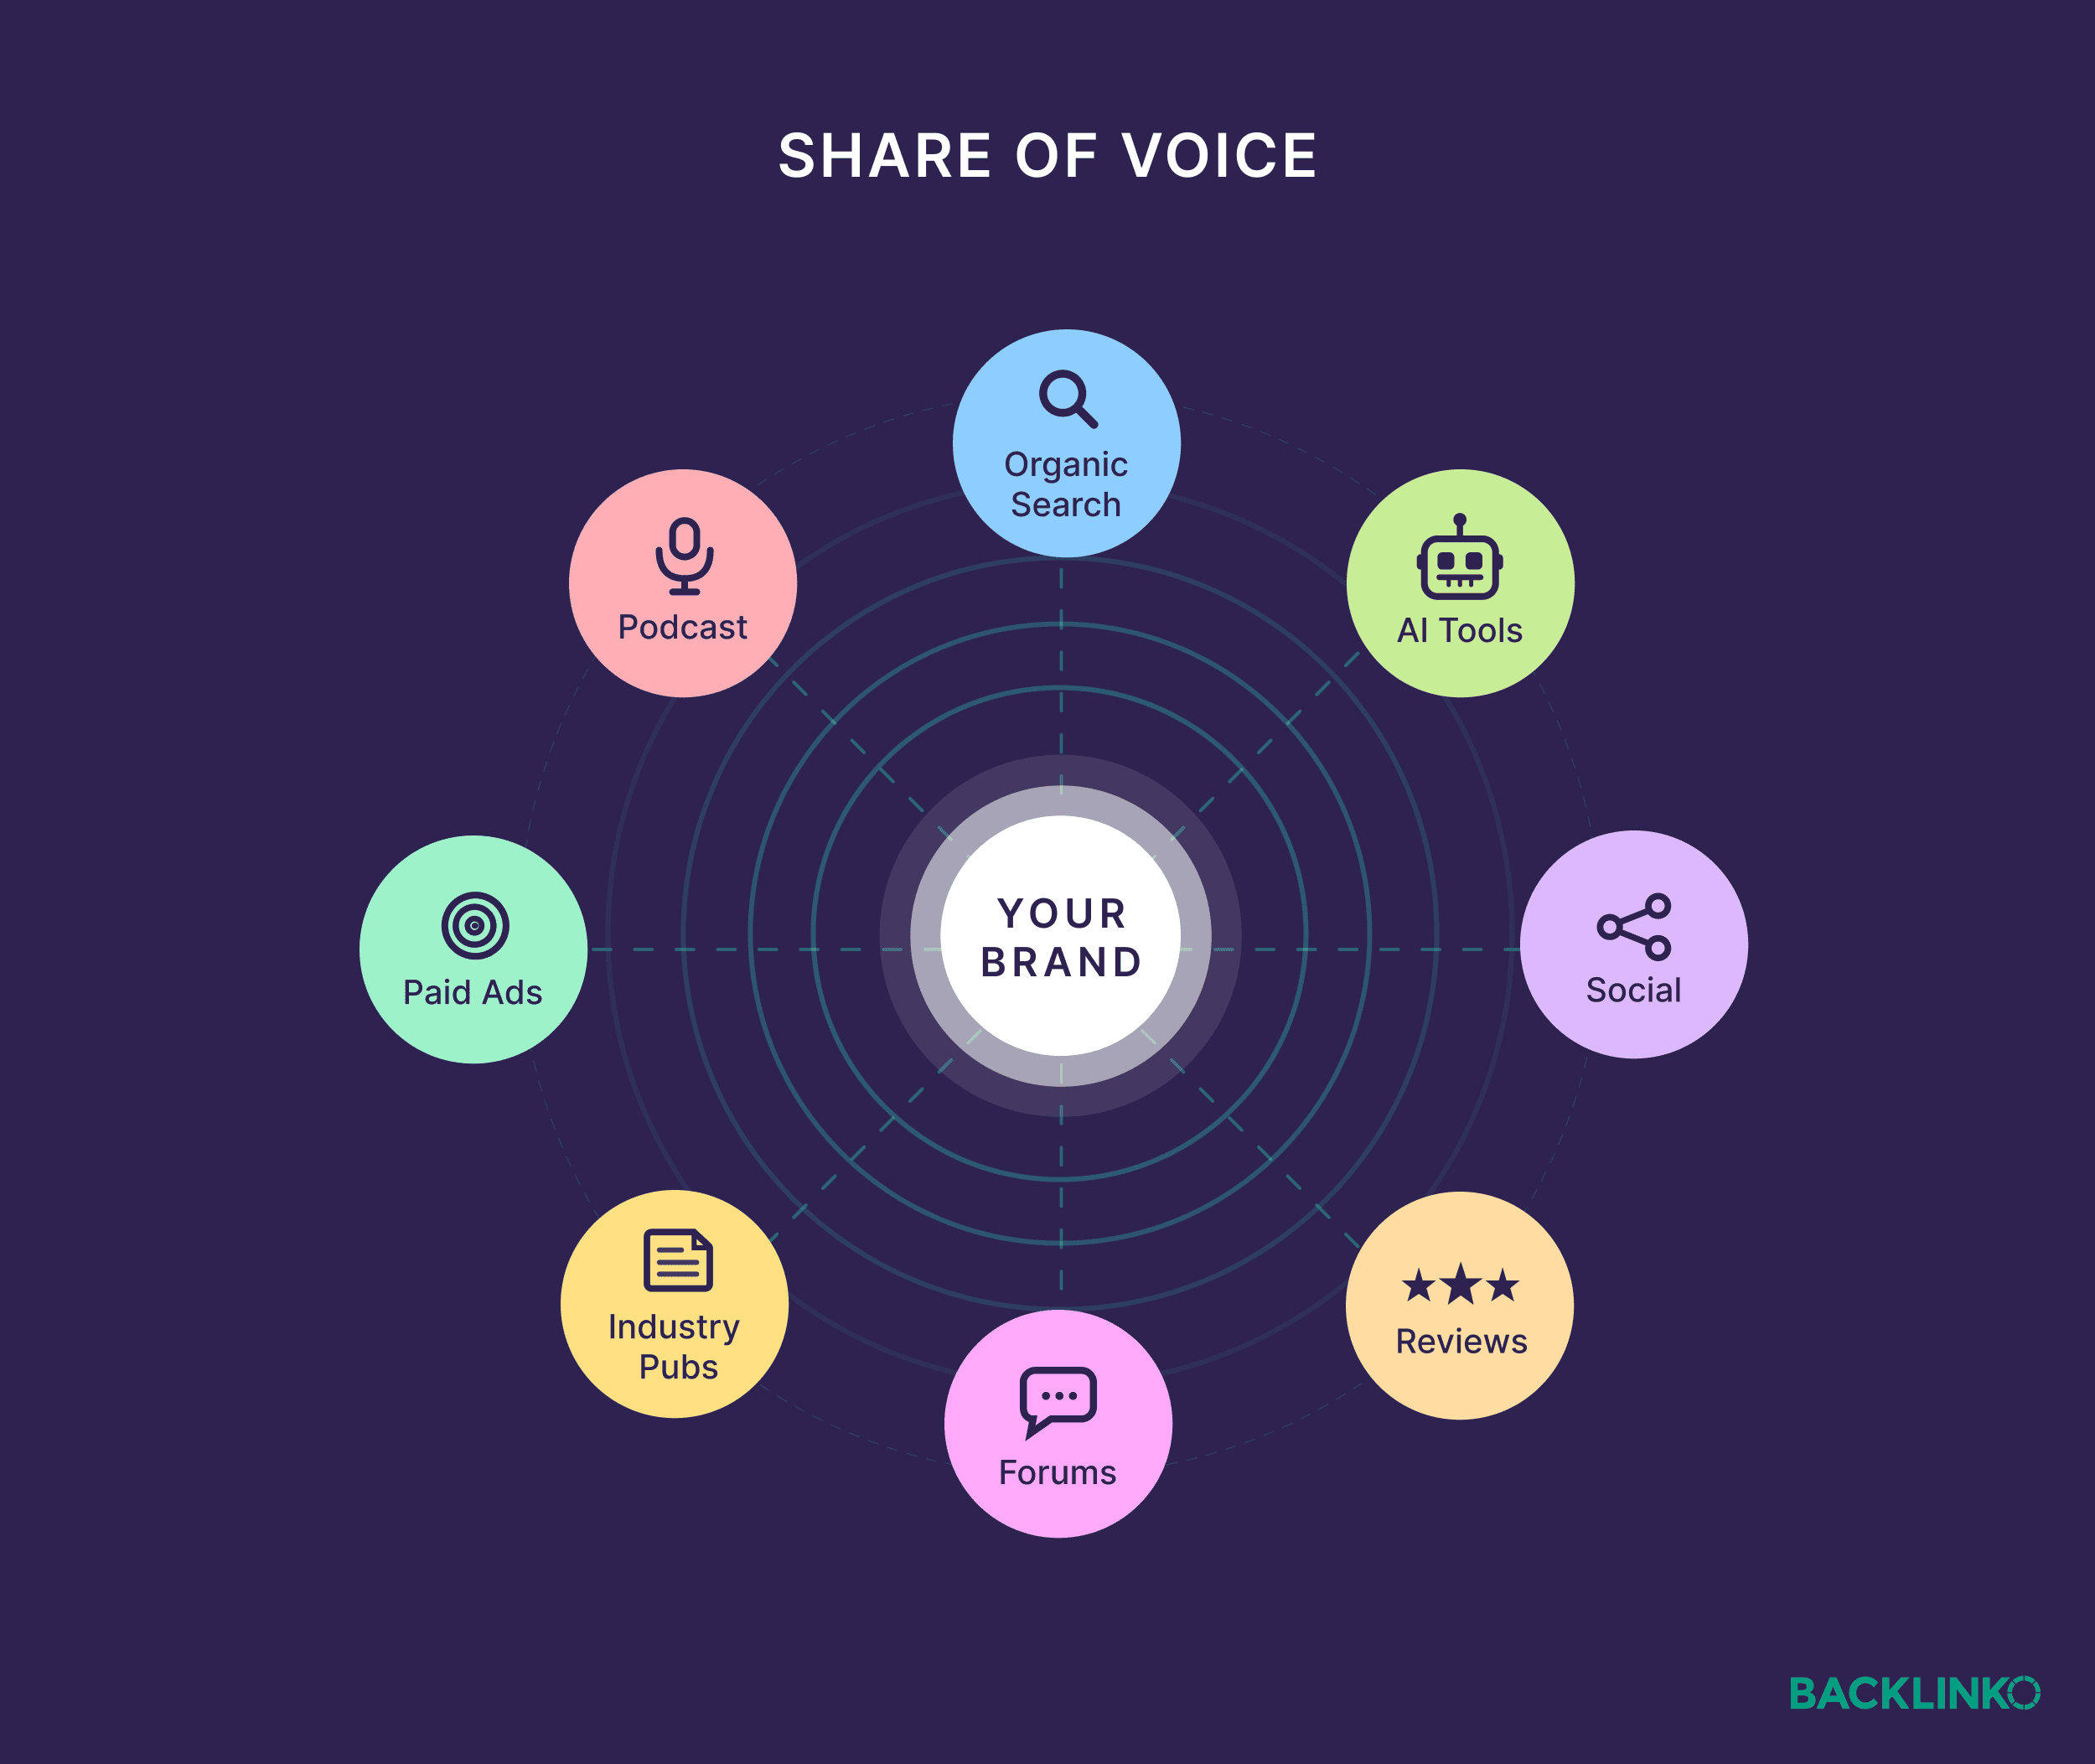
At its core, Share of Voice measures your brand’s visibility relative to competitors across multiple marketing channels. It includes organic search, AI-powered search (LLM responses), social media, review platforms, and niche communities.

Traditionally, brands used SoV to track their share of ad spend in a market. Today, the metric has evolved into something far more strategic. It measures your brand’s presence across every touchpoint where buyers research and make decisions. In simple terms, SoV tells you what percentage of the conversation you own in your category compared to your competitors.
Because buyer discovery is shifting so rapidly, we are seeing the maturation of measurement tools that allow us to calculate SoV for both organic and AI search. Once you master your visibility in these foundational channels, layering in social and PR becomes a significantly simpler process.
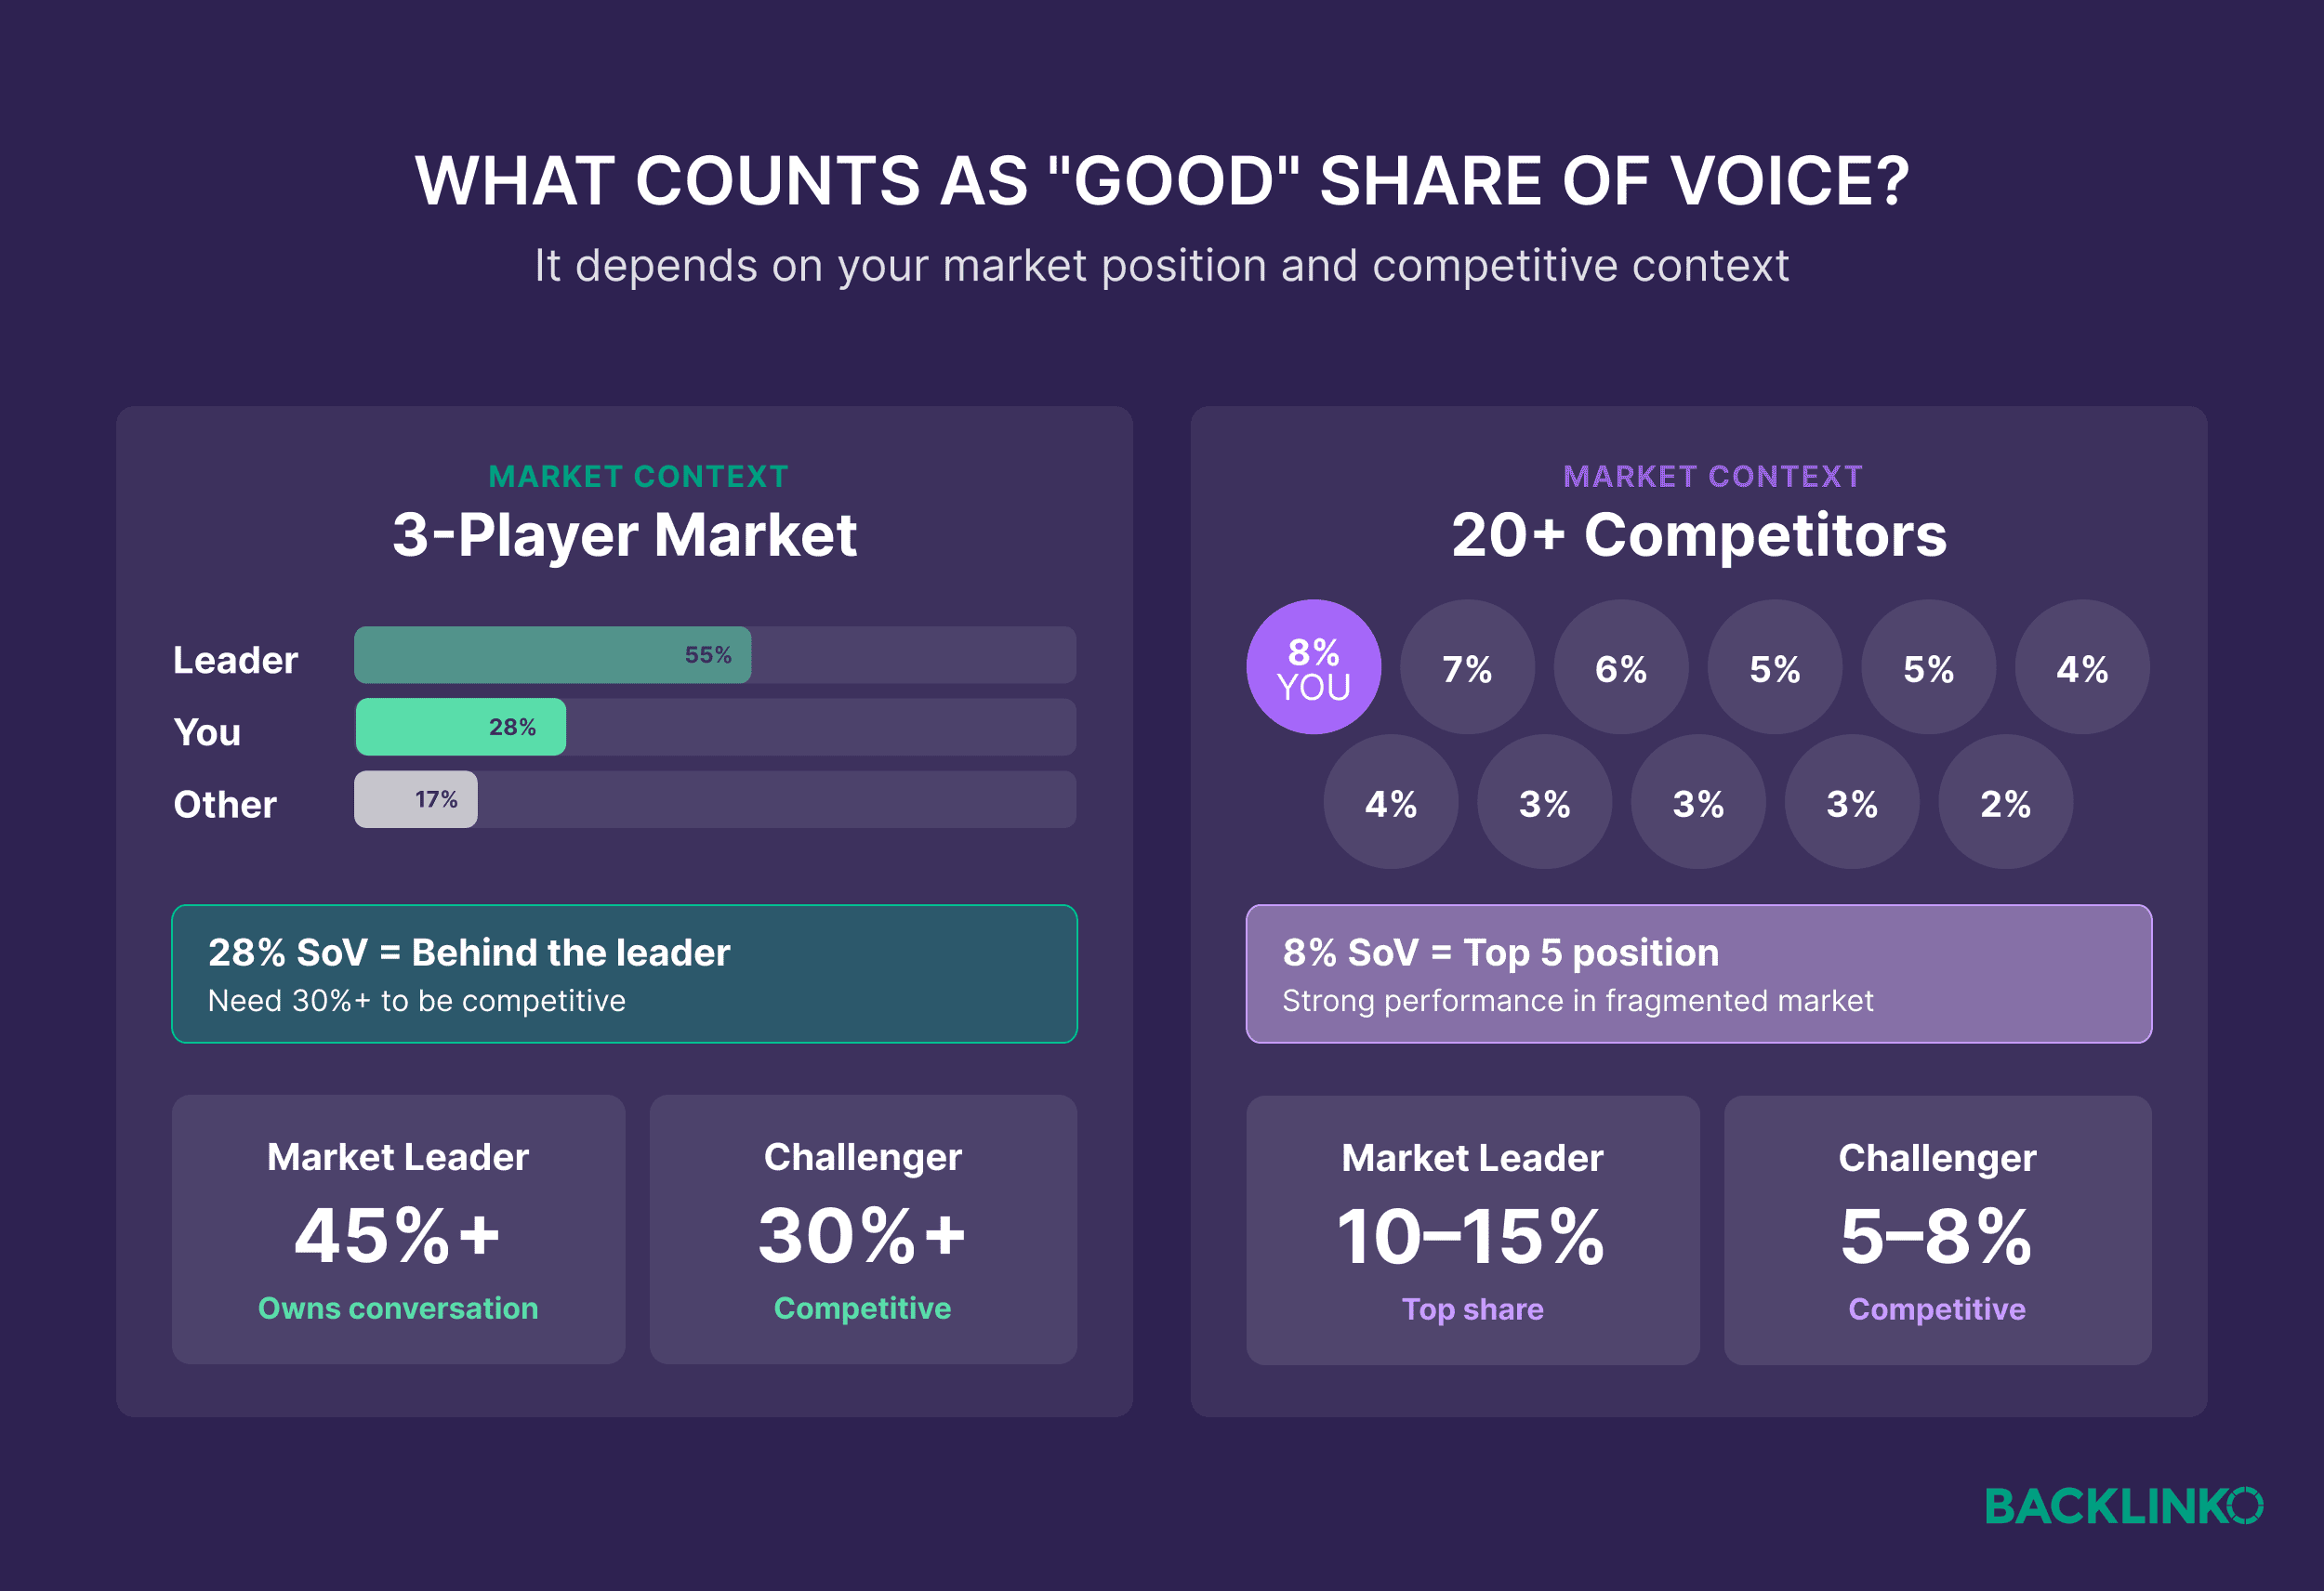
What Counts as a "Good" Share of Voice?
There is no universal benchmark for SoV; it is highly dependent on your industry, your market maturity, and your specific growth stage. To establish a baseline for your brand, you must consider:

- Your Competitive Set: Are you a challenger brand trying to disrupt an incumbent, or are you the market leader trying to defend your territory?
- Category Growth: High SoV in a stagnant or declining market can be a dangerous vanity metric. The real victory is growing your share of voice as the overall category grows.
The Evolution of Search: SEO vs. AI
Both SEO and AI SoV answer the same fundamental question: What percentage of category demand does your brand own? However, they measure fundamentally different search contexts.

- SEO SoV: This calculates your slice of traditional organic search traffic. For example, if you track 100 target keywords that generate 50,000 total monthly visits across all ranking sites, and your site captures 15,000 of those visits, you have a 30% organic share of voice.
- AI SoV: This measures brand mentions and citations in LLM responses from tools like ChatGPT, Perplexity, and Google’s AI Overviews. If you test 100 category-related prompts and your brand appears in 45 responses while a competitor appears in 30, you can calculate a weighted AI SoV based on mentions and citations.
Why Share of Voice is Essential in 2026
Share of voice has become the core KPI for visibility for three primary reasons:
1. Tracking Visibility Beyond Traditional Traffic
Organic traffic data reveals only half the story. With the rise of "zero-click" searches, that half is shrinking. When users receive their answers directly from AI Overviews and featured snippets, a significant portion of your visibility is never captured in Google Analytics. Traffic is, by definition, a lagging indicator. SoV is a superior metric because it measures how visible you are in the consideration set, even when users don’t click through to your site.
2. Eliminating Silos
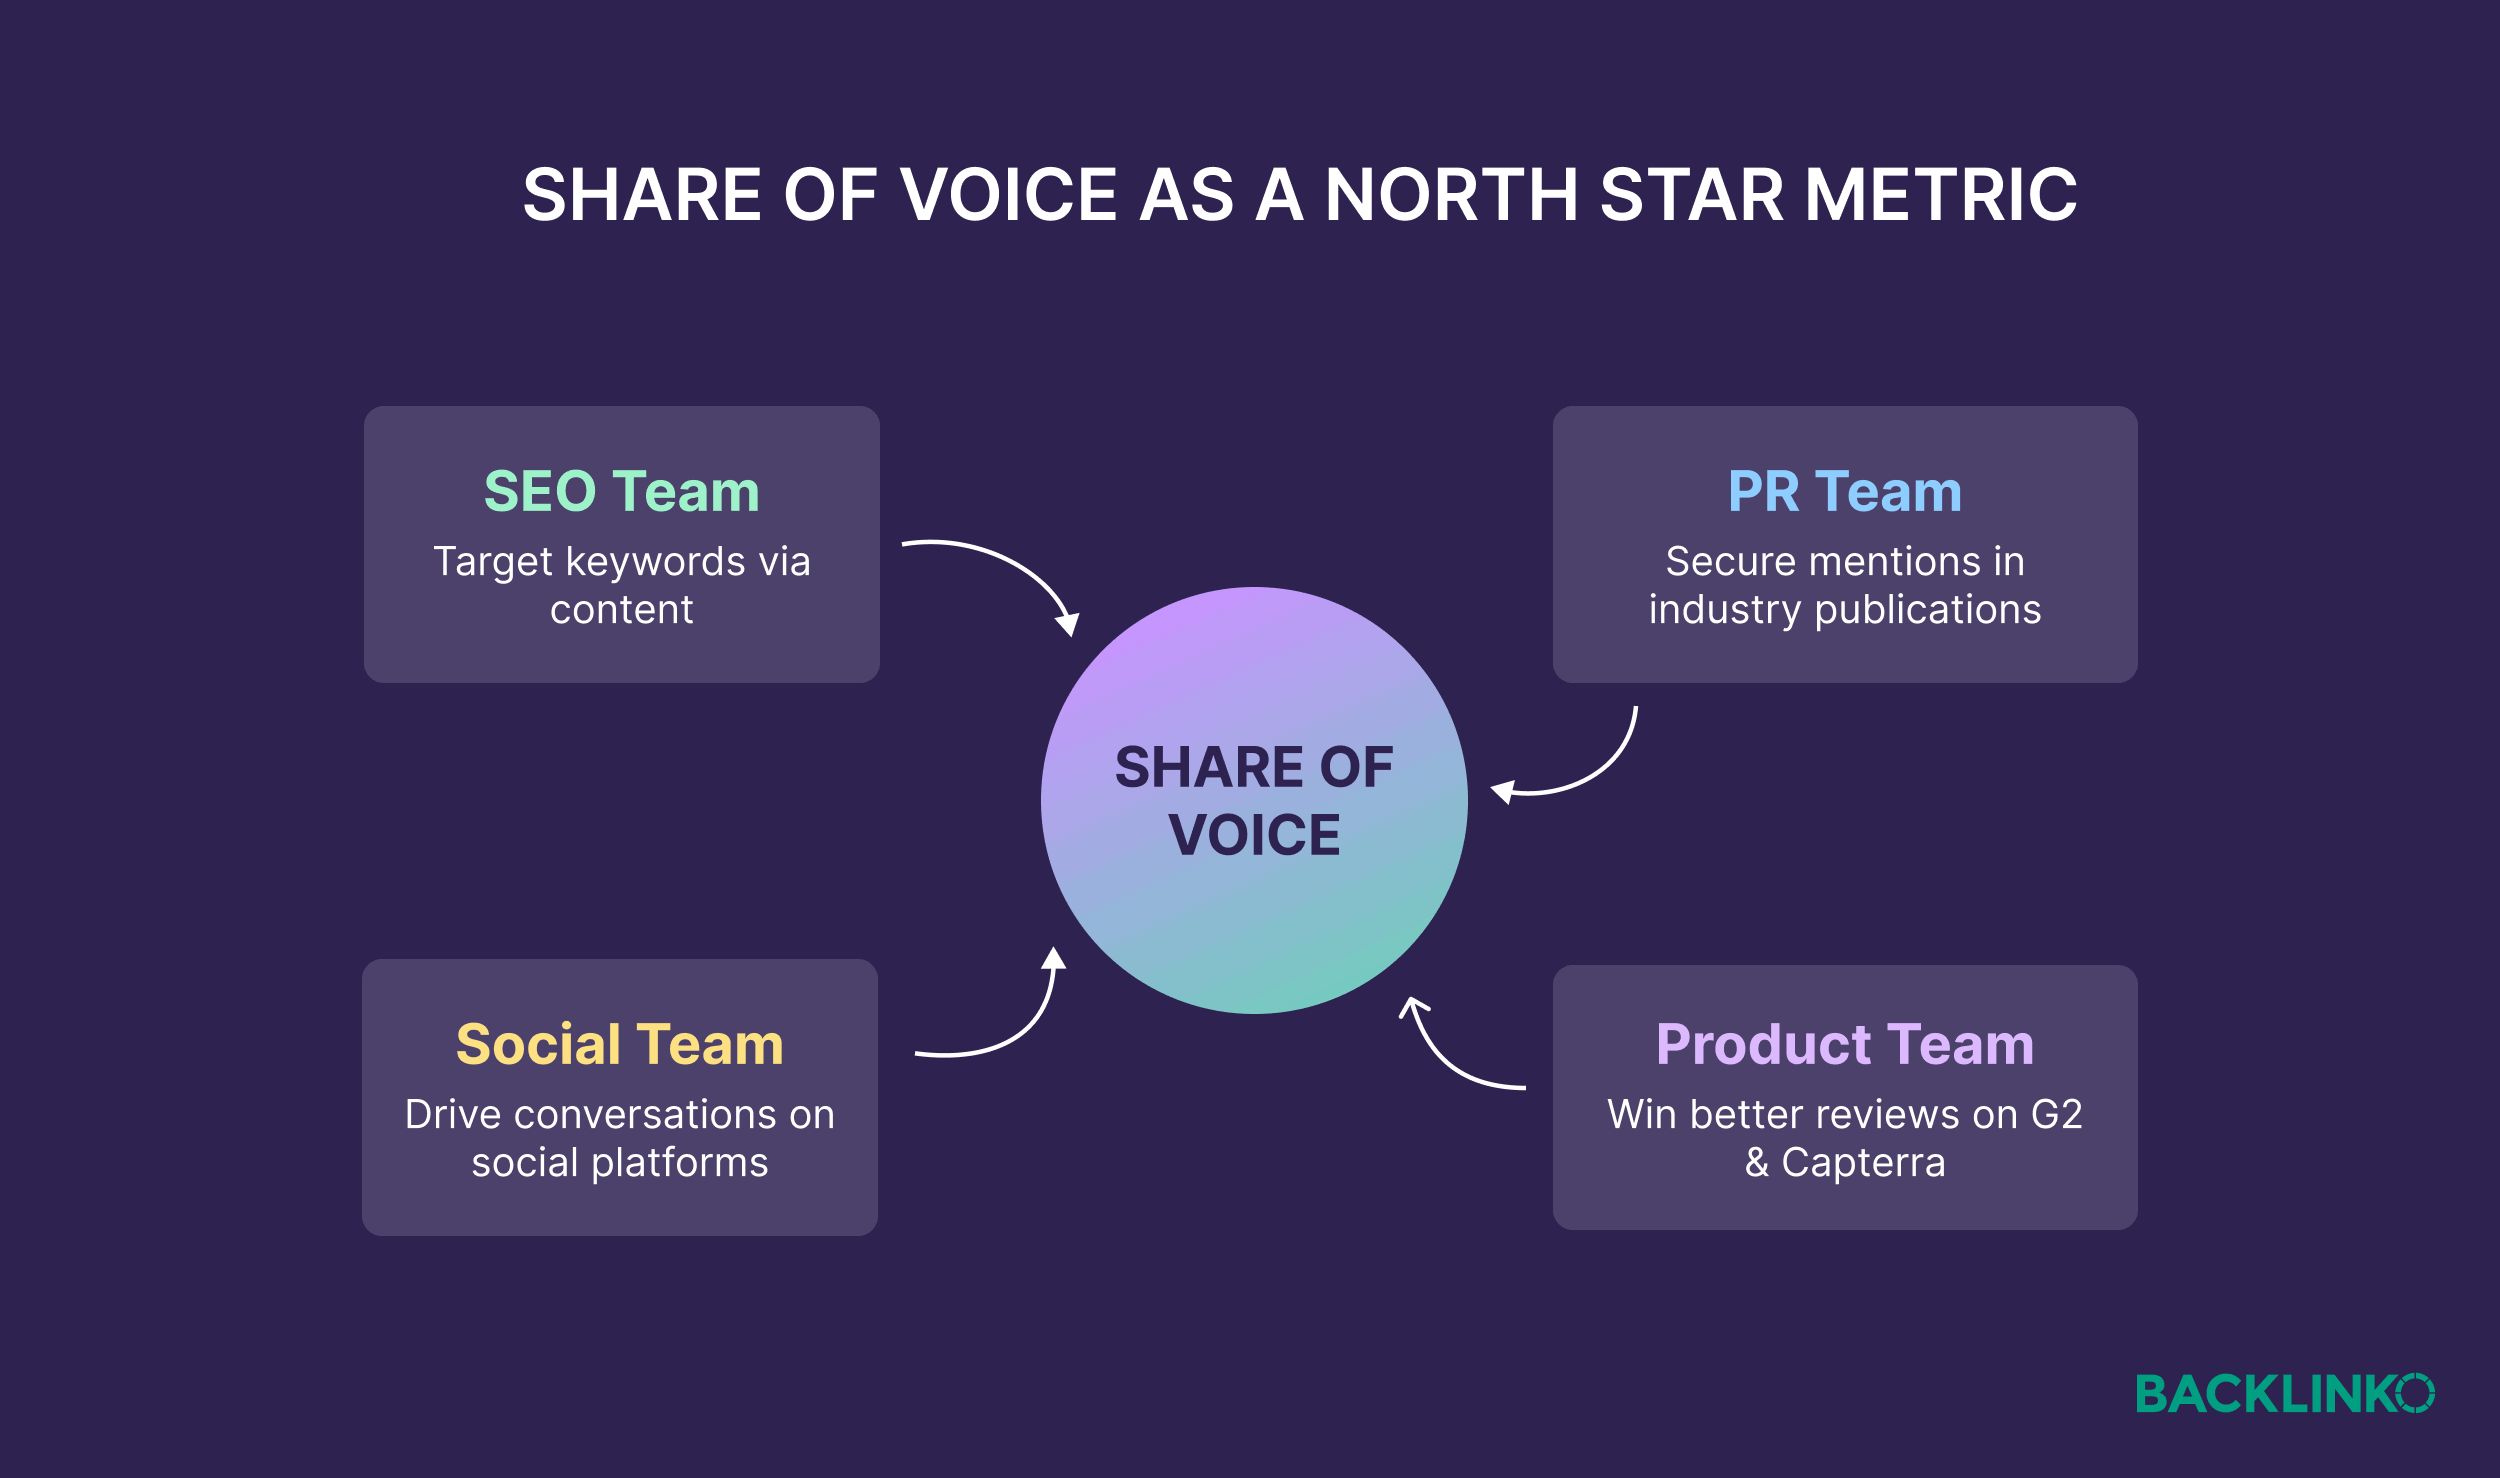
Marketing teams often operate in silos: the SEO team chases visits, PR chases mentions, and social teams chase engagement. SoV acts as a "North Star" metric that every team can rally around. When stakeholders across the organization see how their individual efforts contribute to a unified visibility percentage, it fundamentally changes how teams collaborate and prioritize.
3. Mapping the Buyer Journey
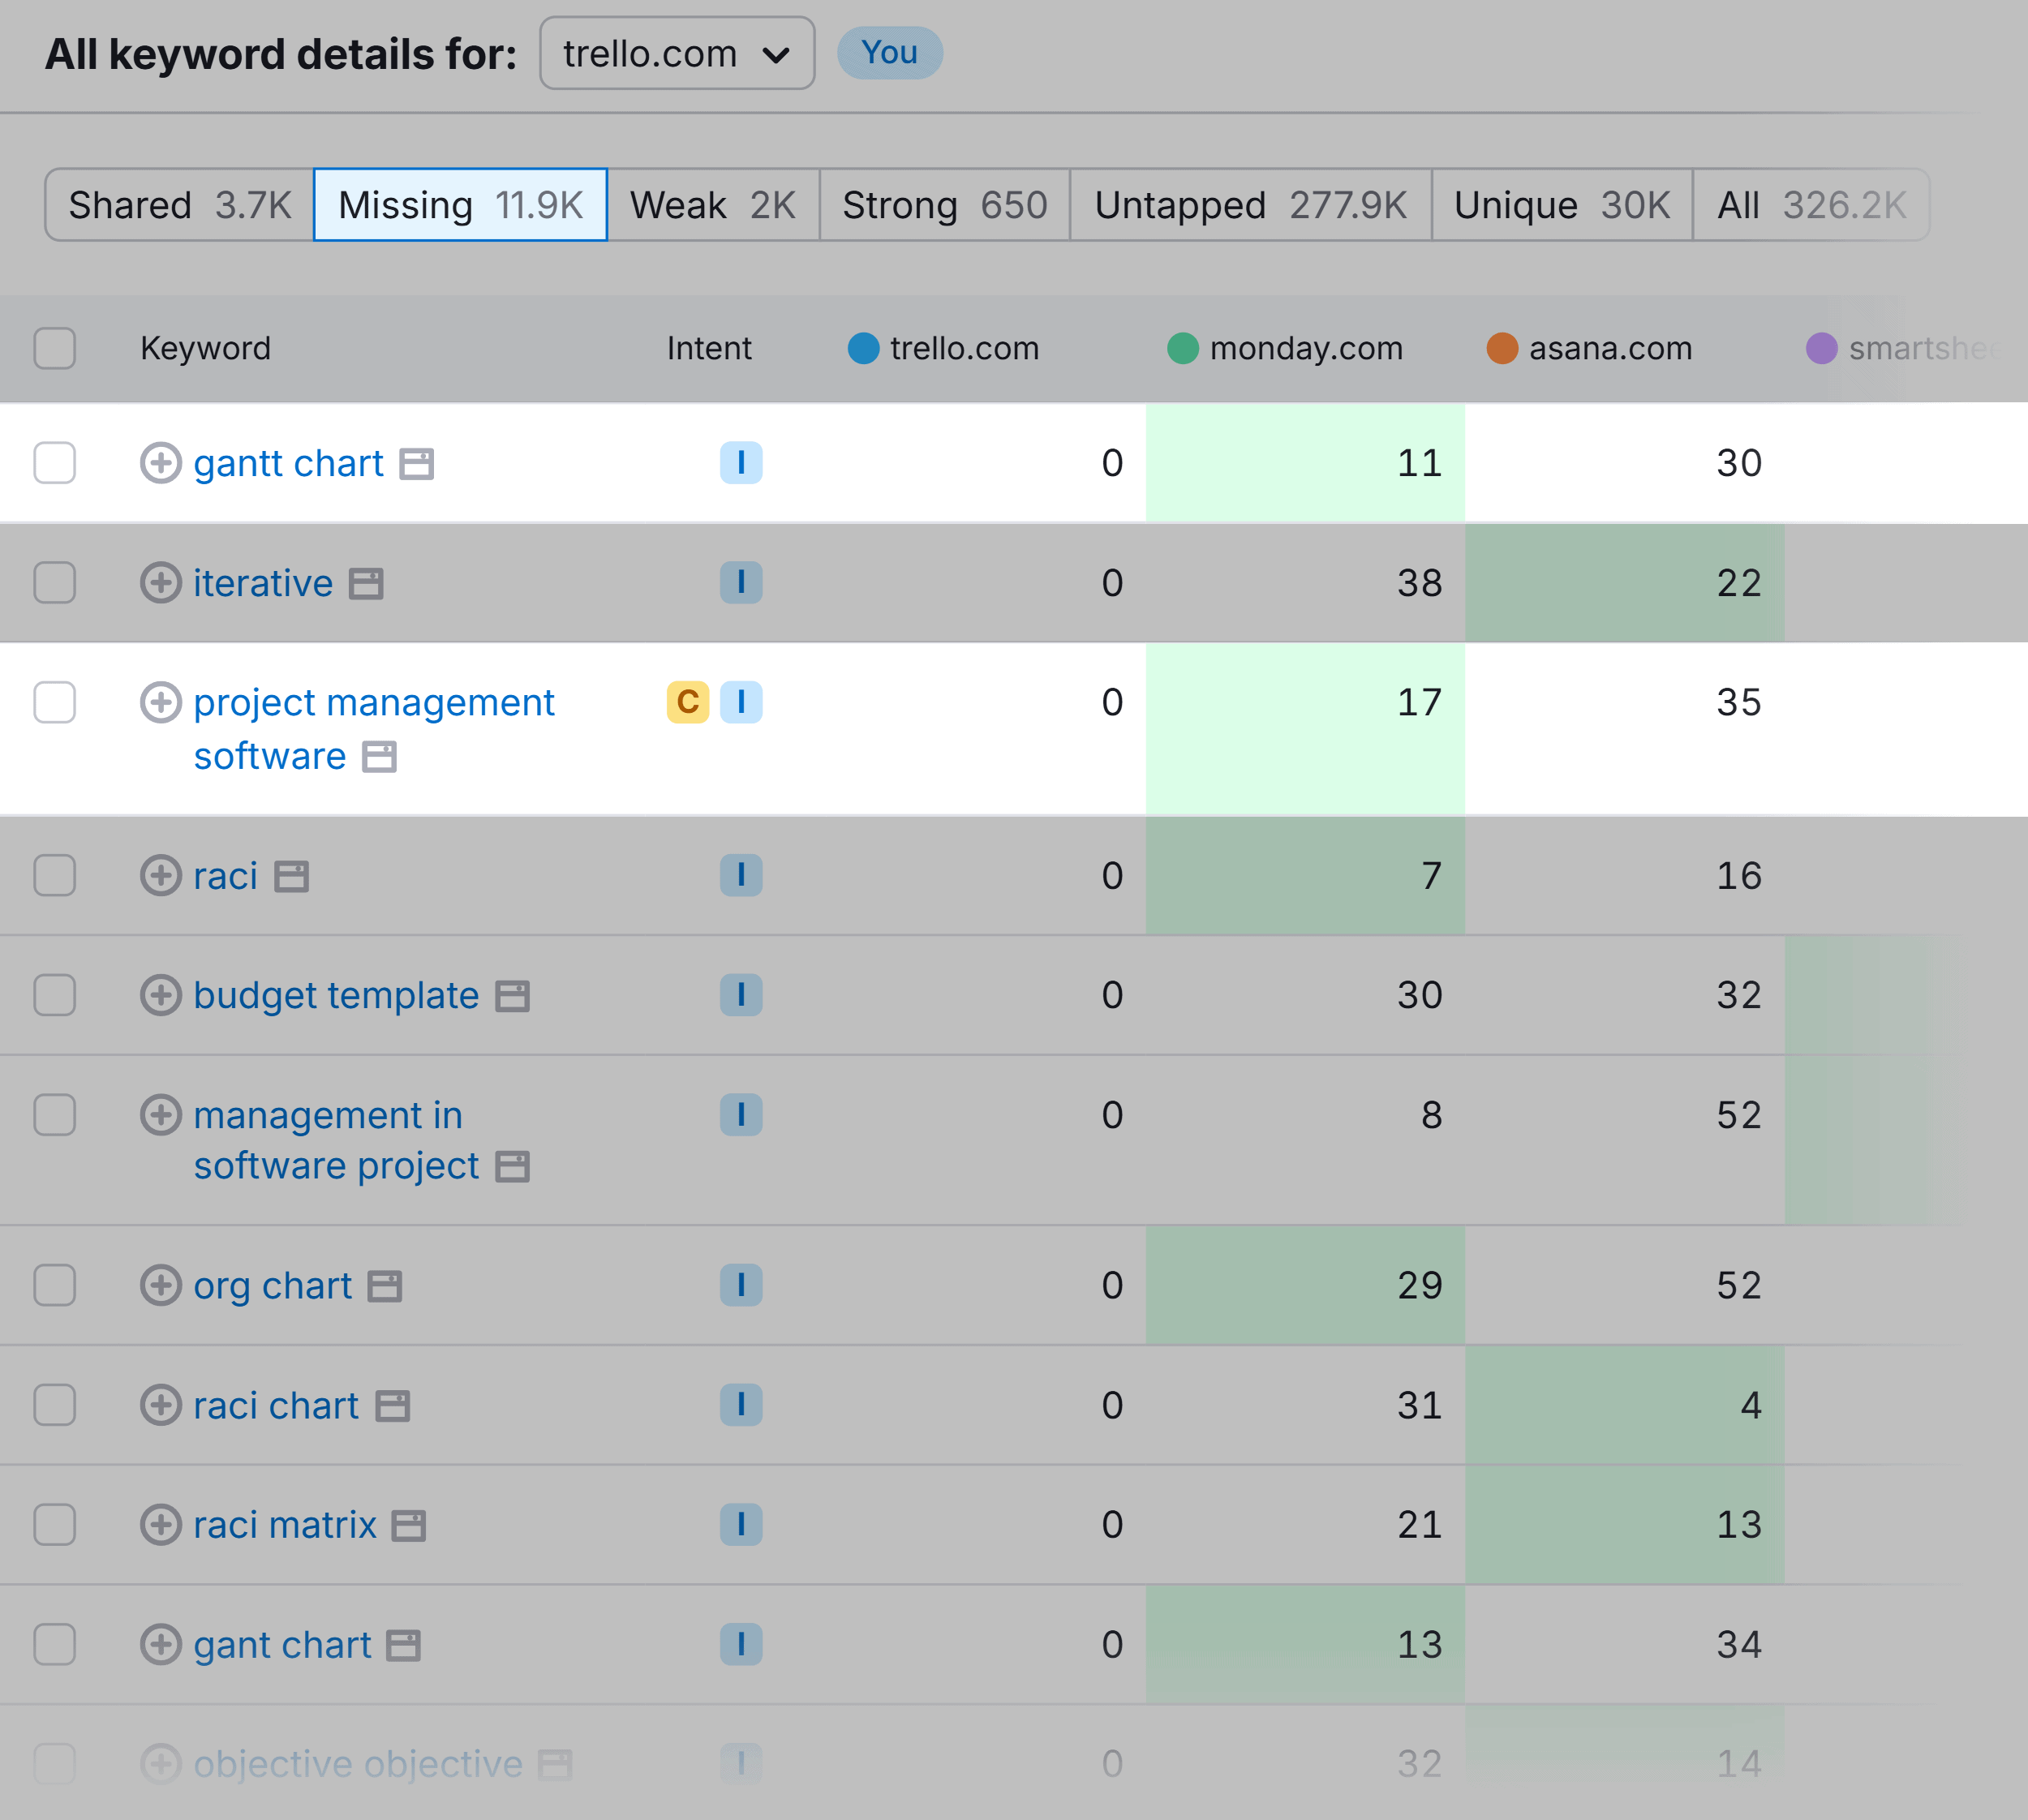
By segmenting your SoV data by funnel stage (Awareness, Consideration, and Decision), you can pinpoint exactly where you are winning and where you are falling behind. If a software company has high visibility for top-of-funnel educational terms but is invisible for decision-stage "alternative to" queries, they know exactly where to reallocate their resources.

How to Measure Share of Voice in 4 Steps
To calculate your SoV, you need a disciplined, four-step approach.
Step 1: Define Your Industry Landscape
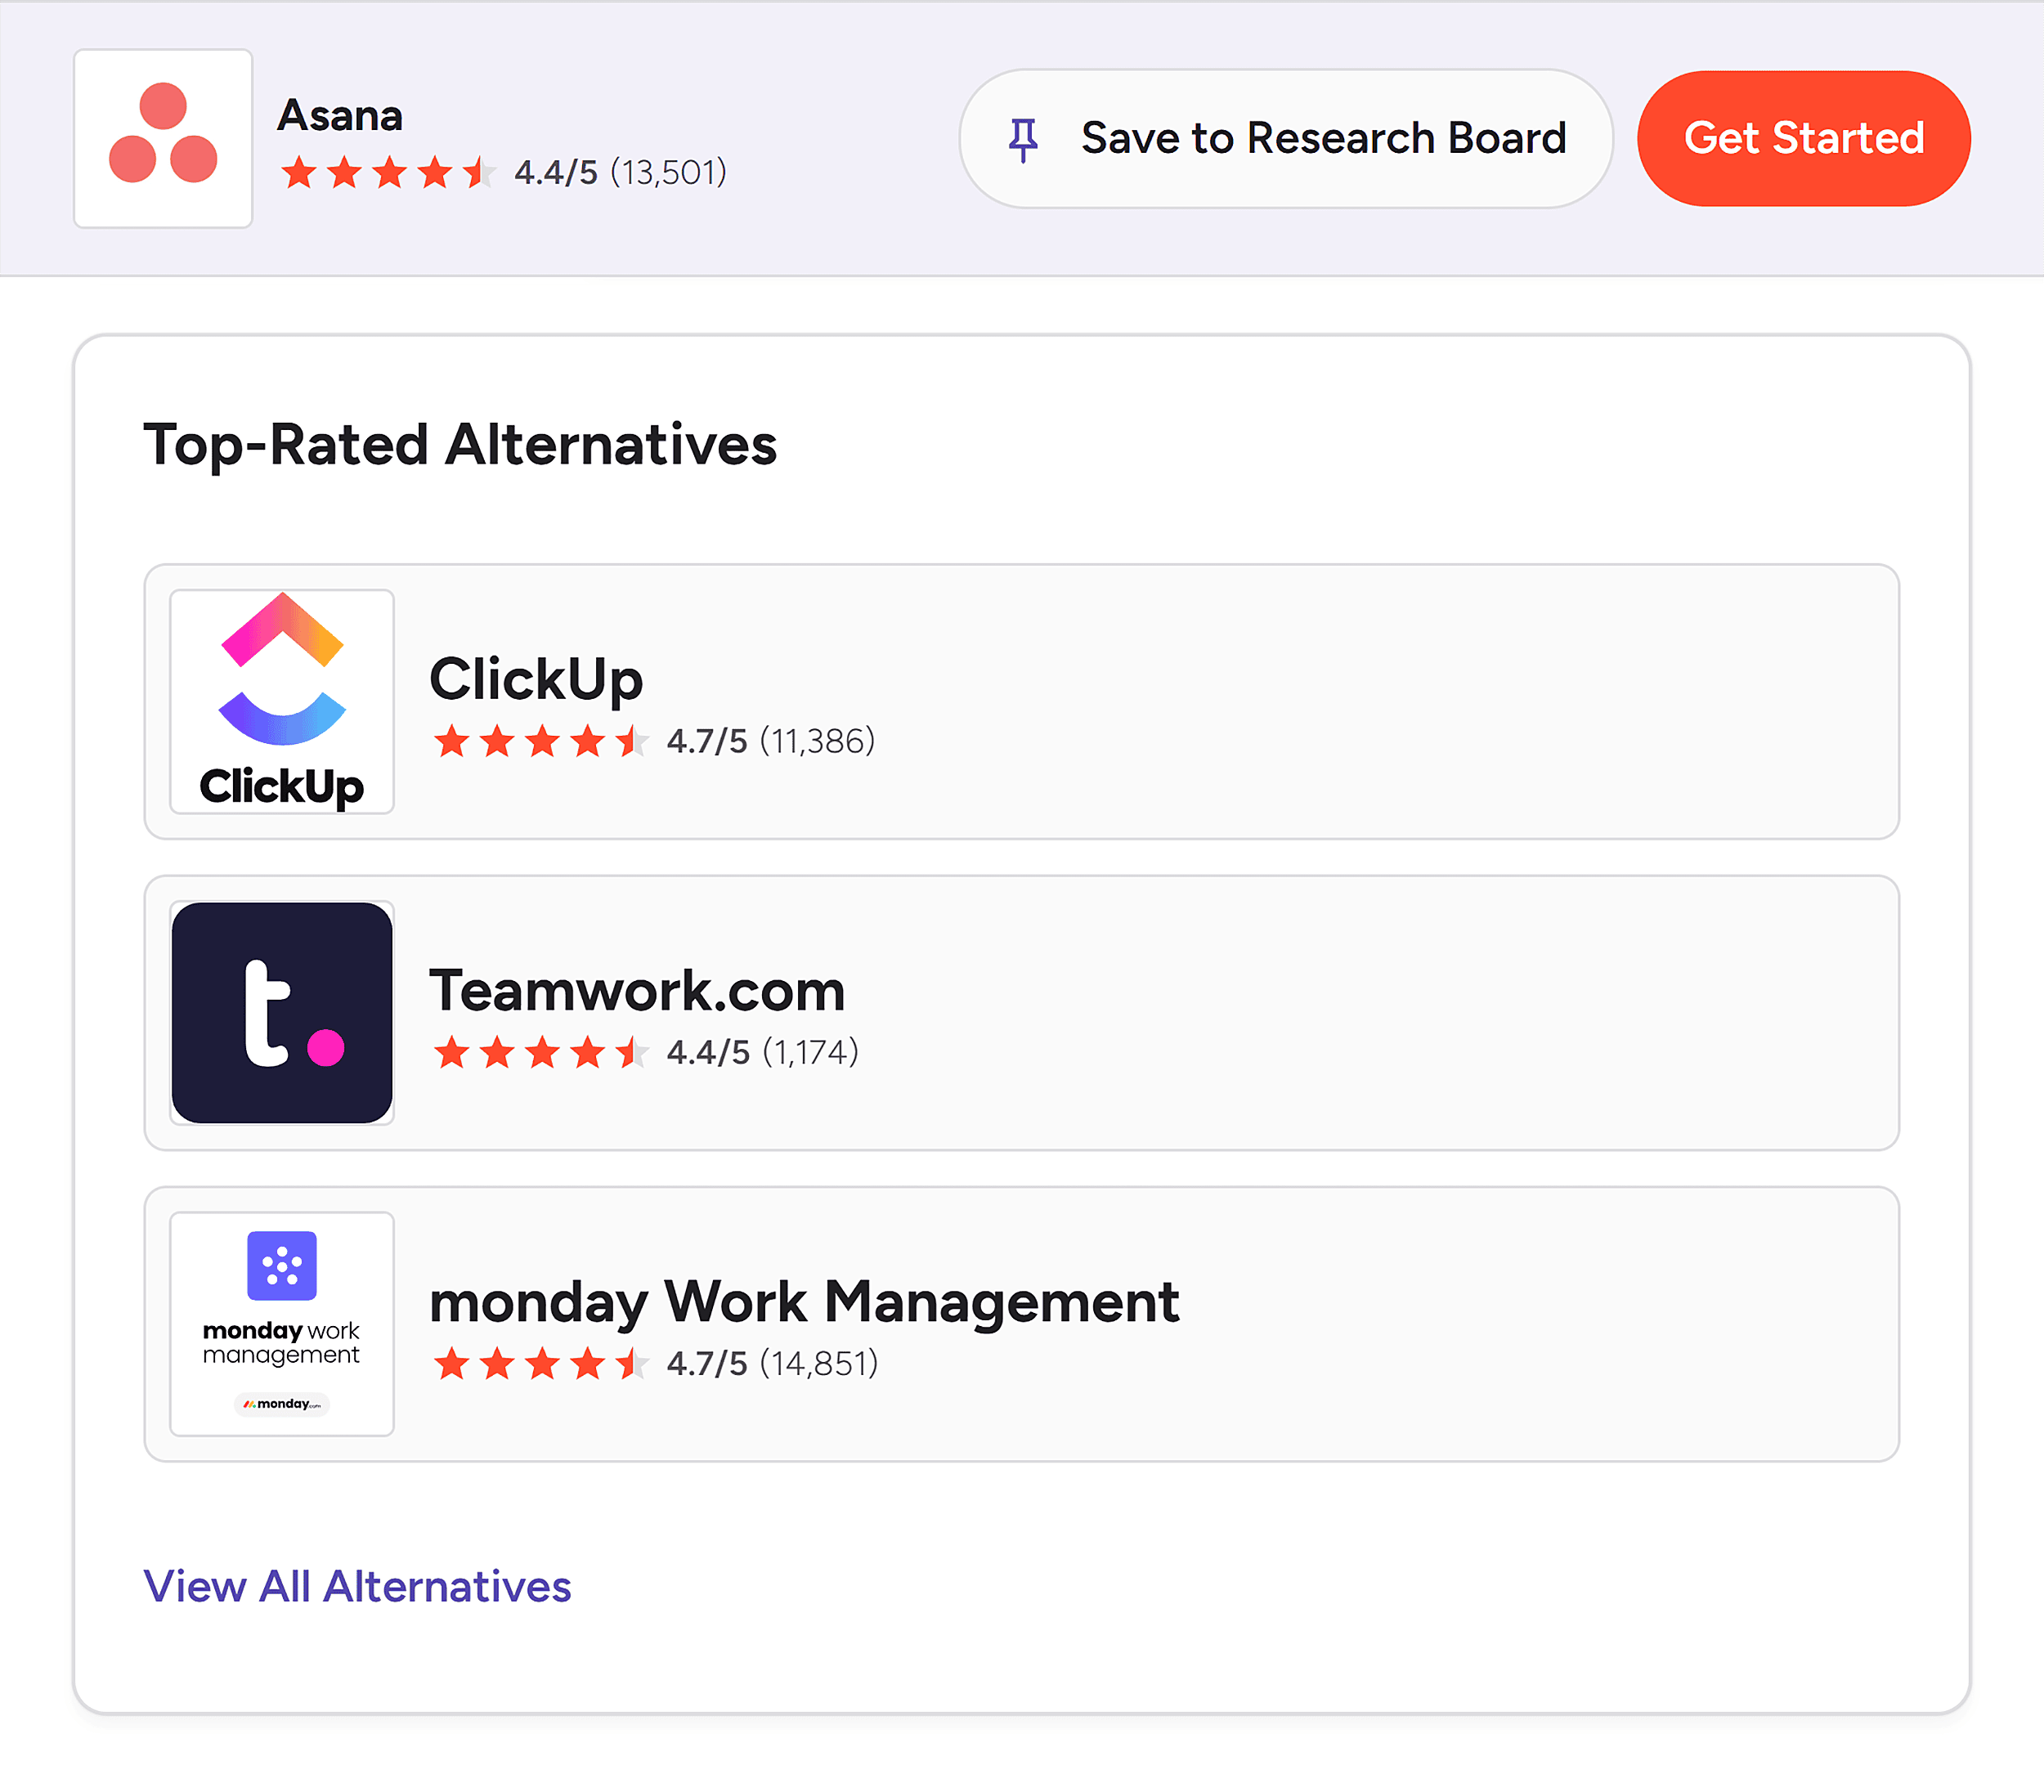
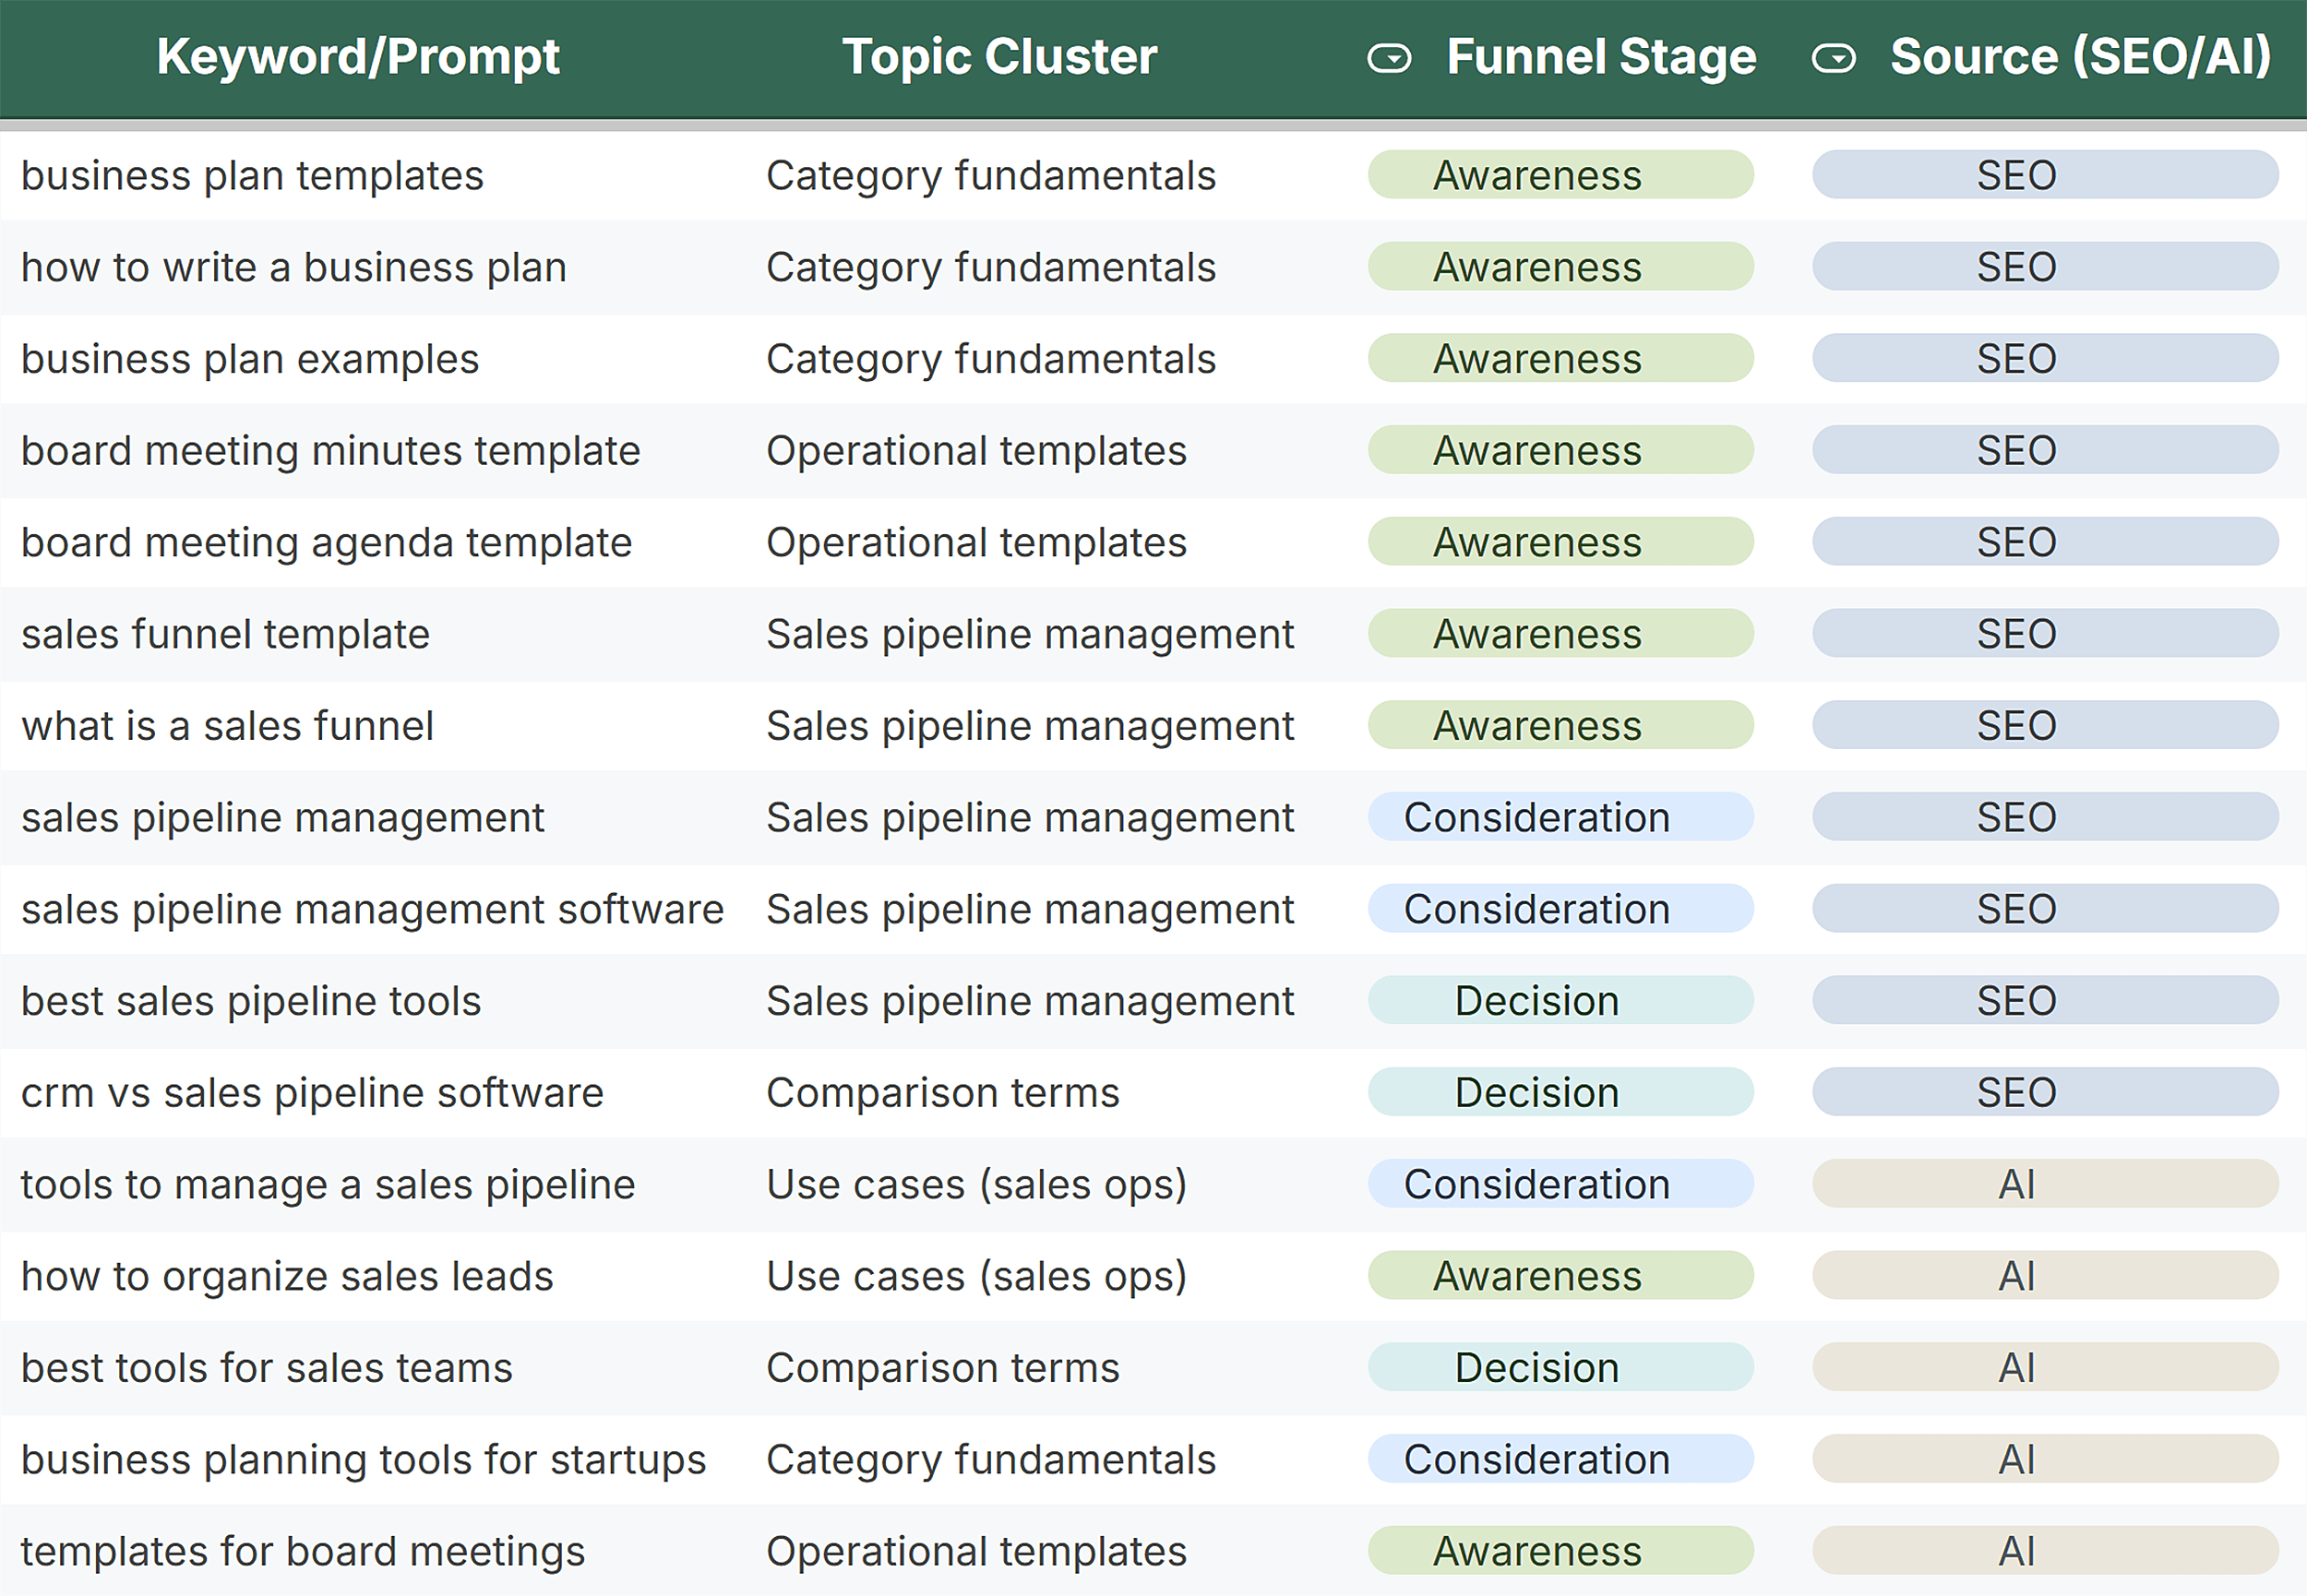
Start by outlining the specific competitors and keywords you will track. Use topic clusters tied directly to revenue. Categorize these into three funnel stages:

- Top of Funnel (ToFu): Broad, educational queries.
- Middle of Funnel (MoFu): Problem-aware queries.
- Bottom of Funnel (BoFu): Solution-aware, comparison, and intent-driven queries.
Step 2: Build Your Keyword & Prompt Libraries
You need 200–500 queries that capture how people search in your category.
- Pull SEO Data: Use Google Search Console to export queries where you are already visible.
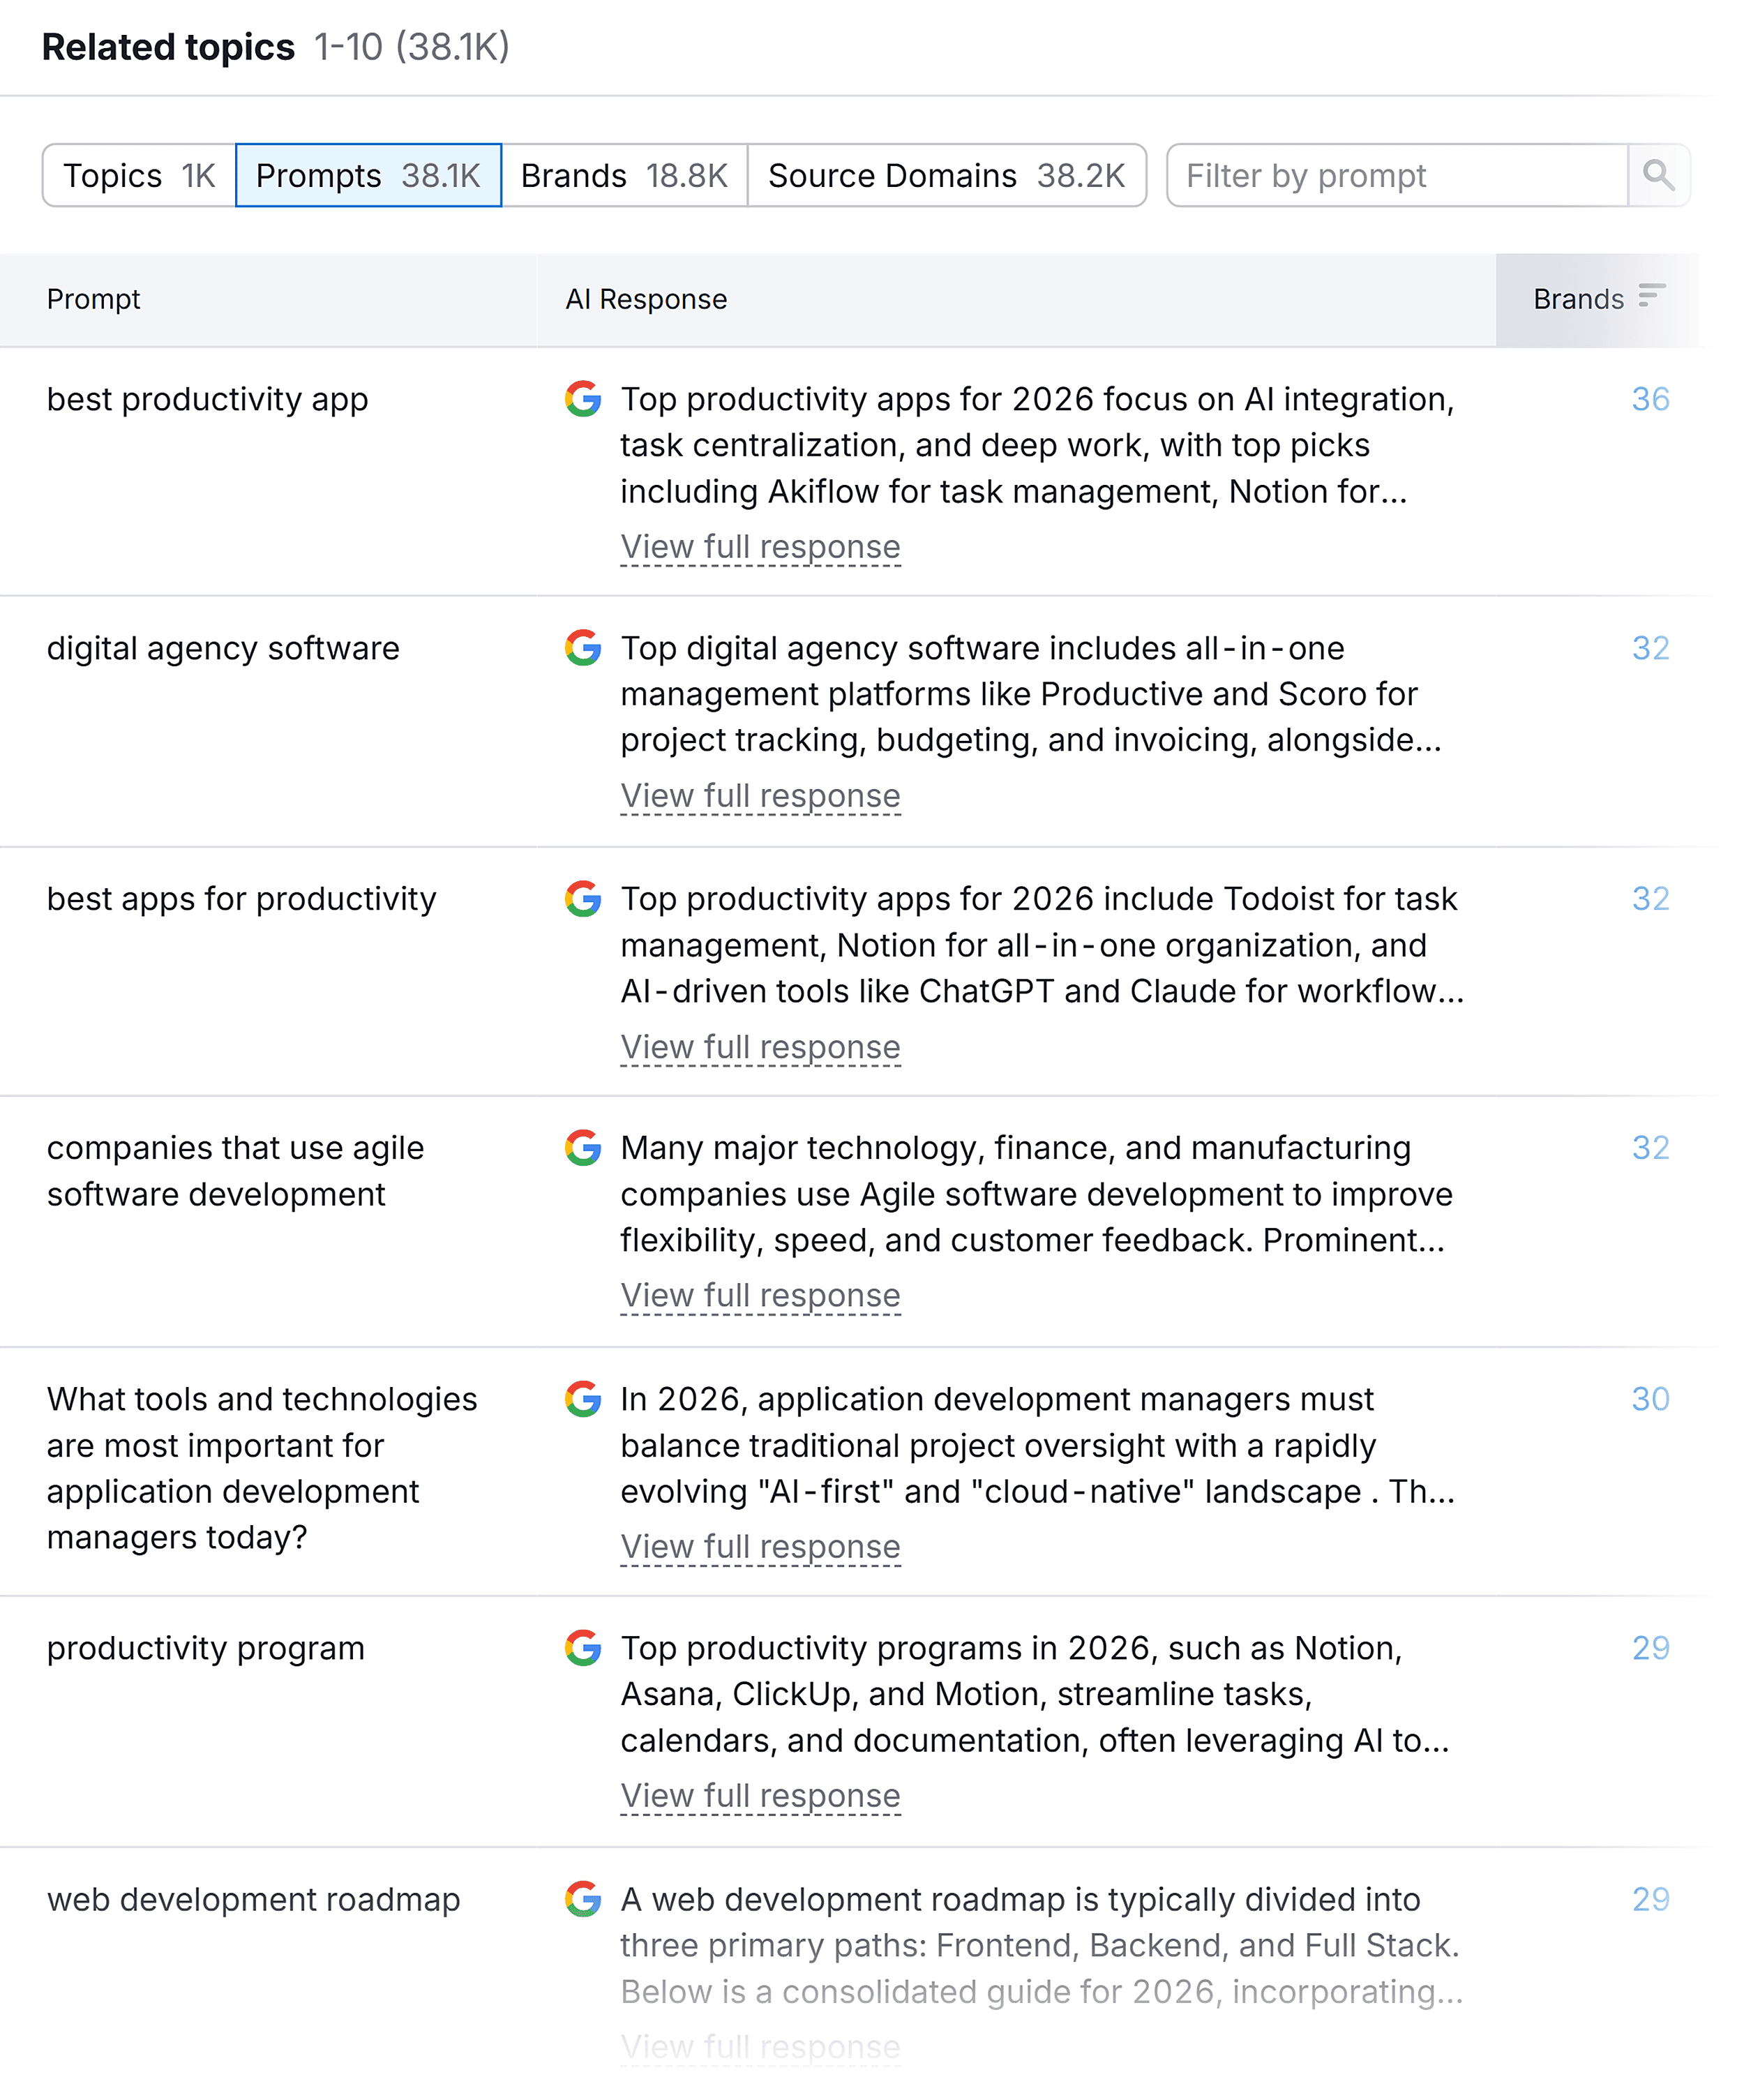
- Layer in Competitor Intelligence: Use tools like Semrush’s Keyword Gap to identify "missing" keywords that your competitors have already validated.
- Build an AI Prompt Library: Browse Reddit, Slack communities, and Facebook groups to see how your audience phrases their pain points. Turn these into prompts for AI tools.
Step 3: Calculate Your SoV
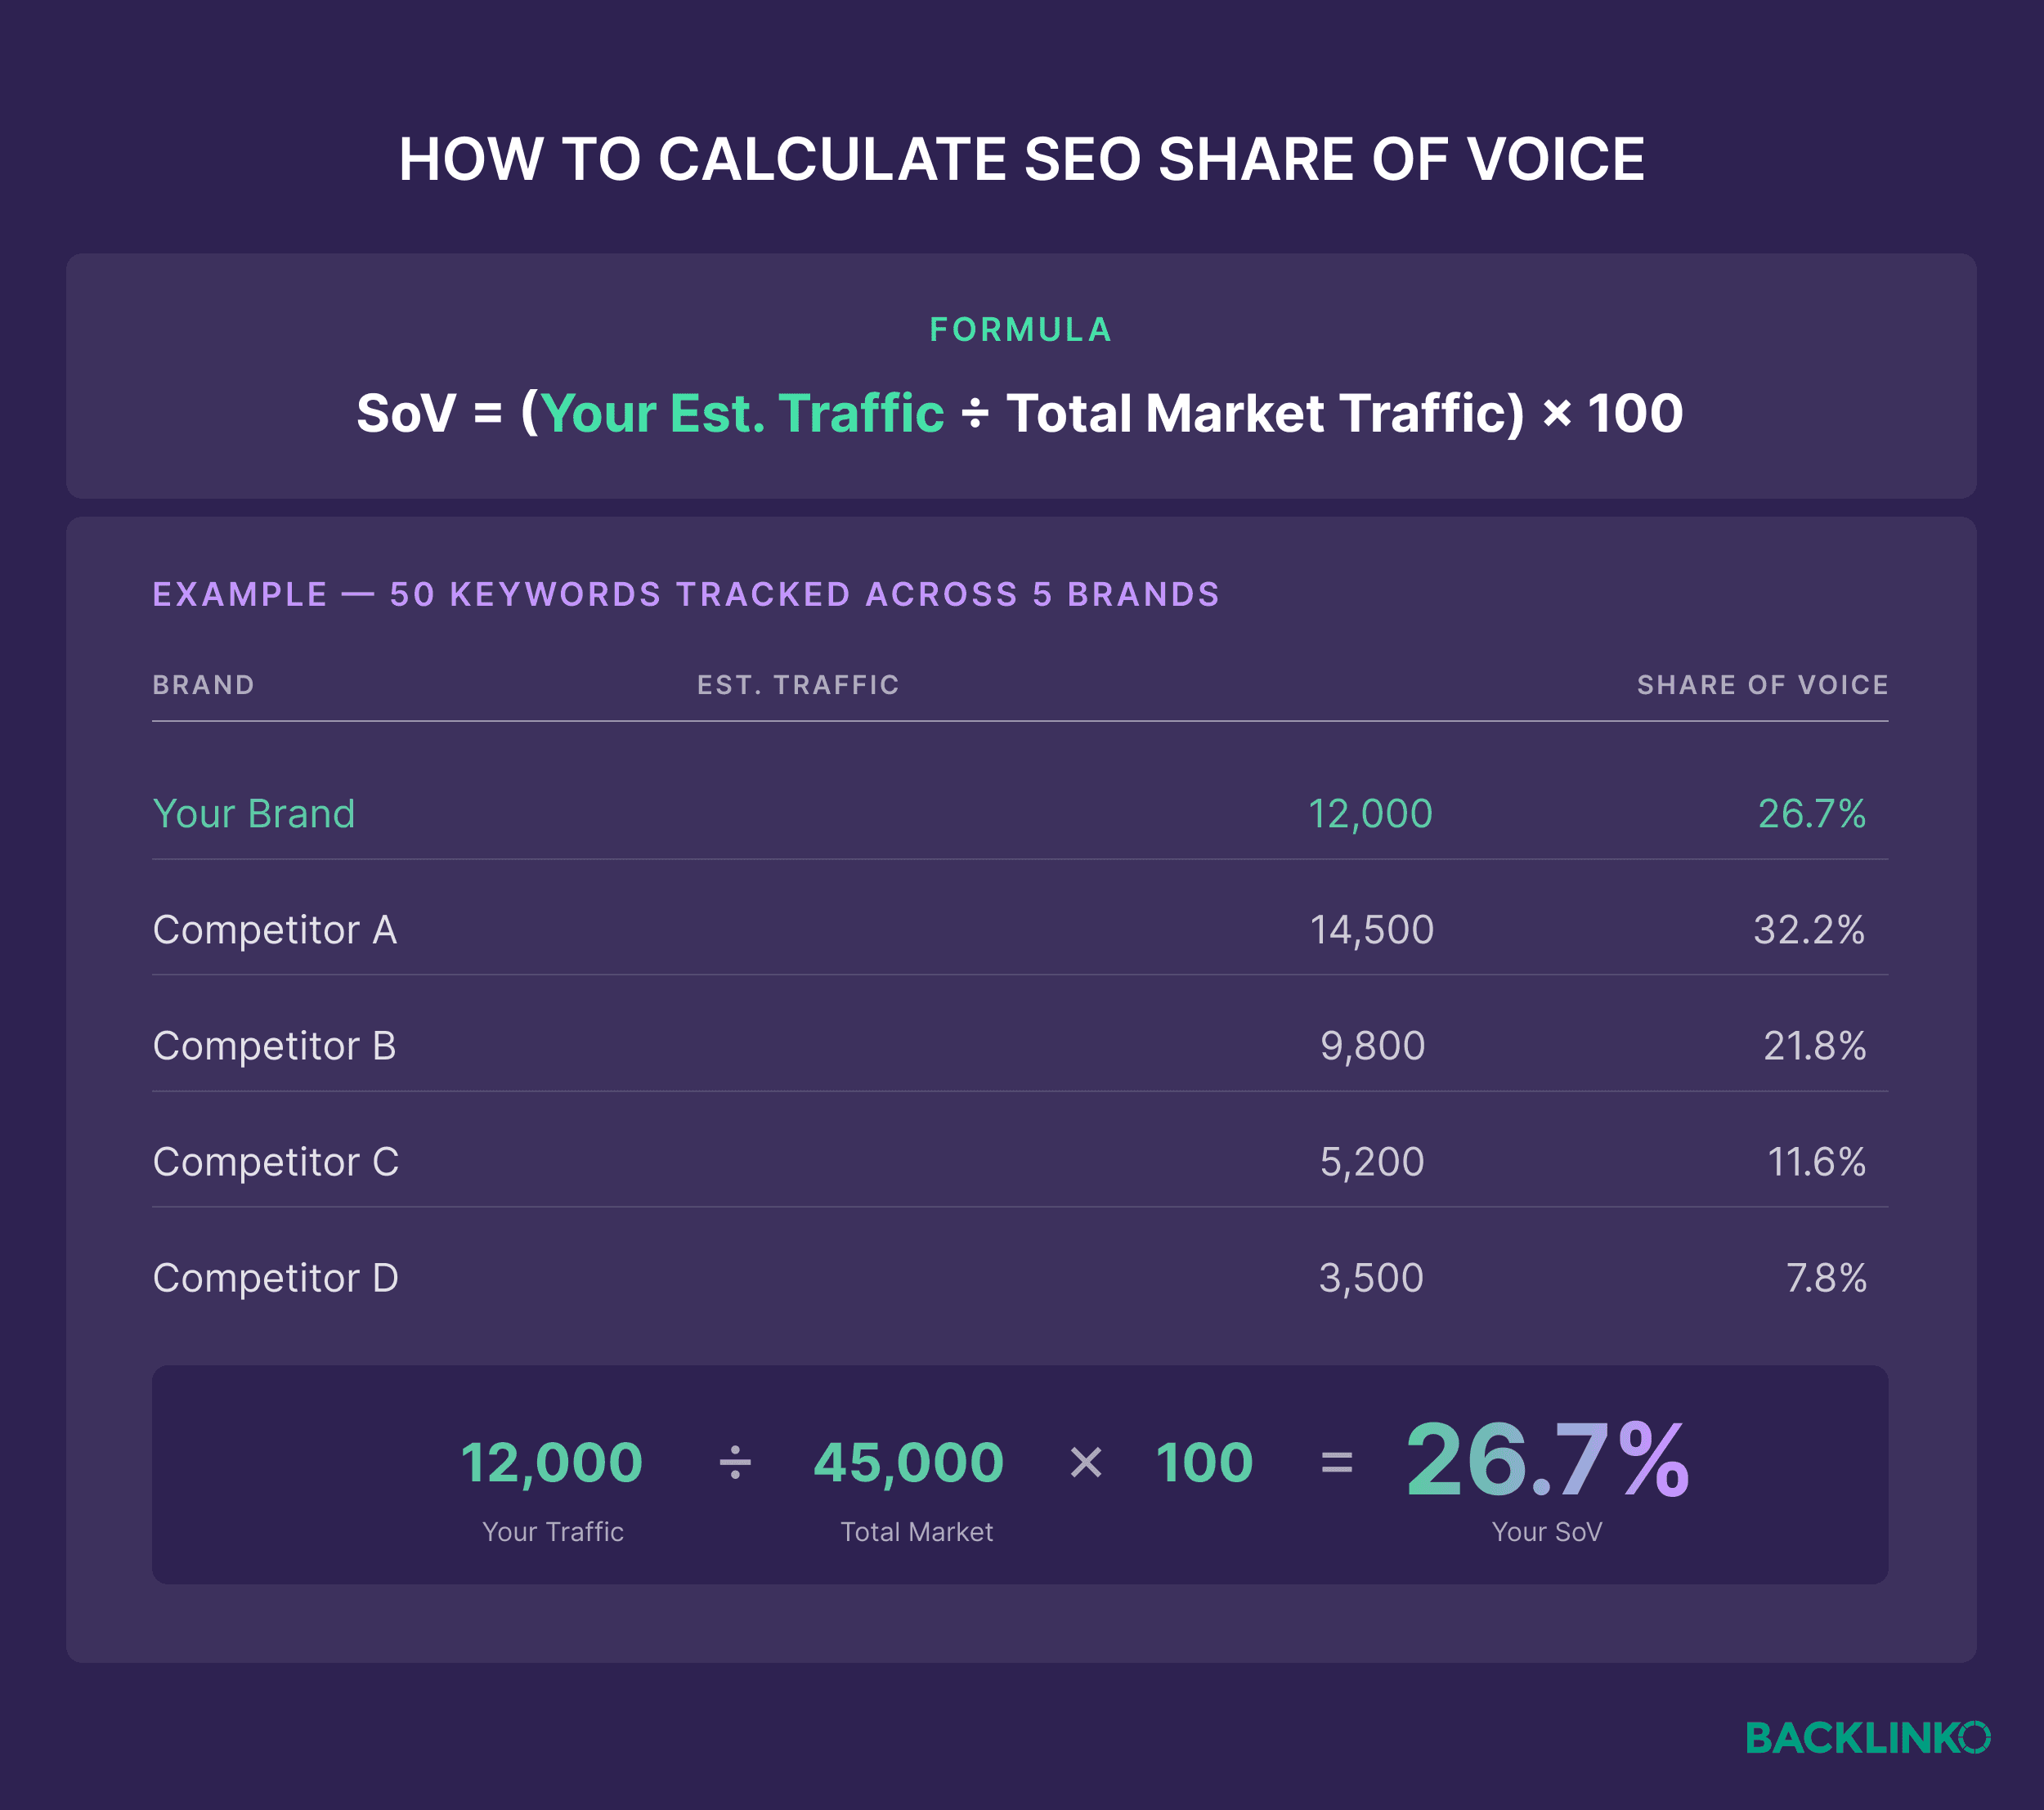
Your SoV formula is: *(Your Estimated Traffic / Total Category Traffic) 100.**
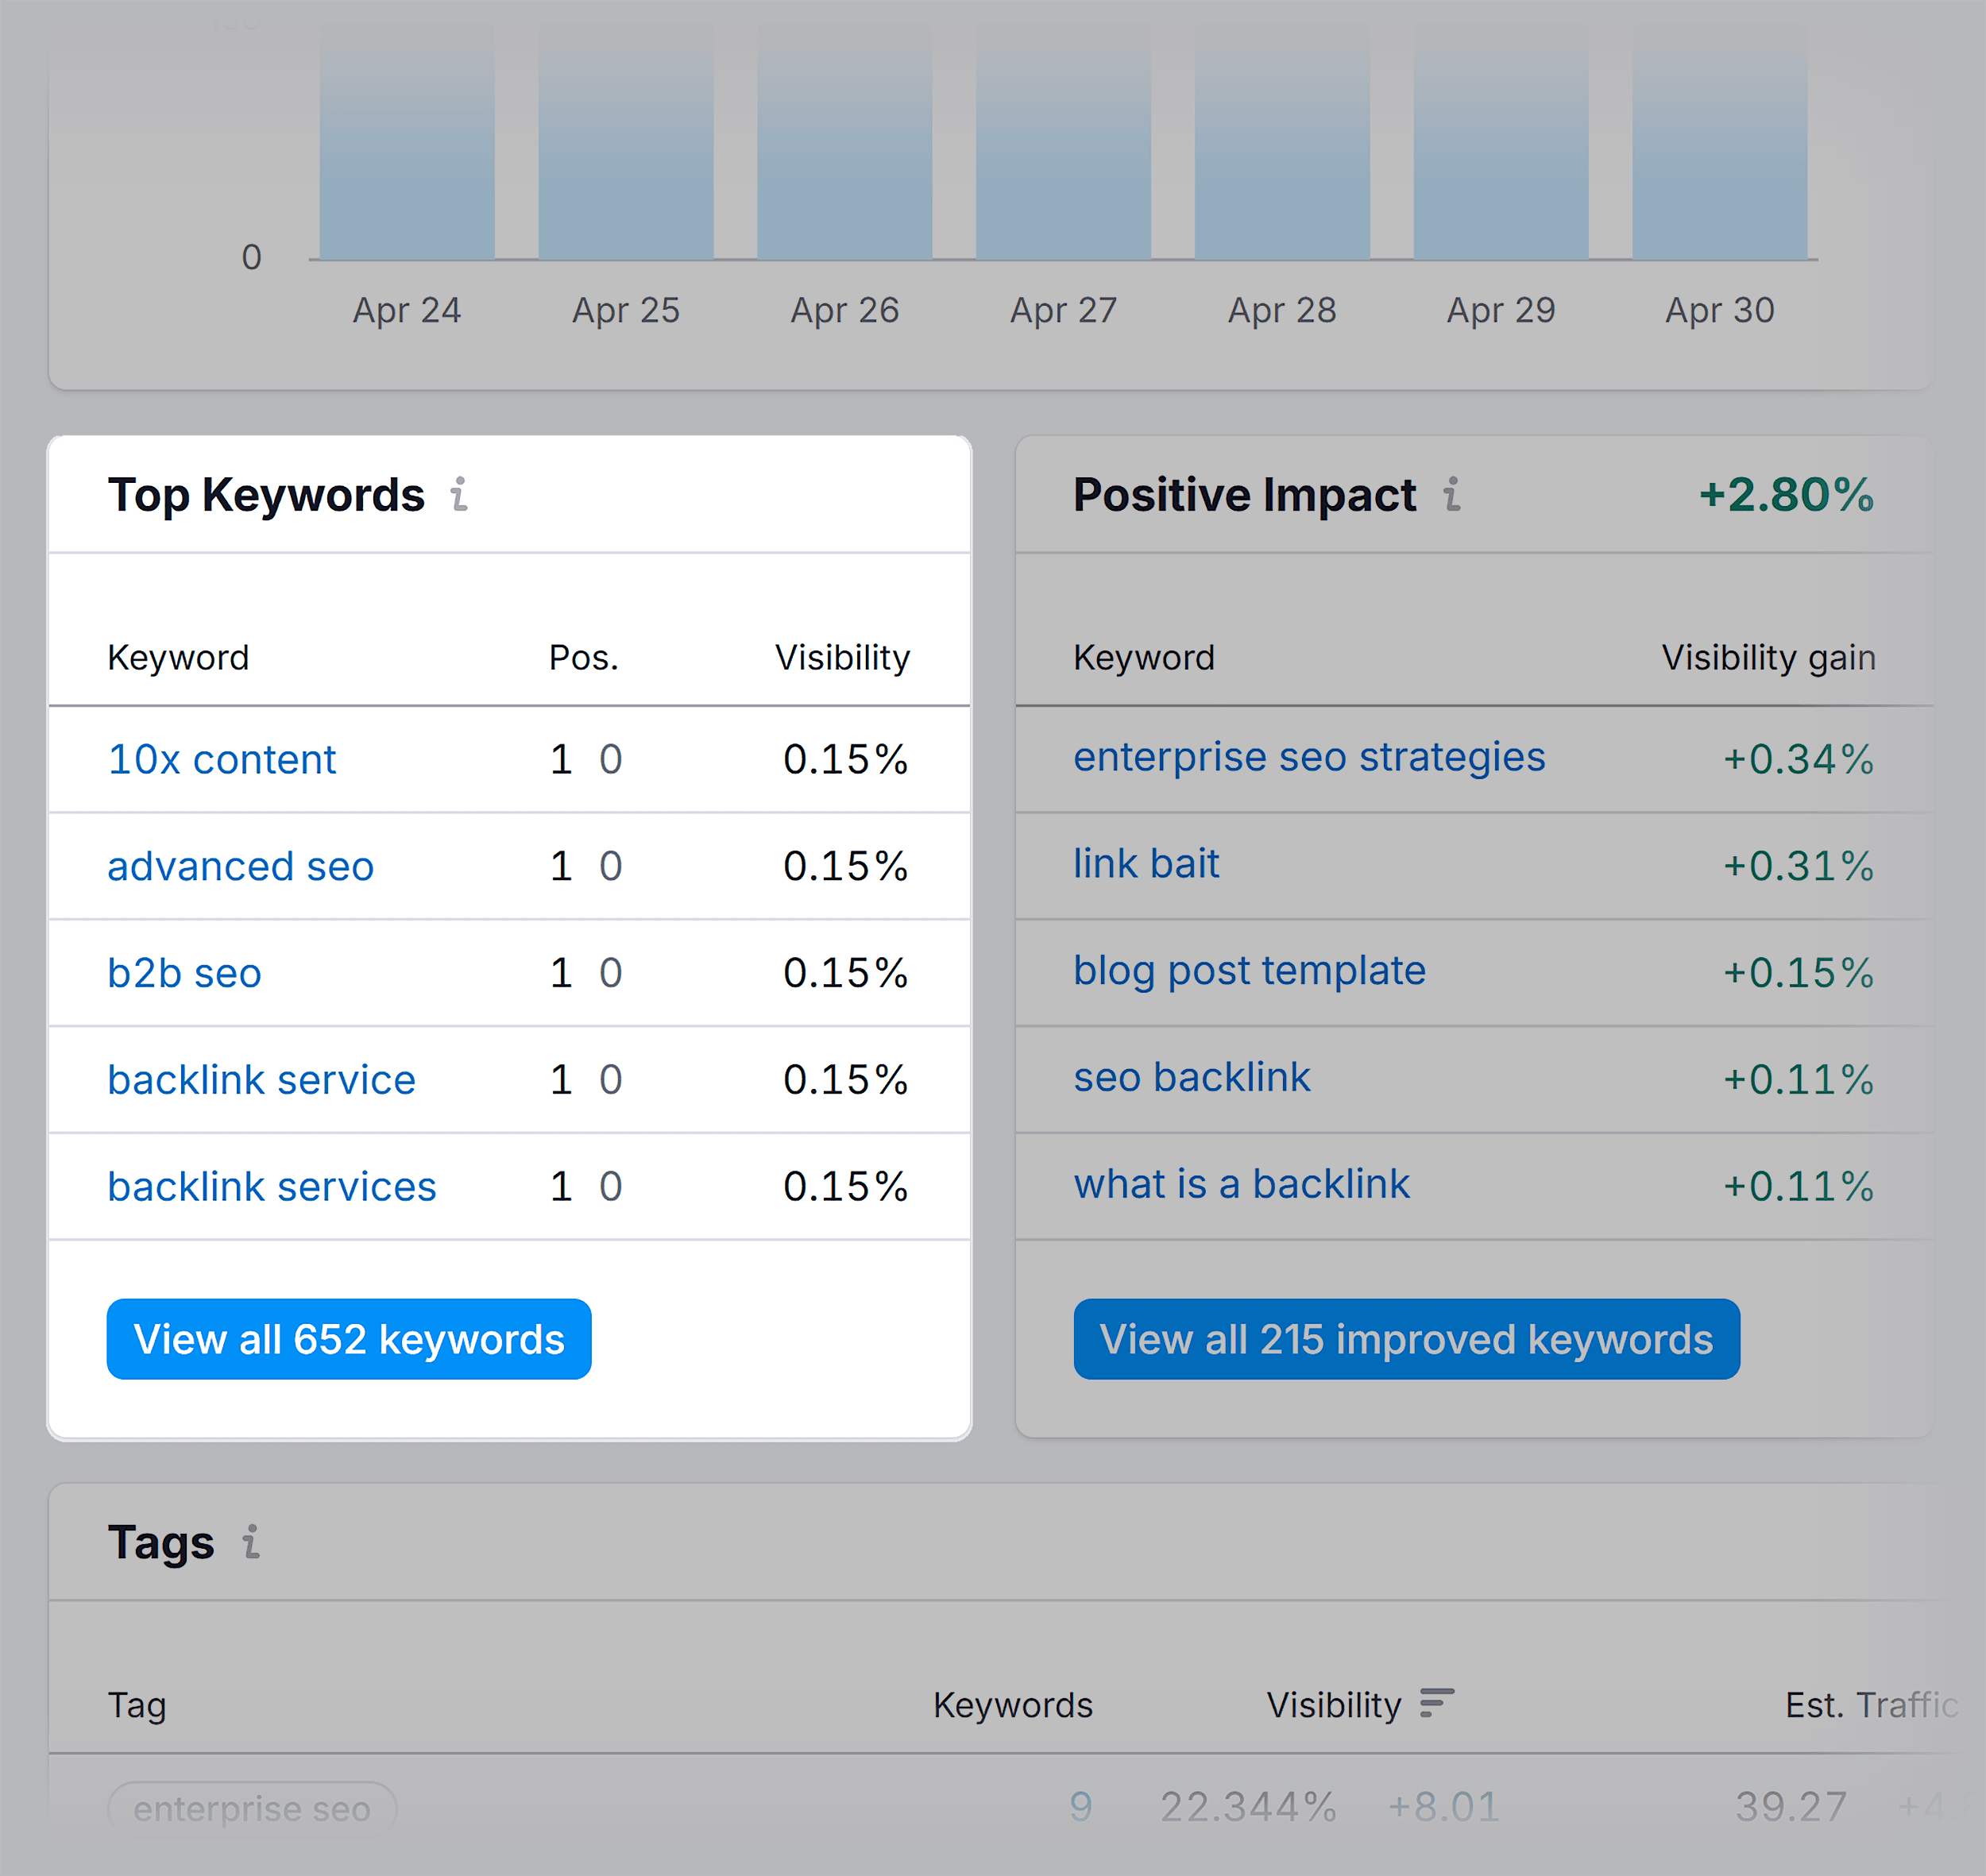
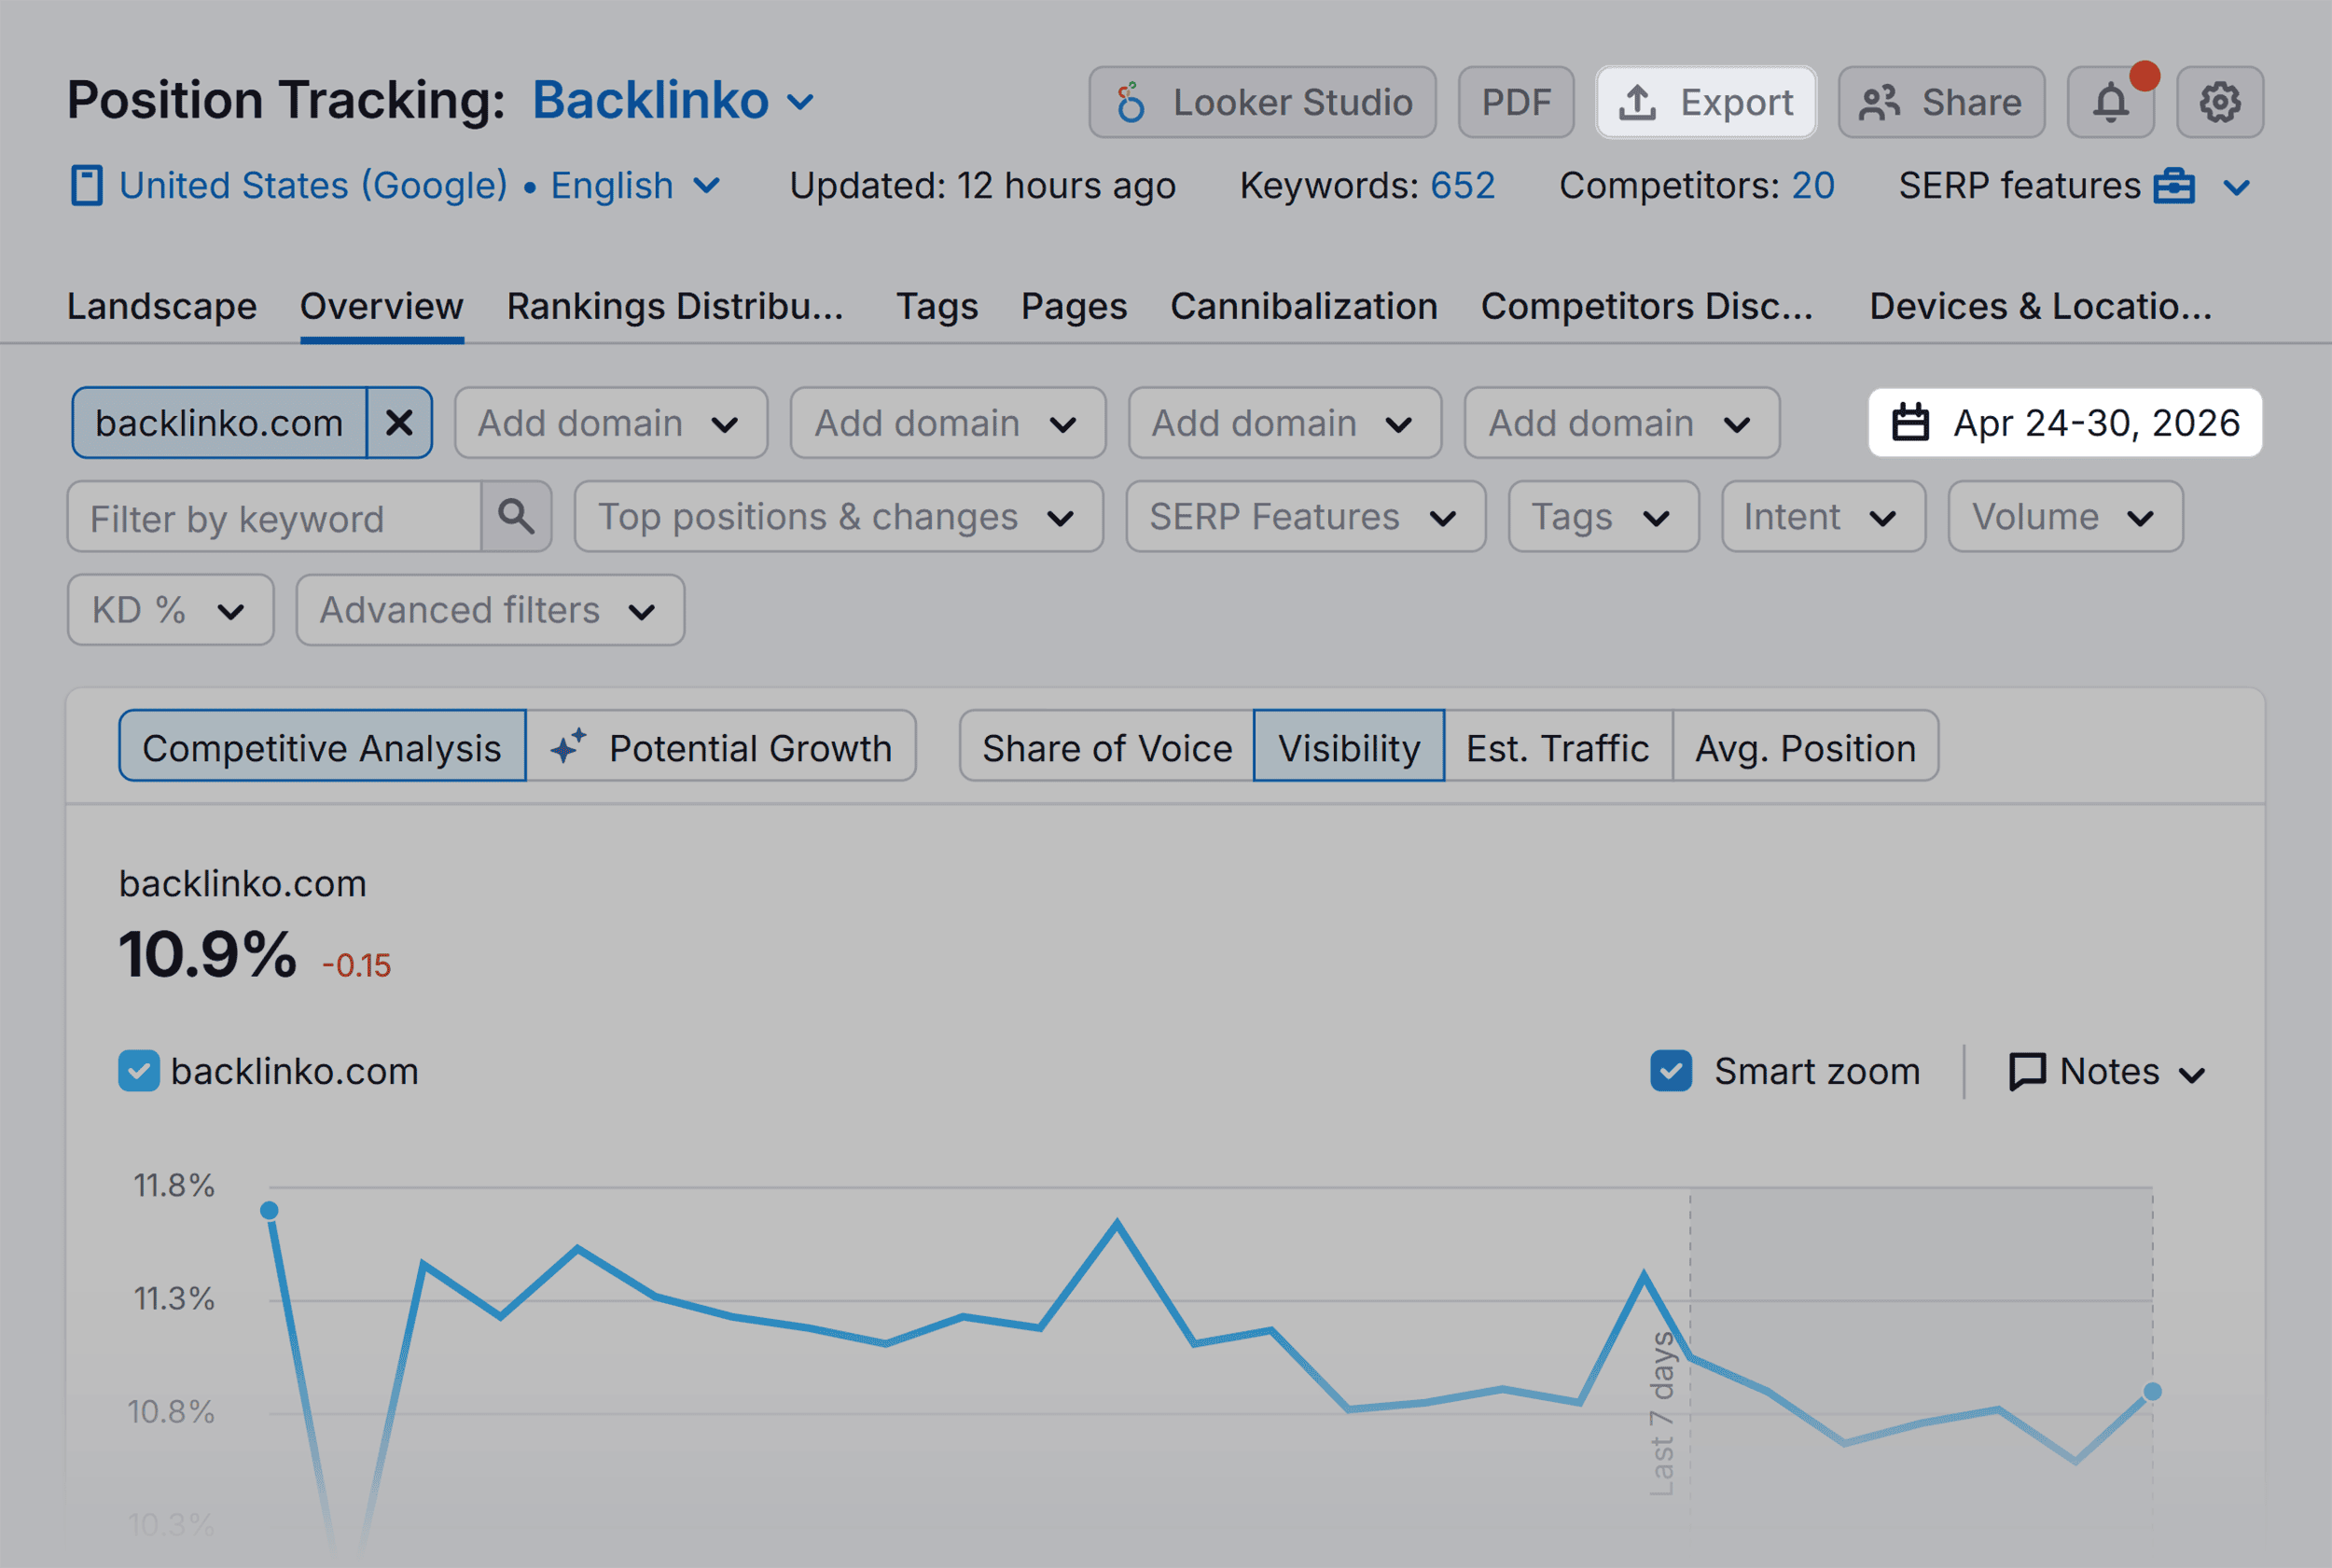
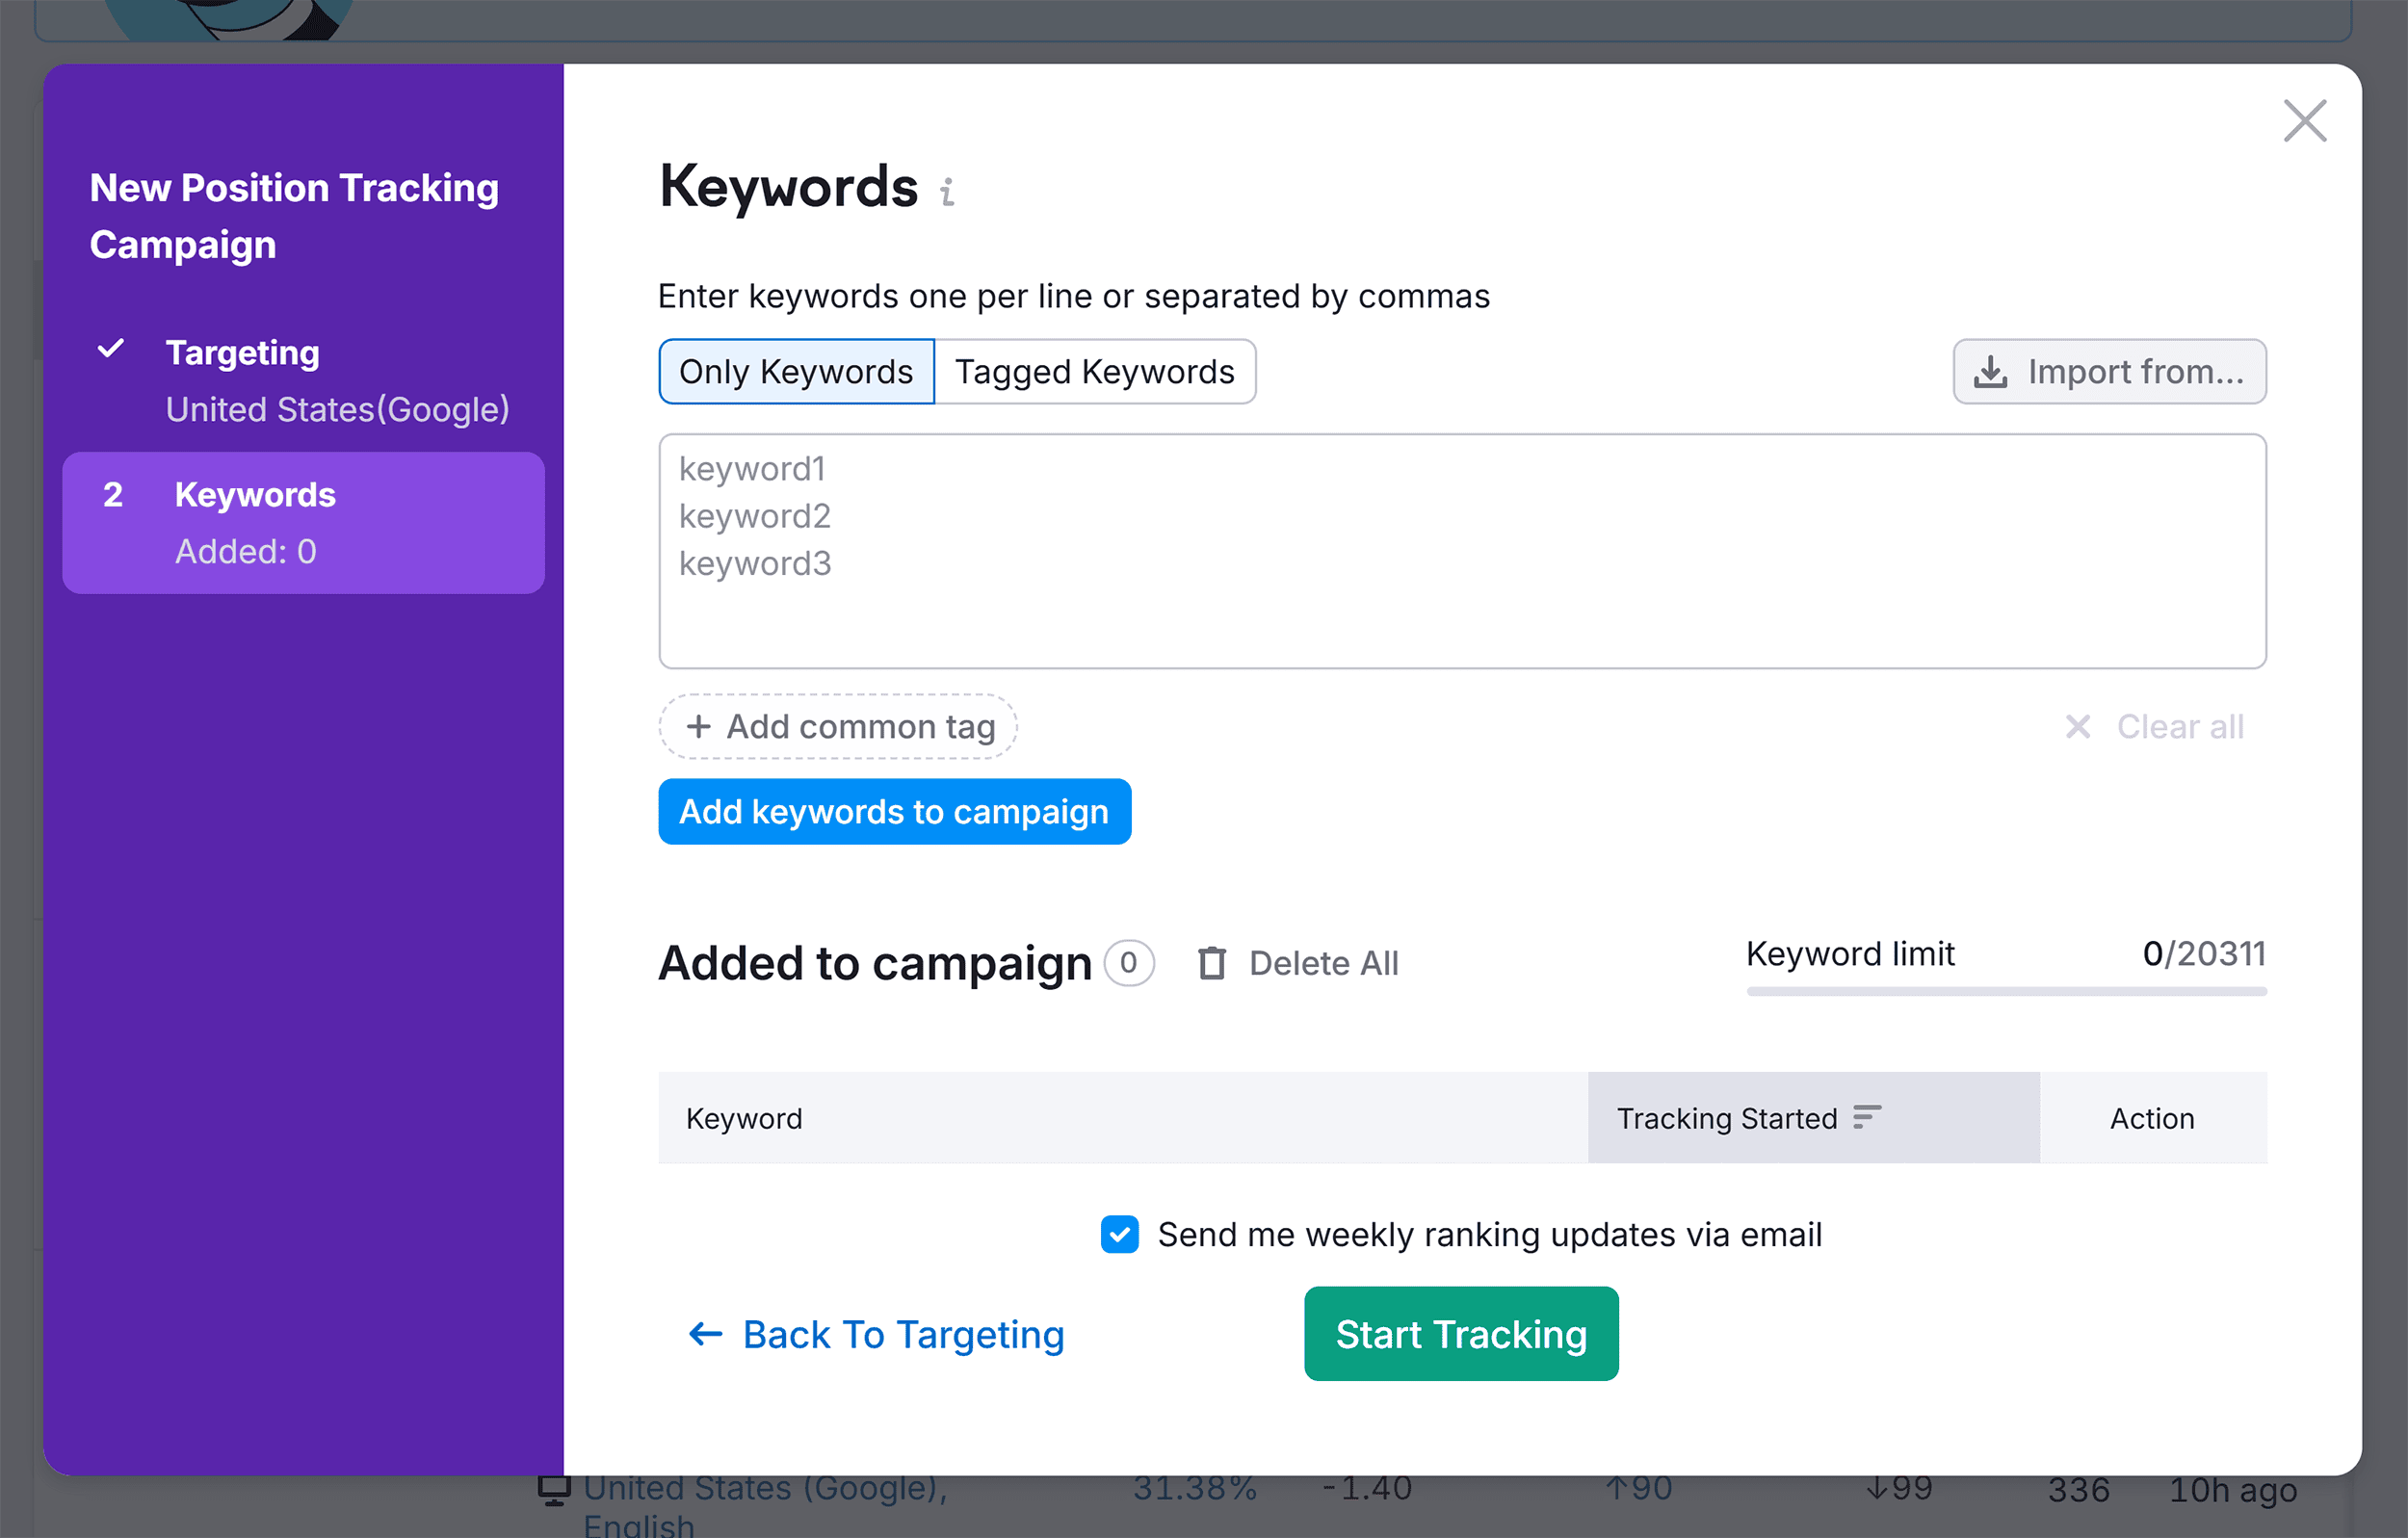
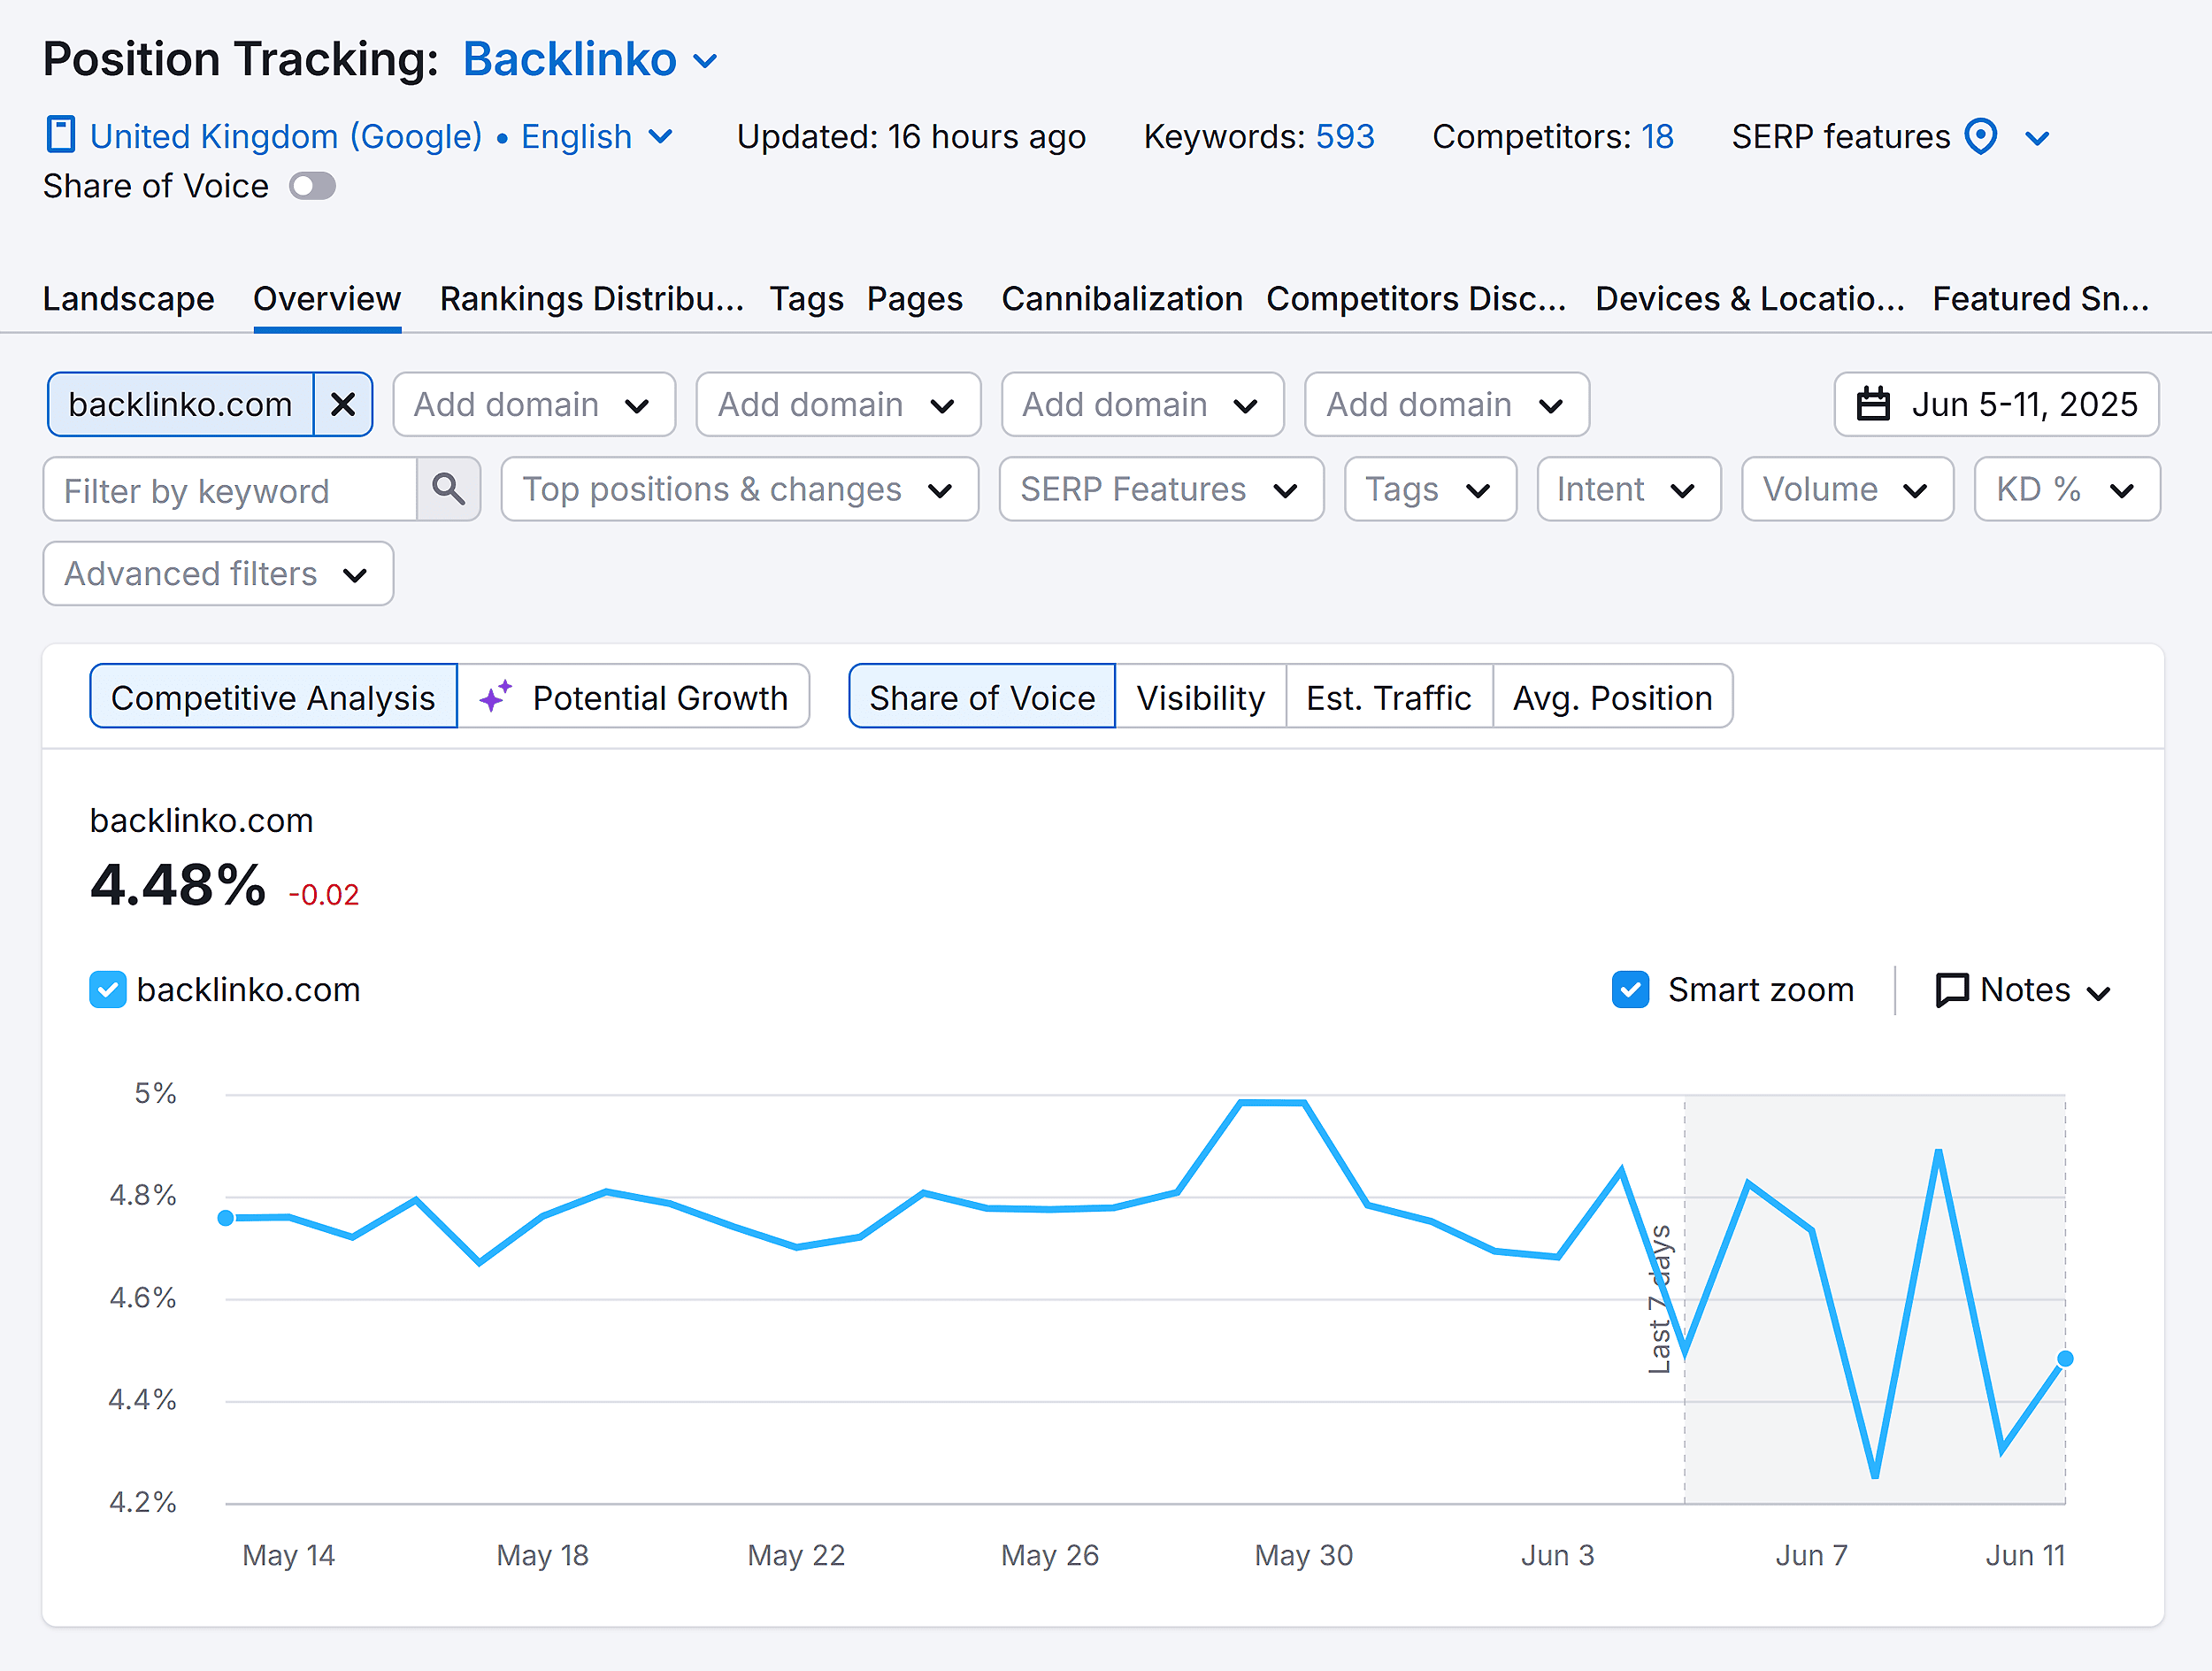
For SEO, use a rank tracker to monitor your positions for your keyword list. For AI SoV, use a two-step process: test your prompt library across major LLMs and track how often your brand is cited versus your competitors. While manual measurement is possible for a small subset, specialized AI Visibility Toolkits are becoming essential for tracking these trends at scale.
Step 4: Establish a Baseline and Track Trends
Once you have your initial data, create a baseline dashboard that captures three levels of detail:
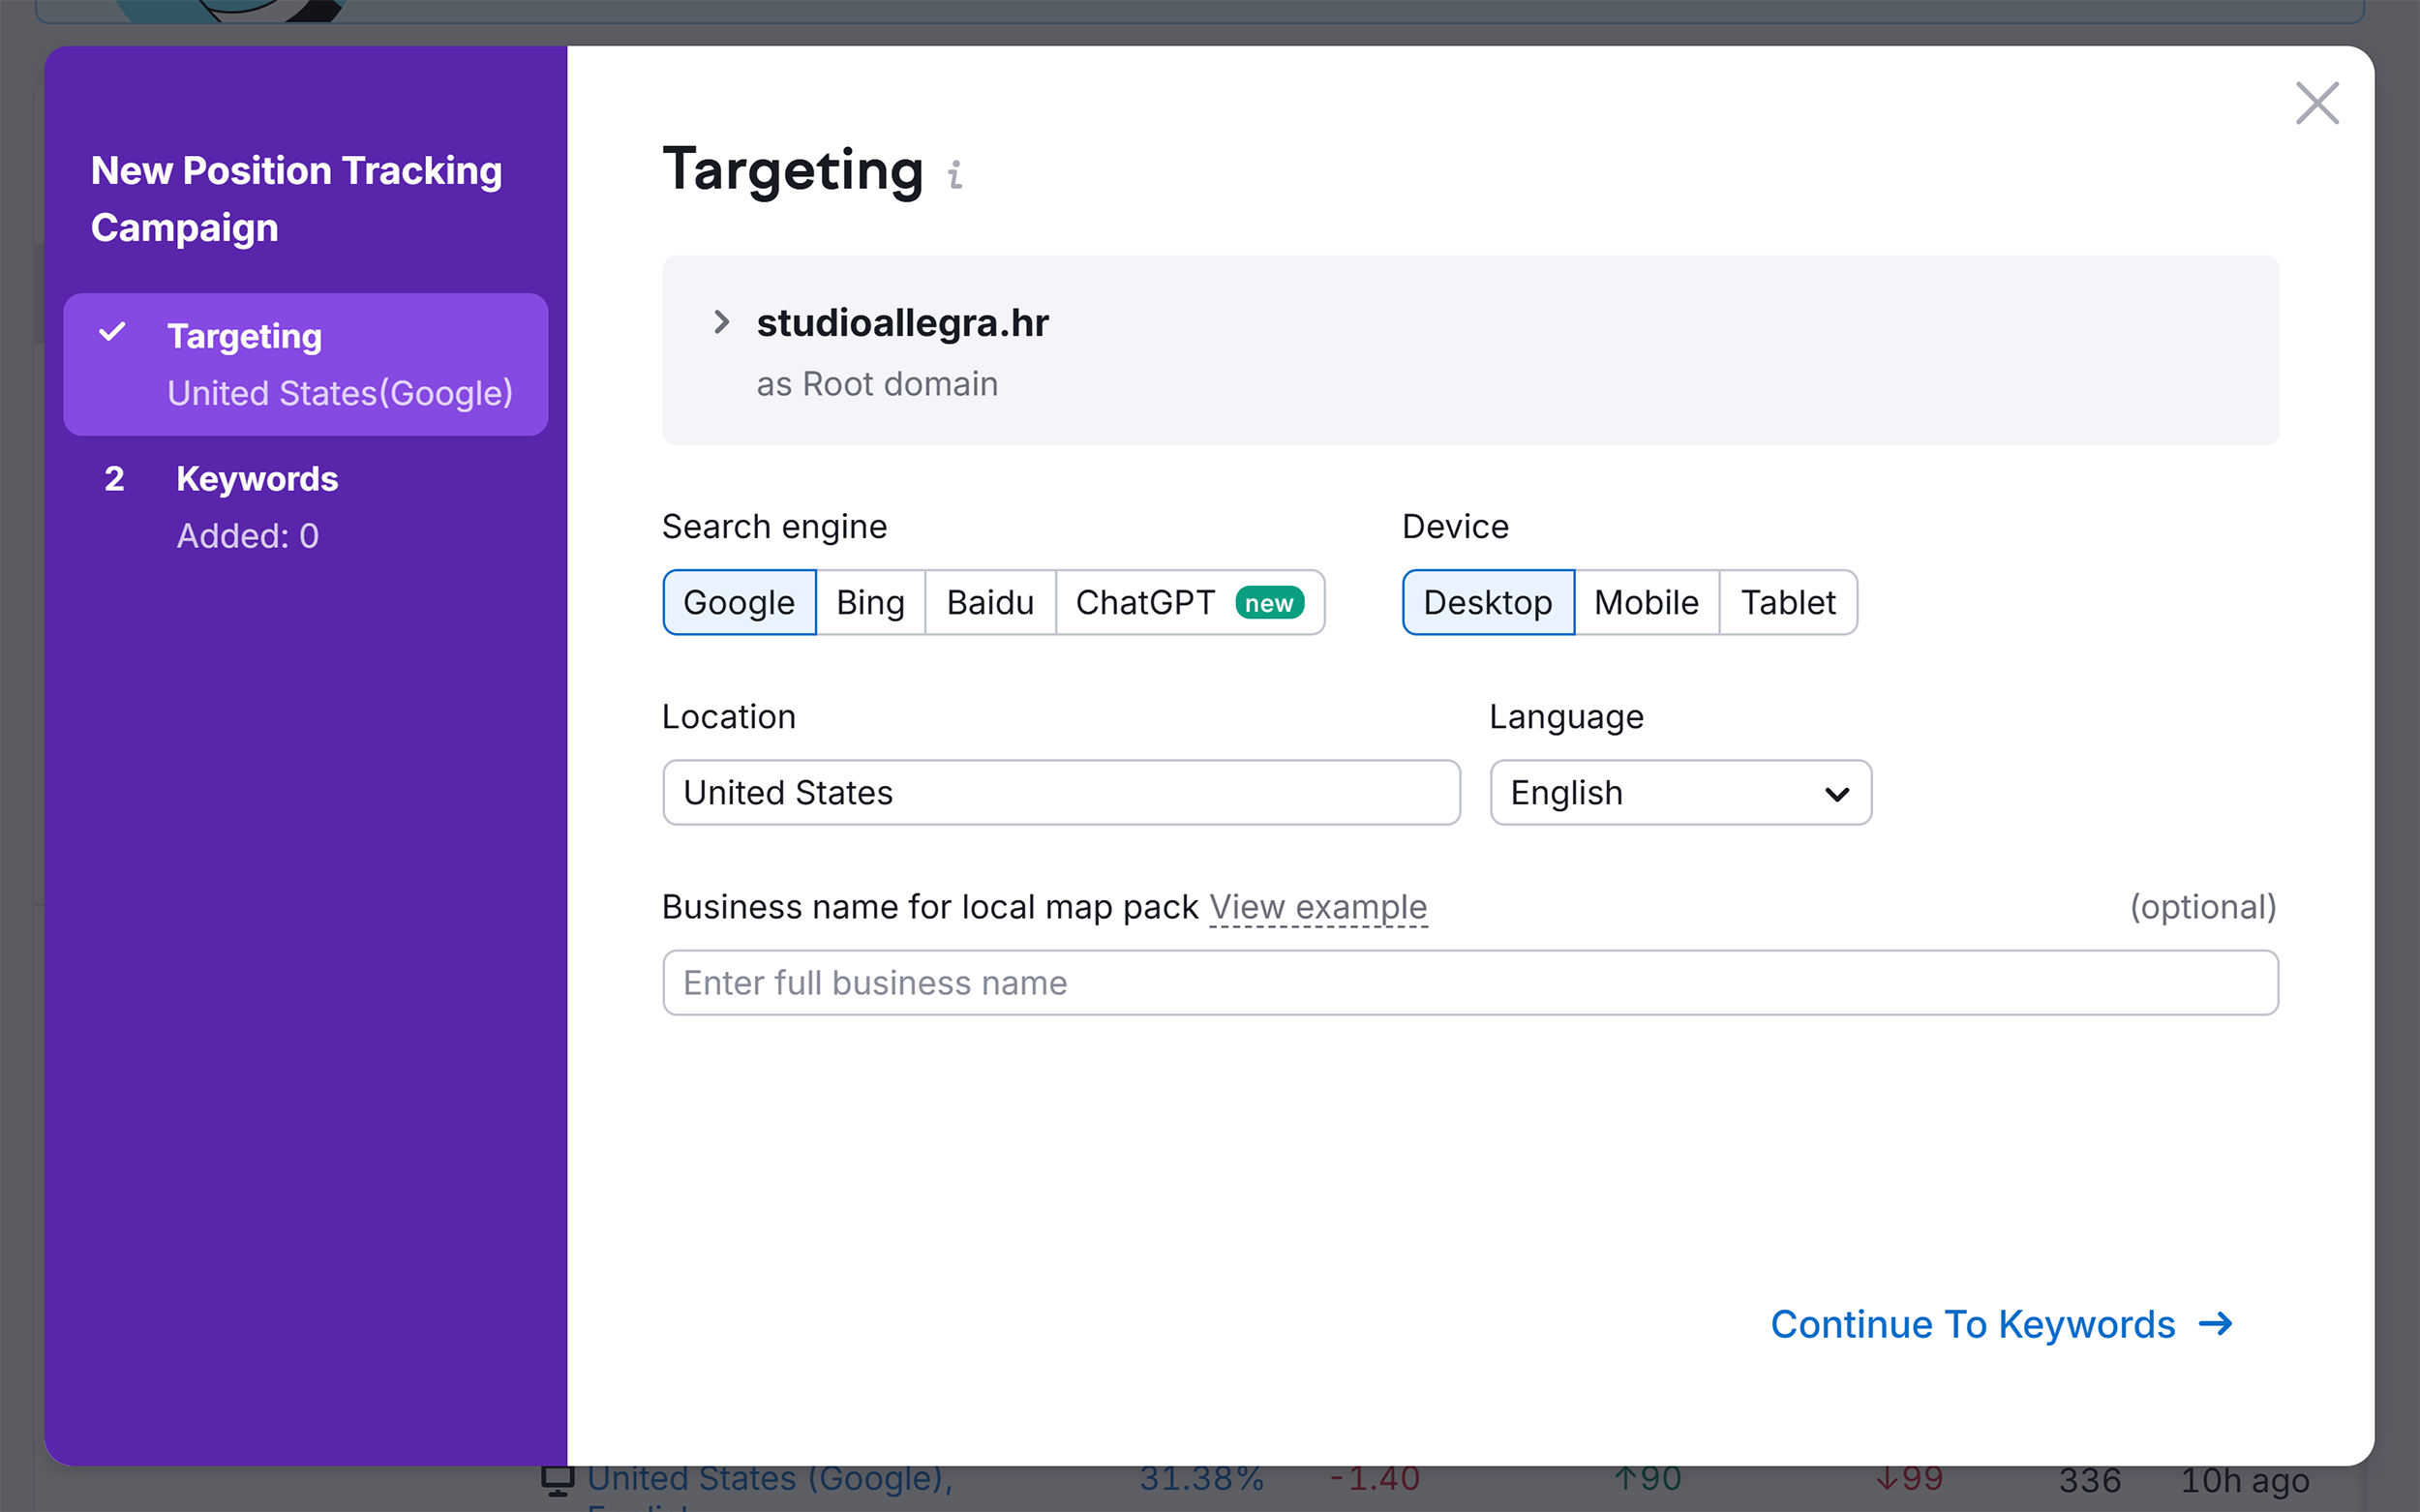
- Macro View: Total category share of voice.
- Segmented View: SoV by funnel stage.
- Micro View: SoV by specific topic cluster.
Set a monthly tracking cadence. Quarterly deep dives allow you to adjust your strategy without falling victim to short-term, daily noise.
How to Improve Your Share of Voice
Once you have identified your gaps, use the following framework to improve your standing:
- Close Visibility Gaps: For clusters where you have less than 10% SoV, prioritize the creation of "pillar pages" and comparison content. If you aren’t showing up for "Best X for Y" searches, you aren’t in the consideration set.
- Solve Efficiency Problems: If you have high SoV for a keyword but a 0% conversion rate, you are likely attracting the wrong audience. Shift your budget away from broad awareness and toward high-intent BoFu content like case studies and ROI calculators.
- Address Competitive Threats: If a competitor gains 5% SoV in your core, high-performing clusters, that is an early warning sign. Respond by optimizing your review profiles and increasing your engagement in the communities where they are winning.
The Future of Brand Visibility
In an era of fragmented attention, Share of Voice is no longer just a vanity metric; it is the most accurate reflection of your brand’s authority. By moving beyond the click and focusing on where and how you appear in the customer’s decision-making process, you gain a massive competitive advantage.

Start by measuring your current footprint. Identify where you are invisible, and begin the work of reclaiming your category. In 2026, those who measure visibility across the entire search spectrum will be the ones who own the conversation.