In the high-stakes world of digital advertising, the line between a data-driven strategy and a speculative gamble is often drawn by a single, nebulous term: "directional results." For marketing directors and CFOs, this phrase has become a hallmark of modern advertising reporting—a term that sounds sophisticated, scientific, and nuanced. But according to veteran analytics expert Avinash Kaushik, it is a convenient linguistic shroud that obscures the true risk behind massive advertising expenditures.
The core of the issue lies in how tech giants like Google frame the success of their advertising platforms. By examining the official guidance provided by Google for Brand Lift, Search Lift, and Conversion Lift studies, a troubling reality emerges: the incentives of the advertising platform are fundamentally misaligned with the incentives of the company footing the bill.
The Anatomy of "Directional" Insight
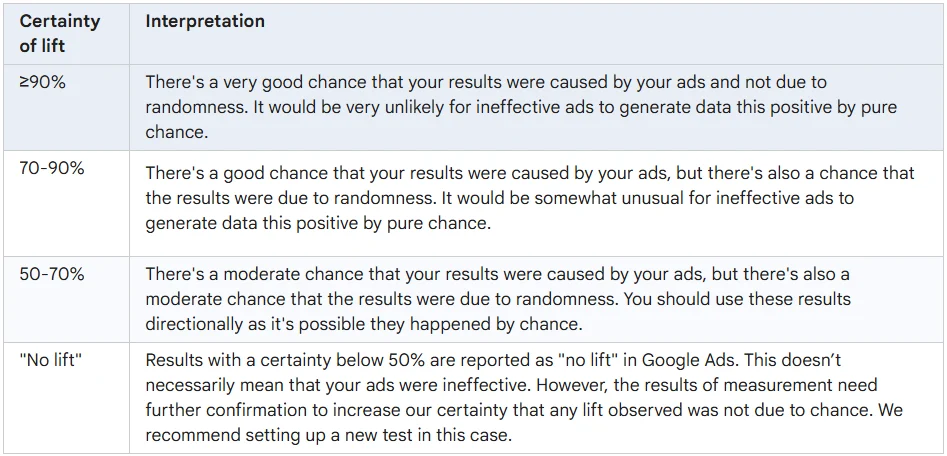
Google’s official documentation on lift studies breaks down statistical certainty into layers. A 90% certainty level is labeled a "very good chance," 70% to 90% is a "good chance," and 50% to 70% is a "moderate chance." The platform explicitly informs advertisers that studies reaching the 50% threshold can provide "valuable, directional insights."
To the casual observer, this may seem like a reasonable spectrum of confidence. However, when translated into the language of business finance, these categories become deeply problematic. Paraphrased, Google’s guidance effectively tells advertisers: "Your ads probably did something positive. If the results are lukewarm, don’t worry—just spend more money, and we’ll see if the trend continues."
This creates a "heads I win, tails you lose" scenario. If the campaign shows positive results, the advertiser is encouraged to scale. If the results are ambiguous or inconclusive, the advertiser is encouraged to treat them as "directional" and continue spending to "see what happens."
Chronology of a Misalignment
The disconnect between platform metrics and business reality has grown as advertising platforms have transitioned toward automated, black-box measurement tools.
- The Shift to Native Measurement: In years past, advertisers relied heavily on third-party verification to assess ad performance. As privacy regulations tightened and "walled gardens" grew, platforms like Google and Meta shifted toward first-party measurement tools (Brand Lift Studies).
- The Introduction of "Soft" Certainty: As these tools became standard, the terminology shifted. Rather than focusing on rigorous statistical significance (typically the 95% p-value standard in scientific research), platforms introduced labels like "good" or "moderate" chance.
- The Normalization of Ambiguity: By framing 50% to 70% certainty as "directional," platforms have effectively lowered the bar for what constitutes a "successful" campaign. This terminology has been adopted by agencies and internal marketing teams, creating a culture where statistical weakness is rebranded as strategic insight.
Supporting Data: The Replication Risk
The most damning critique of "directional" reporting comes from the concept of Replication Risk. When an advertiser sees a "70% certain" result, they are not just looking at a historical data point; they are looking at the probability that if they spent another $5 million under the same conditions, they would see a similar outcome.
Using Bayesian replication modeling—a technique used by biostatisticians to ensure that clinical trial results are not accidental—we can see the fragility of these "directional" findings.
If YouTube reports a +3-point lift in consideration with 70% certainty, the replication math is sobering:
- Probability of any positive lift in a repeat trial: ~65%.
- Probability of hitting the 90% certainty threshold in a repeat trial: ~30%.
In plain English, if you base your decision to spend an additional $5 million on a 70%-certain result, you have less than a one-in-three chance of seeing a result strong enough to confidently tell your CFO that the money was well spent. This is not a "good chance"—it is a high-risk gamble.
The Comparison Table: Google vs. The CFO
| Metric | Google’s View | CFO’s View |
|---|---|---|
| 50% – 70% Certainty | "Valuable, directional insight." | "Statistically indistinguishable from noise." |
| 70% – 90% Certainty | "A good chance of success." | "Insufficient evidence for budget scaling." |
| 90%+ Certainty | "Very good chance." | "The minimum threshold for investment." |
Official Responses and Platform Incentives
It is important to note that Google does include "drive-by" disclaimers in its documentation, advising clients to "interpret results based on your business needs and risk tolerance." However, critics argue that these disclaimers are insufficient.
Google’s primary incentive is to facilitate the continued flow of advertising dollars through its ecosystem. If a study provides even a modicum of evidence that an ad might have worked, the platform has no incentive to discourage the advertiser from spending more. Conversely, the advertiser’s goal is to ensure that every dollar spent generates a measurable, reliable return.
When a platform provides the tools, the inventory, and the measurement, the advertiser is effectively outsourcing their risk assessment to the entity that benefits most from the risk being taken.
Strategic Implications: Taking Back Control
For senior marketing leaders, the implications of this data-driven opacity are clear: You must stop outsourcing your risk tolerance.
1. Establish a Minimum Evidence Floor
Decision-makers should set a hard internal standard for what constitutes a "successful" test. For many, this should be a 90% or 95% certainty threshold. If a study falls below this, it should not be used to justify further investment.
2. Understand "Type S" and "Type M" Errors
Weak evidence is dangerous because it can fail twice. First, the effect may not replicate (Type S, or sign error). Second, the apparent impact of the ad may be significantly overstated (Type M, or magnitude error). A 3-point lift may appear promising, but the true effect could be far smaller, or even zero.
3. Build Independent Measurement Models
Relying solely on the platform’s internal reporting is a strategic vulnerability. Sophisticated organizations are increasingly building their own "Truth Models"—using Bayesian frameworks to test the validity of platform-provided data. This allows teams to input their own spend data and calculate the actual replication risk before committing additional capital.
4. Demand Transparency from Agencies
Many agencies benefit from high-spend environments. When an agency presents "directional" results as a justification for increasing a budget, they are mirroring the platform’s incentives. Leaders must ask: "What is the replication risk of this campaign?" and "Would you stake your own performance bonus on this result?"
Conclusion: The "Carpe Diem" Approach
The takeaway for the modern marketing executive is not that Google’s tools are useless, but that they are designed to serve the platform’s bottom line, not the client’s. "Directional" insights may be helpful for low-stakes creative testing or early-stage hypothesis generation. However, when large-scale capital allocation is on the line, "directional" is often just another word for "unproven."
As the industry continues to move toward automated, opaque reporting, the burden of proof falls on the advertiser. By ignoring the comforting but misleading labels provided by ad platforms and instead focusing on the cold, hard math of replication risk, companies can safeguard their budgets and ensure that their growth is built on a foundation of evidence, not merely a "good chance."