
In the modern digital landscape, data is often touted as the "new oil." However, for many marketing teams, it feels more like a flood. You are likely tracking thousands of data points across dozens of platforms, yet when it comes time to optimize a landing page or refine a campaign, the path forward remains obscured by noise.
Most marketers treat analytics as an afterthought—a report to be pulled once a campaign has already run its course. This is a critical error. The difference between companies that see consistent, compounding conversion improvements and those stuck in a cycle of stagnation is not the volume of data they collect, but the precision with which they measure it before the first test is ever launched.
Defining Success: Moving Beyond Vanity Metrics
The most common trap in Conversion Rate Optimization (CRO) is the obsession with "vanity metrics"—data points that look impressive on a slide deck but have zero correlation with your bottom line. To move the needle, you must shift your focus from generic KPIs to outcome-focused goals.
The Problem with "Improvement"
When a team sets a goal to "increase conversion rate," they are setting themselves up for failure. It is a vague target that lacks context. Instead, industry leaders align their CRO strategy with the specific stages of their sales funnel.
For instance, if your business requires 50 new customers per month to hit revenue targets and your current lead-to-customer conversion rate is 10%, your objective isn’t just "more conversions"; it is specifically "500 qualified leads per month." By working backward from your revenue goals, you create a North Star metric that dictates which experiments are worth your time.

The Role of Micro-Conversions
Macro-conversions (purchases or form submissions) are the end result, but they are infrequent. If you only measure these, you are flying blind for weeks at a time. This is why tracking micro-conversions—the "singles and doubles" of the digital journey—is essential. These include:
- Video completion rates for product demos.
- Time spent on pricing pages.
- Clicks on "View Documentation" or "Case Study" links.
- Scroll depth on long-form content.
By tracking these, you can identify where friction begins, often long before the user reaches the checkout page. If users watch your product video but fail to click the "Get Started" button, you have identified a clear, actionable disconnect between your value proposition and your call-to-action.
The Anatomy of an Analytics Workflow
To stop guessing, you must build a framework that separates actionable data from background noise.
Funnel Analysis: Finding the Leaks
Think of your website as a leaky bucket. Funnel reports provide the "x-ray vision" required to locate the holes. By breaking down your conversion path—Landing Page → Pricing → Checkout → Thank You—you can isolate exactly where your prospects are abandoning ship.
A 40% drop-off between the pricing page and the cart is not a marketing problem; it is a signal that your pricing structure or value-add is failing to convince the user at a critical moment. When you segment this funnel by traffic source, the insights become even sharper. You might discover that paid social traffic is "bouncing" because the landing page content doesn’t match the promise of the ad, whereas organic traffic is converting at a higher rate.

Filtering the "Lies" in Google Analytics
Standard analytics packages, such as Google Analytics, can be misleading if taken at face value. A high bounce rate, for example, is often viewed as a failure. However, if a user visits your "Contact" page, finds the phone number, and leaves, they have technically "bounced" despite having a perfect user experience.
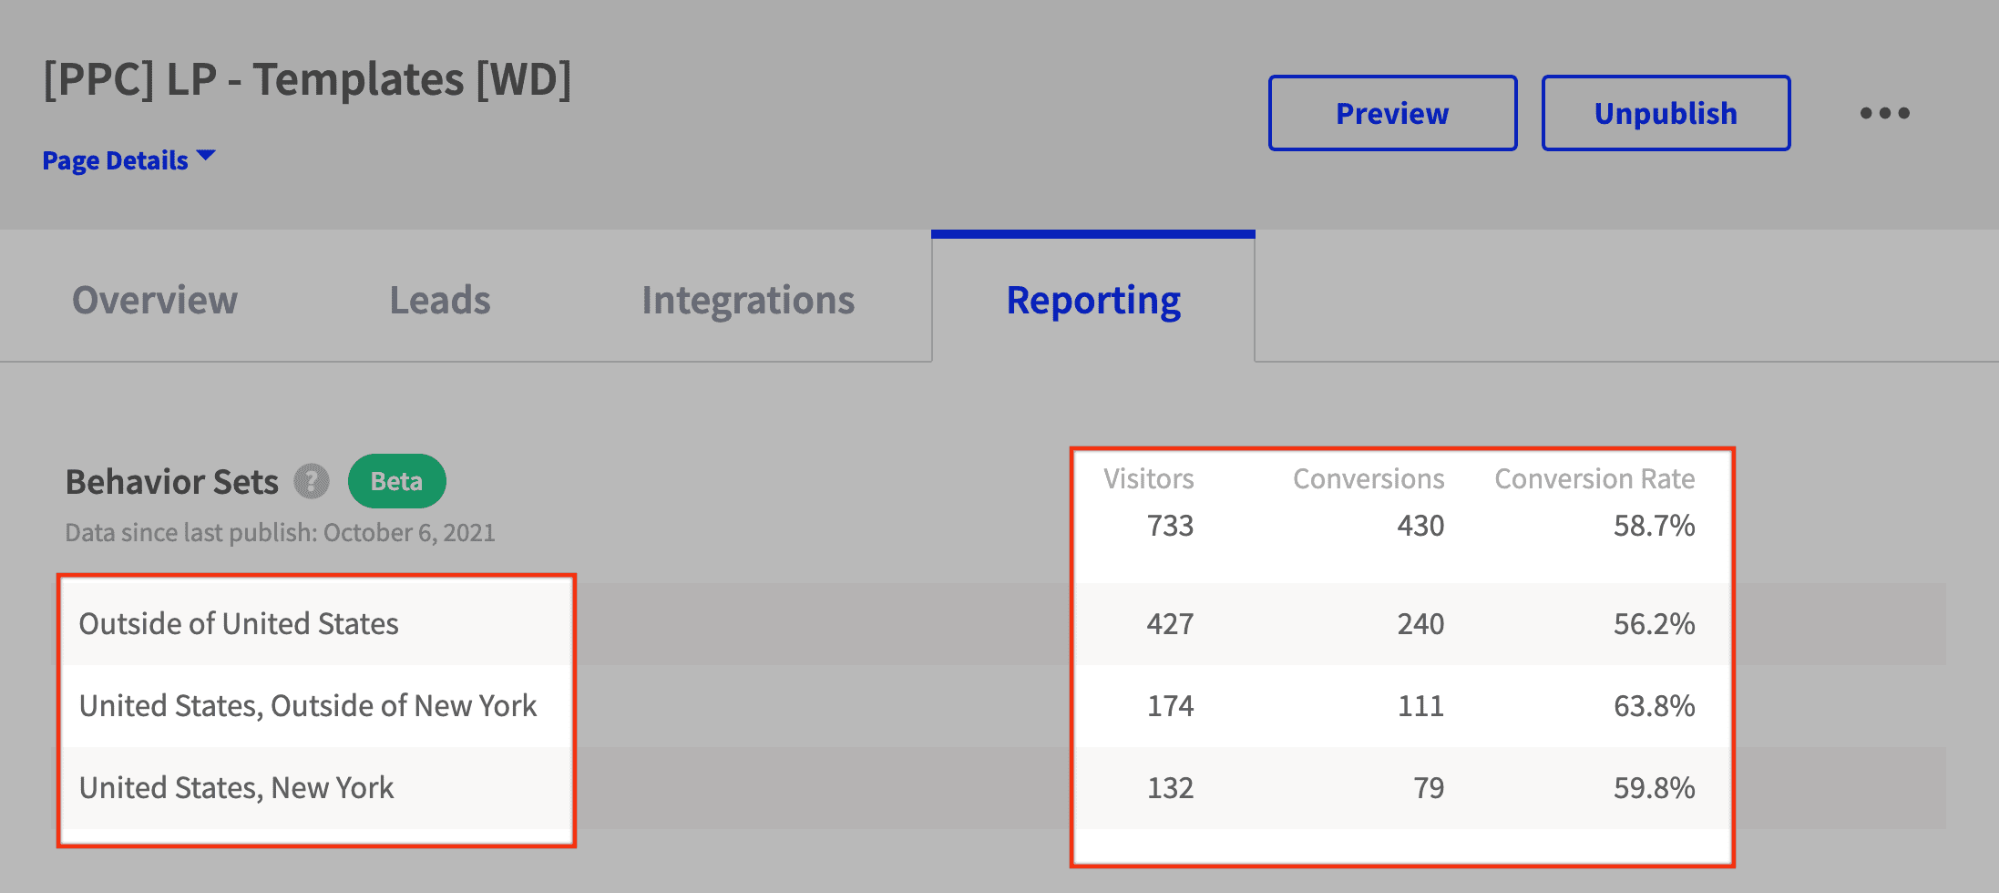
The remedy is ruthless segmentation. By segmenting data by device, browser, and traffic source, you can uncover hidden truths. Current benchmark reports indicate that while 83% of landing page visits occur on mobile devices, desktop conversion rates often remain 8% higher. Without segmenting your analytics by device, you might be blaming your copy for a problem that is actually a mobile-responsive design failure.
Adding the "Why": Qualitative Research
Quantitative data tells you what is happening; qualitative research tells you why. Without this, you are looking at a map but missing the terrain.
Heatmaps and Session Recordings
Heatmaps provide a visual representation of user behavior. If you see a cluster of clicks on a non-clickable image, your users are expressing a desire for interaction that your design isn’t fulfilling. Session recordings act as a digital "shoulder-surfing" tool, allowing you to watch real users struggle with your navigation or get confused by your form fields. These visual cues often reveal UX bottlenecks that no spreadsheet could ever highlight.
The Voice-of-Customer (VoC)
Surveys are your most direct line to the truth. By deploying exit-intent surveys—such as asking, "What is the one thing that stopped you from signing up today?"—you can gather qualitative feedback that turns your optimization strategy on its head. Often, the reason for a low conversion rate is something as simple as a missing piece of information, such as a lack of clarity on your refund policy or phone support availability.
Building Hypotheses: The Scientific Method for Marketing
A robust CRO program is built on evidence-based hypotheses, not "best practices" or gut feelings. Every test should follow a standard formula:
"Because we observed [data point/insight], if we [make this specific change], then [this metric] will [increase/decrease]."
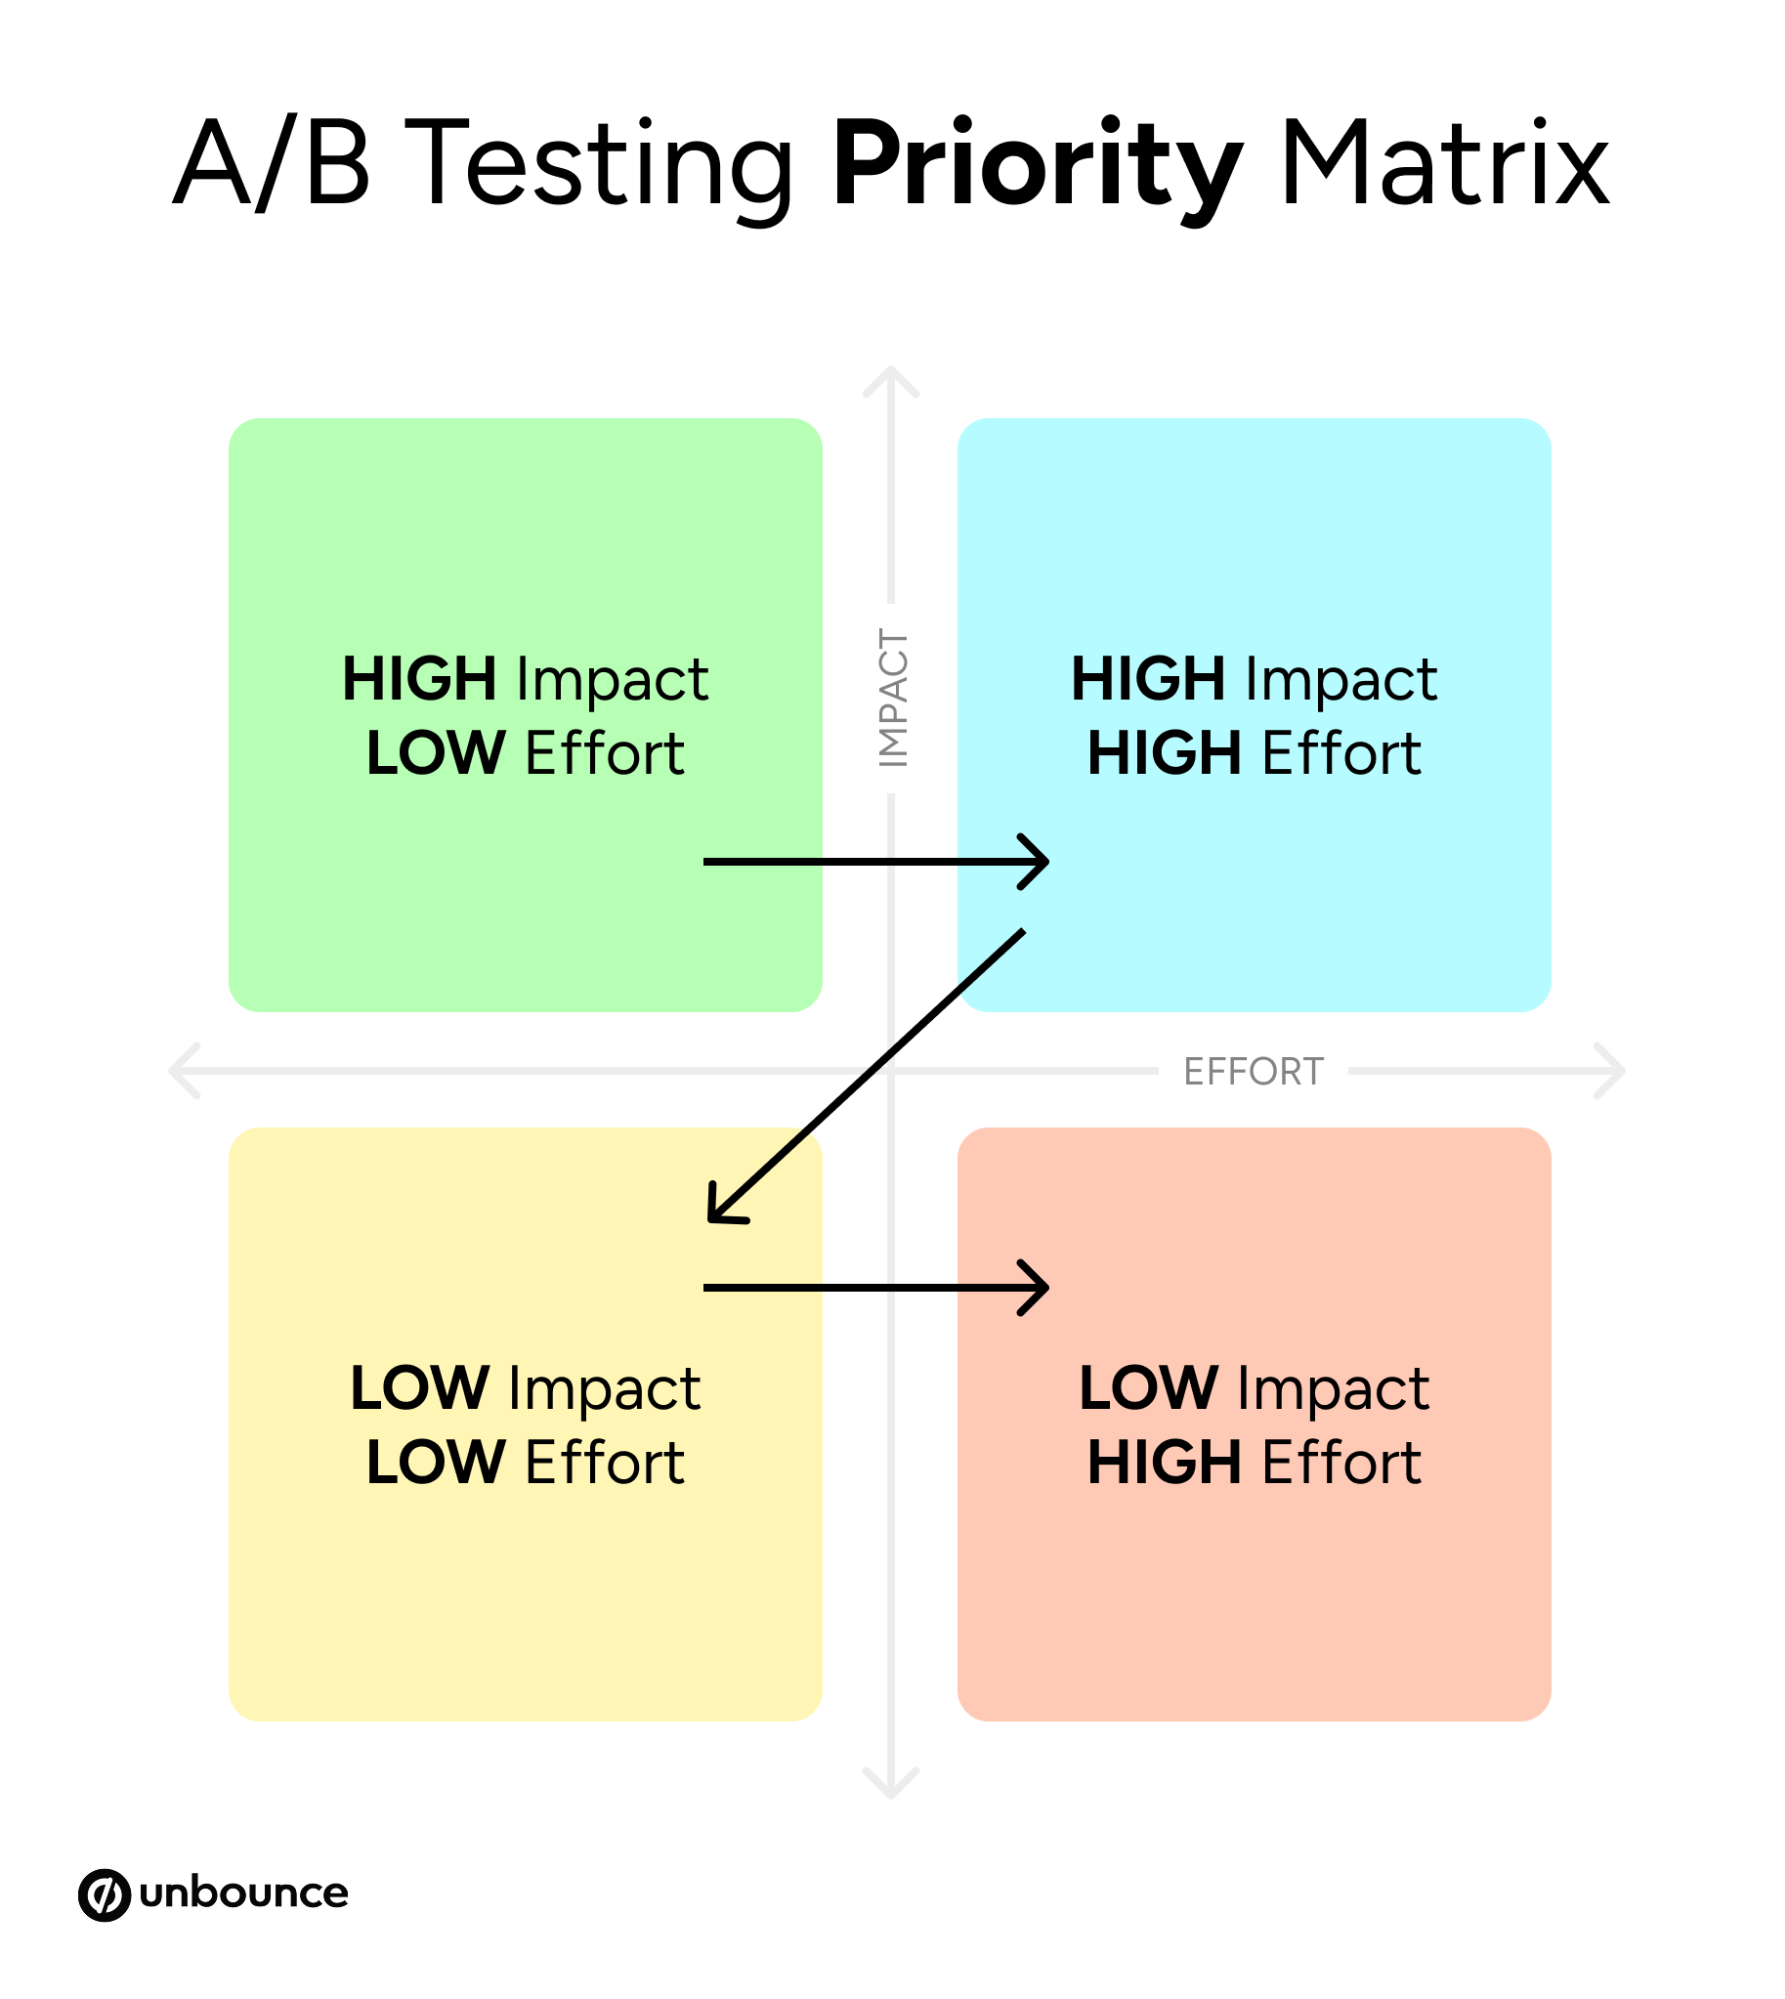
Prioritization: The 2×2 Matrix
You will likely have more test ideas than time. To prioritize, evaluate every idea based on two variables: Impact (how much will this move the needle?) and Ease of Implementation (how long will this take to build?).
- High Impact/Easy: Do these first.
- High Impact/Difficult: Build these into your roadmap.
- Low Impact/Easy: Use these for quick wins.
- Low Impact/Difficult: Discard these.
Statistical Rigor
Never declare a winner based on a few days of data. Statistical significance is the gatekeeper of your growth. Without it, you are likely reacting to random noise. Ensure your sample size is sufficient and that you are accounting for variables like seasonality or specific traffic surges. Remember: even a "losing" test is a win because it provides data on what doesn’t resonate with your audience, saving you from making the same mistake elsewhere on your site.
Implications: Building a Culture of Experimentation
The most successful companies do not treat CRO as a project; they treat it as a culture. When optimization becomes a habit, your team stops fearing failure and starts embracing the iterative process.
This creates a "flywheel" effect. The knowledge gained from a headline test on your homepage informs the layout of your landing pages, which in turn improves the conversion rate of your email sign-up forms. These incremental gains compound over time, leading to exponential growth.
In today’s competitive digital environment, relying on intuition is a liability. By adopting a systematic approach to measurement—defining outcome-focused goals, tracking micro-conversions, blending quantitative and qualitative insights, and maintaining rigorous testing standards—you move from being a marketer who hopes for results to one who engineers them.
The tools are available. The methodology is proven. The only remaining question is whether you are ready to stop guessing and start growing.