In the high-stakes world of digital marketing, where billions of dollars are allocated based on data-driven projections, the difference between a successful campaign and a fiscal disaster often hinges on a single concept: statistical certainty. For years, major advertising platforms like Google have provided advertisers with Brand Lift, Search Lift, and Conversion Lift studies to justify marketing spend.
However, a critical examination of Google’s own guidance reveals a troubling reality. While these platforms frame their data as sophisticated, actionable insights, a deeper look at the underlying mathematics suggests that the definition of “success” is heavily skewed in favor of the platform itself. For the advertiser—the one holding the purse strings—relying on these metrics without a rigorous internal standard can lead to a dangerous cycle of diminishing returns and misallocated capital.
The Mirage of "Directional Results"
The term "directional results" has become the industry’s favorite euphemism for data that is inconclusive, weak, or statistically noisy. It sounds professional, nuanced, and safe. But in practice, "directional" is a catch-all term that allows marketers to interpret data in any way that validates their existing strategy.
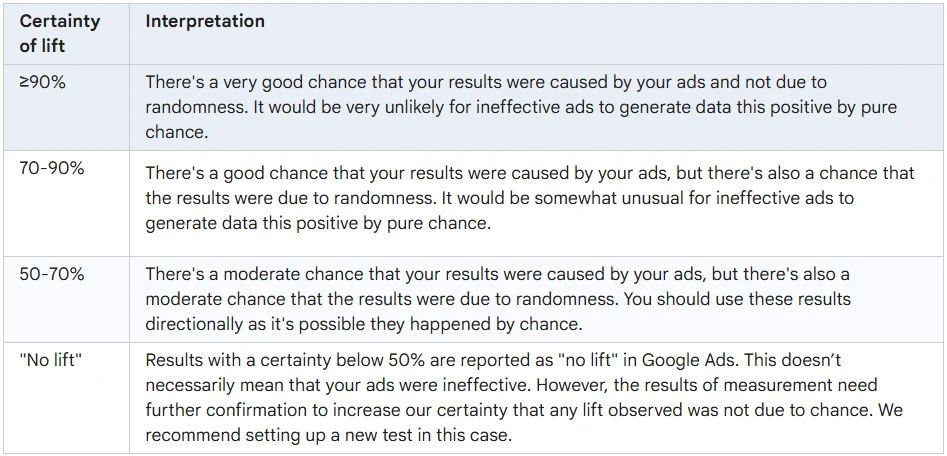
Google’s official documentation on interpreting lift studies classifies statistical certainty into tiers that should raise red flags for any senior financial decision-maker. According to Google, a 90% certainty rate is a "very good chance" of success, 70%–90% is a "good chance," and 50%–70% is a "moderate chance." Perhaps most alarmingly, Google explicitly suggests that studies hovering at 50% can still provide "valuable, directional insights."
When distilled, the message from the platform to the advertiser is essentially: Your ads probably did something useful. You might not have wasted your money, so go ahead and spend more to see if it happens again.
A Tale of Two Incentives: The Platform vs. The Advertiser
To understand why this discrepancy exists, we must look at the structural incentives of the two parties involved.
Party One: The Platform (Google)
Google is a publisher and an advertising marketplace. Its primary goal is to facilitate the flow of capital into its inventory. If a study provides weak evidence that a campaign performed well, the platform has no incentive to discard that data. In fact, keeping the advertiser hopeful—even with "suggestive" data—keeps the budget flowing. To Google, any data point that hints at efficacy is a win.
Party Two: The Advertiser (You)
The advertiser’s objective is fundamentally different. You are not searching for "interesting insights"; you are managing a company’s capital. Your primary business question is: Is the evidence strong enough to justify risking another $5 million of the company’s budget on the conclusion that the first $5 million was effective?
The disconnect is stark. Google provides the data, but it does not bear the consequences of an optimistic interpretation. If the second $5 million fails to produce a return, the loss belongs exclusively to the advertiser. By labeling uncertain results as "directional," the platform effectively shifts the burden of risk onto the client.
Chronology of a Statistical Trap
The process usually follows a predictable, recurring pattern:
- The Campaign Launch: A brand runs a substantial YouTube or Search campaign.
- The Lift Study: Upon conclusion, the platform provides a lift report showing, for example, a +3-point lift in brand consideration at a 70% certainty level.
- The "Good Chance" Narrative: The platform presents this as a "good chance" of success.
- The Pressure to Scale: Encouraged by the "directional" result, the marketing team asks the CFO for a budget increase for "Round Two."
- The Reality Gap: The campaign is repeated under identical conditions, but because the initial result was not statistically robust, the positive lift fails to replicate, resulting in a net loss of ROI.
This cycle is the embodiment of the phrase: "Heads Google wins, tails you lose."
The Math Behind the Risk: Why "Directional" is Dangerous
To determine whether a campaign is worth repeating, one must calculate "Replication Risk." This involves looking beyond simple p-values and asking: If we run this exact same experiment again, how likely are we to get a result strong enough to confidently tell the CFO that the investment worked?
Using a Bayesian replication model—a method favored by biostatisticians to ensure that clinical trial results are not flukes—we can quantify the likelihood of success in a second round of spending.
If a YouTube study reports a +3-point lift at 70% certainty, the math is sobering:
- Probability of any positive lift: Approximately 65%.
- Probability of hitting a 90% certainty threshold: A mere 30%.
- Replication Risk: A staggering 70%.
This means that if you rely on that 70% "good chance" label to justify a second $5 million spend, there is only a 30% chance you will see a result robust enough to justify the expenditure. In any other department of a business, a 70% chance of failure would be classified as a high-risk gamble, not a sound investment strategy.
Implications for Corporate Strategy
The implications of this statistical misalignment are profound. When corporations accept "directional" evidence as proof of performance, they effectively outsource their risk tolerance to the very entities they are paying.
1. The Cost of Type S and Type M Errors
Beyond the failure to replicate, weak evidence can lead to two other common errors:
- Type S (Sign) Errors: Where the study suggests a positive outcome, but the reality is a negative or zero-sum impact.
- Type M (Magnitude) Errors: Where the impact of the ad is significantly overstated.
Both errors lead to the over-allocation of resources toward channels that are not actually driving business value.
2. Standardizing the Threshold for Evidence
For consequential business decisions, a 90% certainty floor should be the minimum standard. While this does not eliminate risk—it still carries a 50% replication risk—it moves the needle significantly closer to a position of professional diligence. When budgets reach the millions, companies should push for 95% certainty, which statistically reduces the replication risk and increases the odds of confirming a positive return on investment.
3. The Need for Independent Validation
Marketing and analytics teams must stop relying solely on the "canned" reports provided by advertising platforms. These reports are designed to be user-friendly, not rigorous. Organizations should implement their own statistical frameworks to analyze raw data, or utilize third-party measurement partners who do not have a vested interest in the size of the advertising spend.
Conclusion: Take Control of Your Data
Google’s guidance is not necessarily malicious, but it is fundamentally self-serving. By providing comfort-inducing terminology like "moderate chance" and "directional insights," the platform creates a narrative that minimizes the perceived risk of continued spending.
However, the responsibility for financial stewardship remains with the business owner, not the publisher. If you are a CMO or a marketing lead, you must recognize that an advertising platform’s definition of "useful information" is not the same as your company’s definition of "sufficient evidence."
The next time a dashboard tells you that your campaign was a success based on a 70% certainty level, pause. Ask yourself: If I were spending my own money, would I take these odds? If the answer is no, then it is time to stop outsourcing your risk and start demanding a higher standard of proof.
Carpe diem—seize the day, and protect your budget.