In the hyper-competitive landscape of digital marketing, the term "conversion rate" is often treated as a singular, monolithic metric. Marketers frequently ask, "What is a good conversion rate?" hoping for a magic number they can use to validate their efforts. However, according to the latest insights from the 2024 Unbounce Conversion Benchmark Report, that approach is fundamentally flawed.
Based on an exhaustive analysis of 57 million conversions, 41,000 unique landing pages, and 464 million pageviews, the data suggests that conversion rates are not one-size-fits-all. Instead, they are highly sensitive to industry, audience behavior, and the specific intent behind a user’s click.

The Reality of Conversion Benchmarks
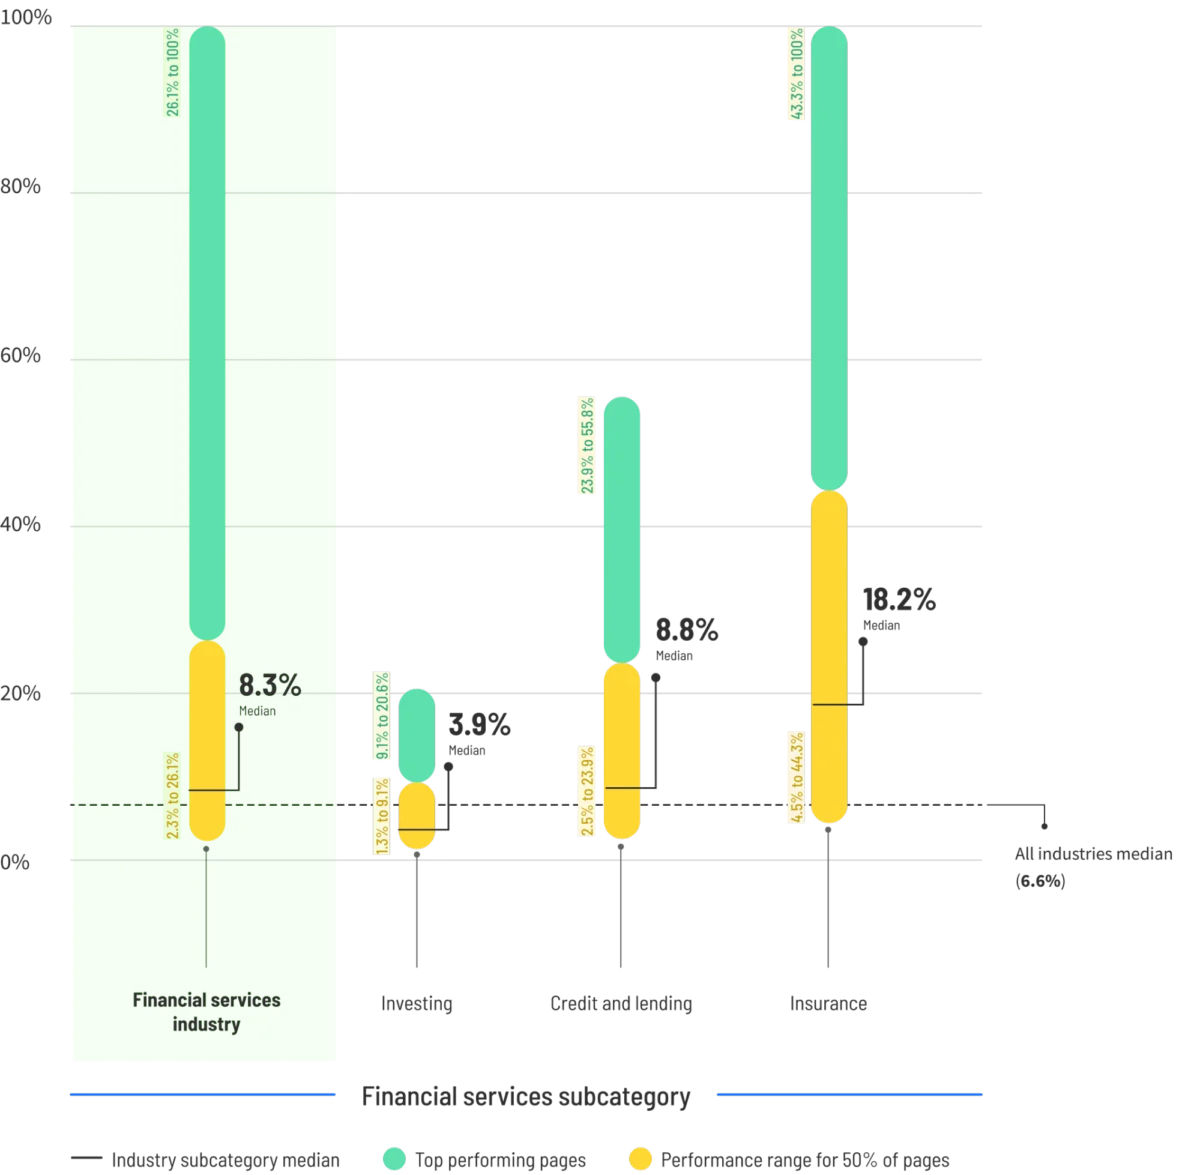
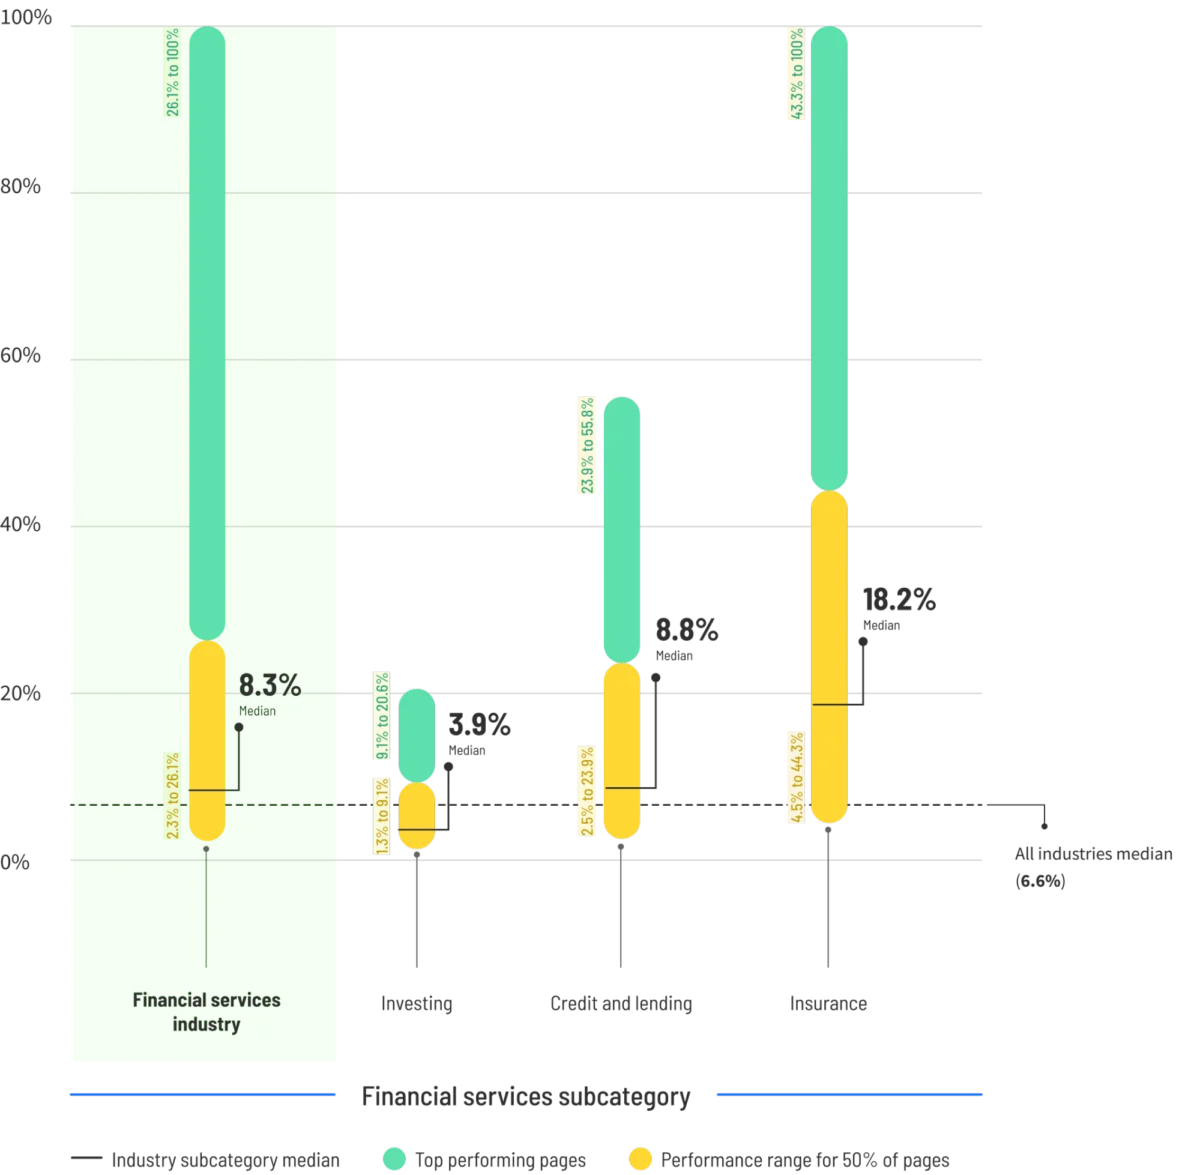
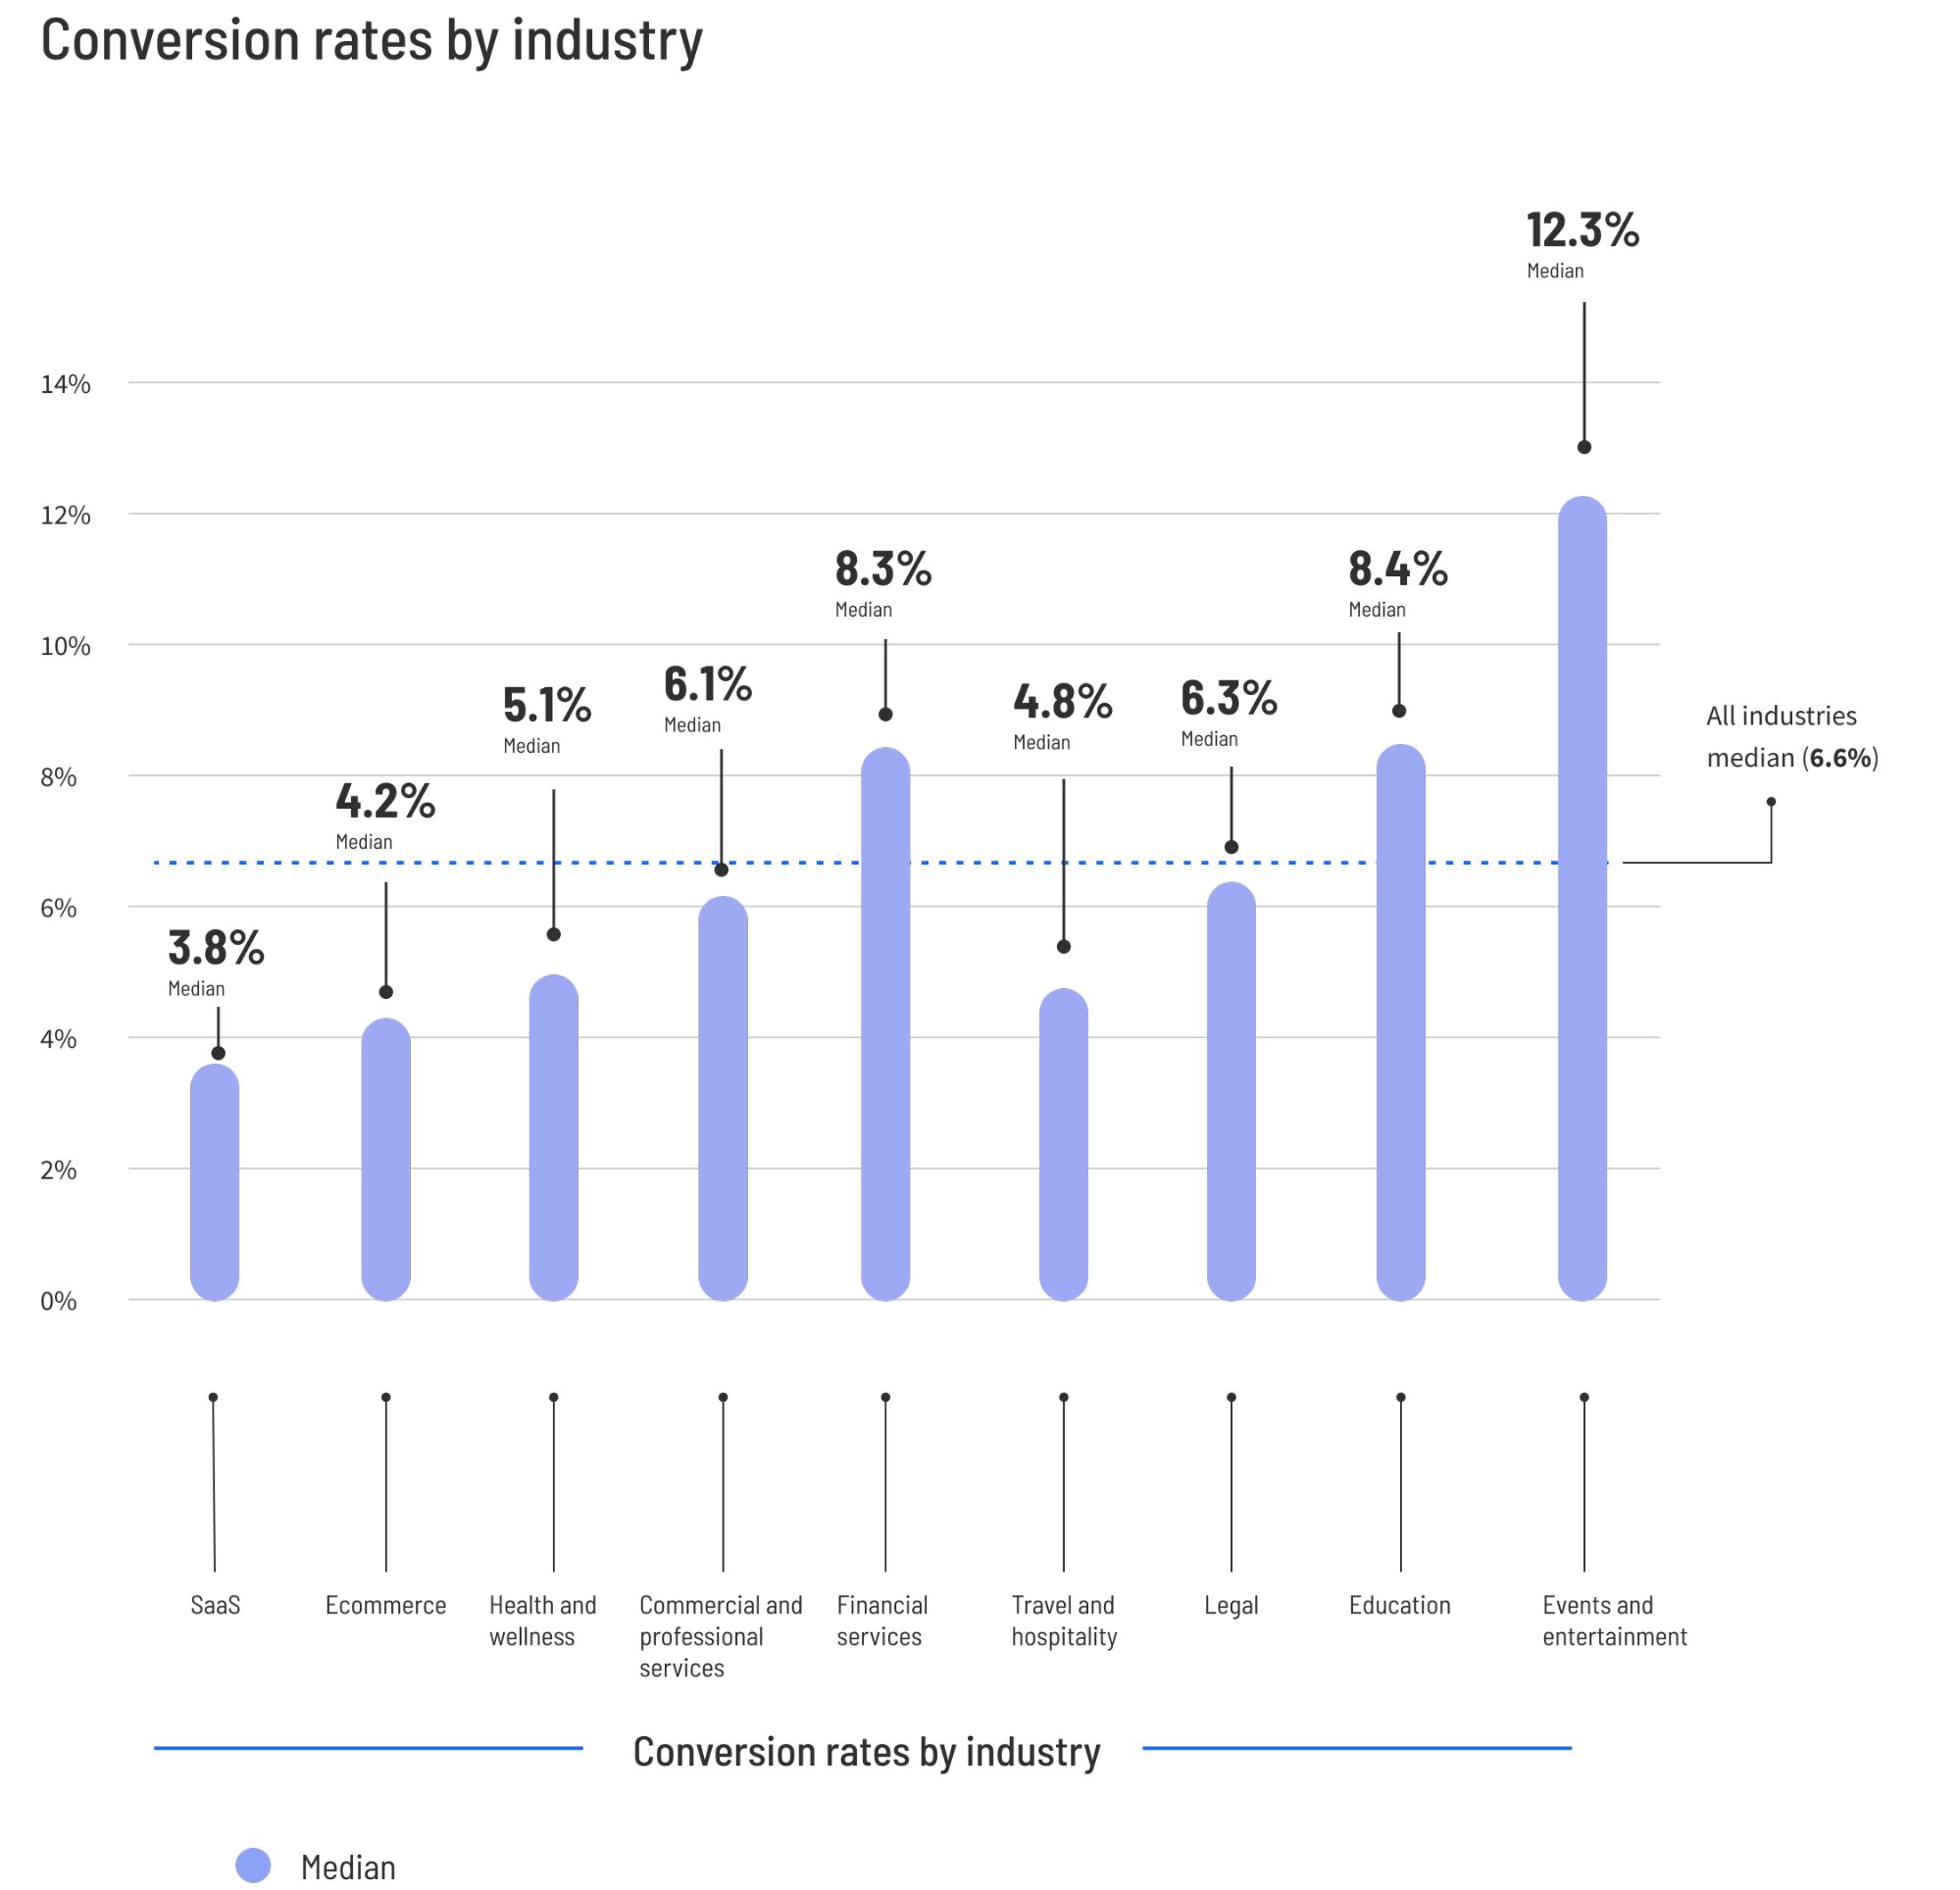
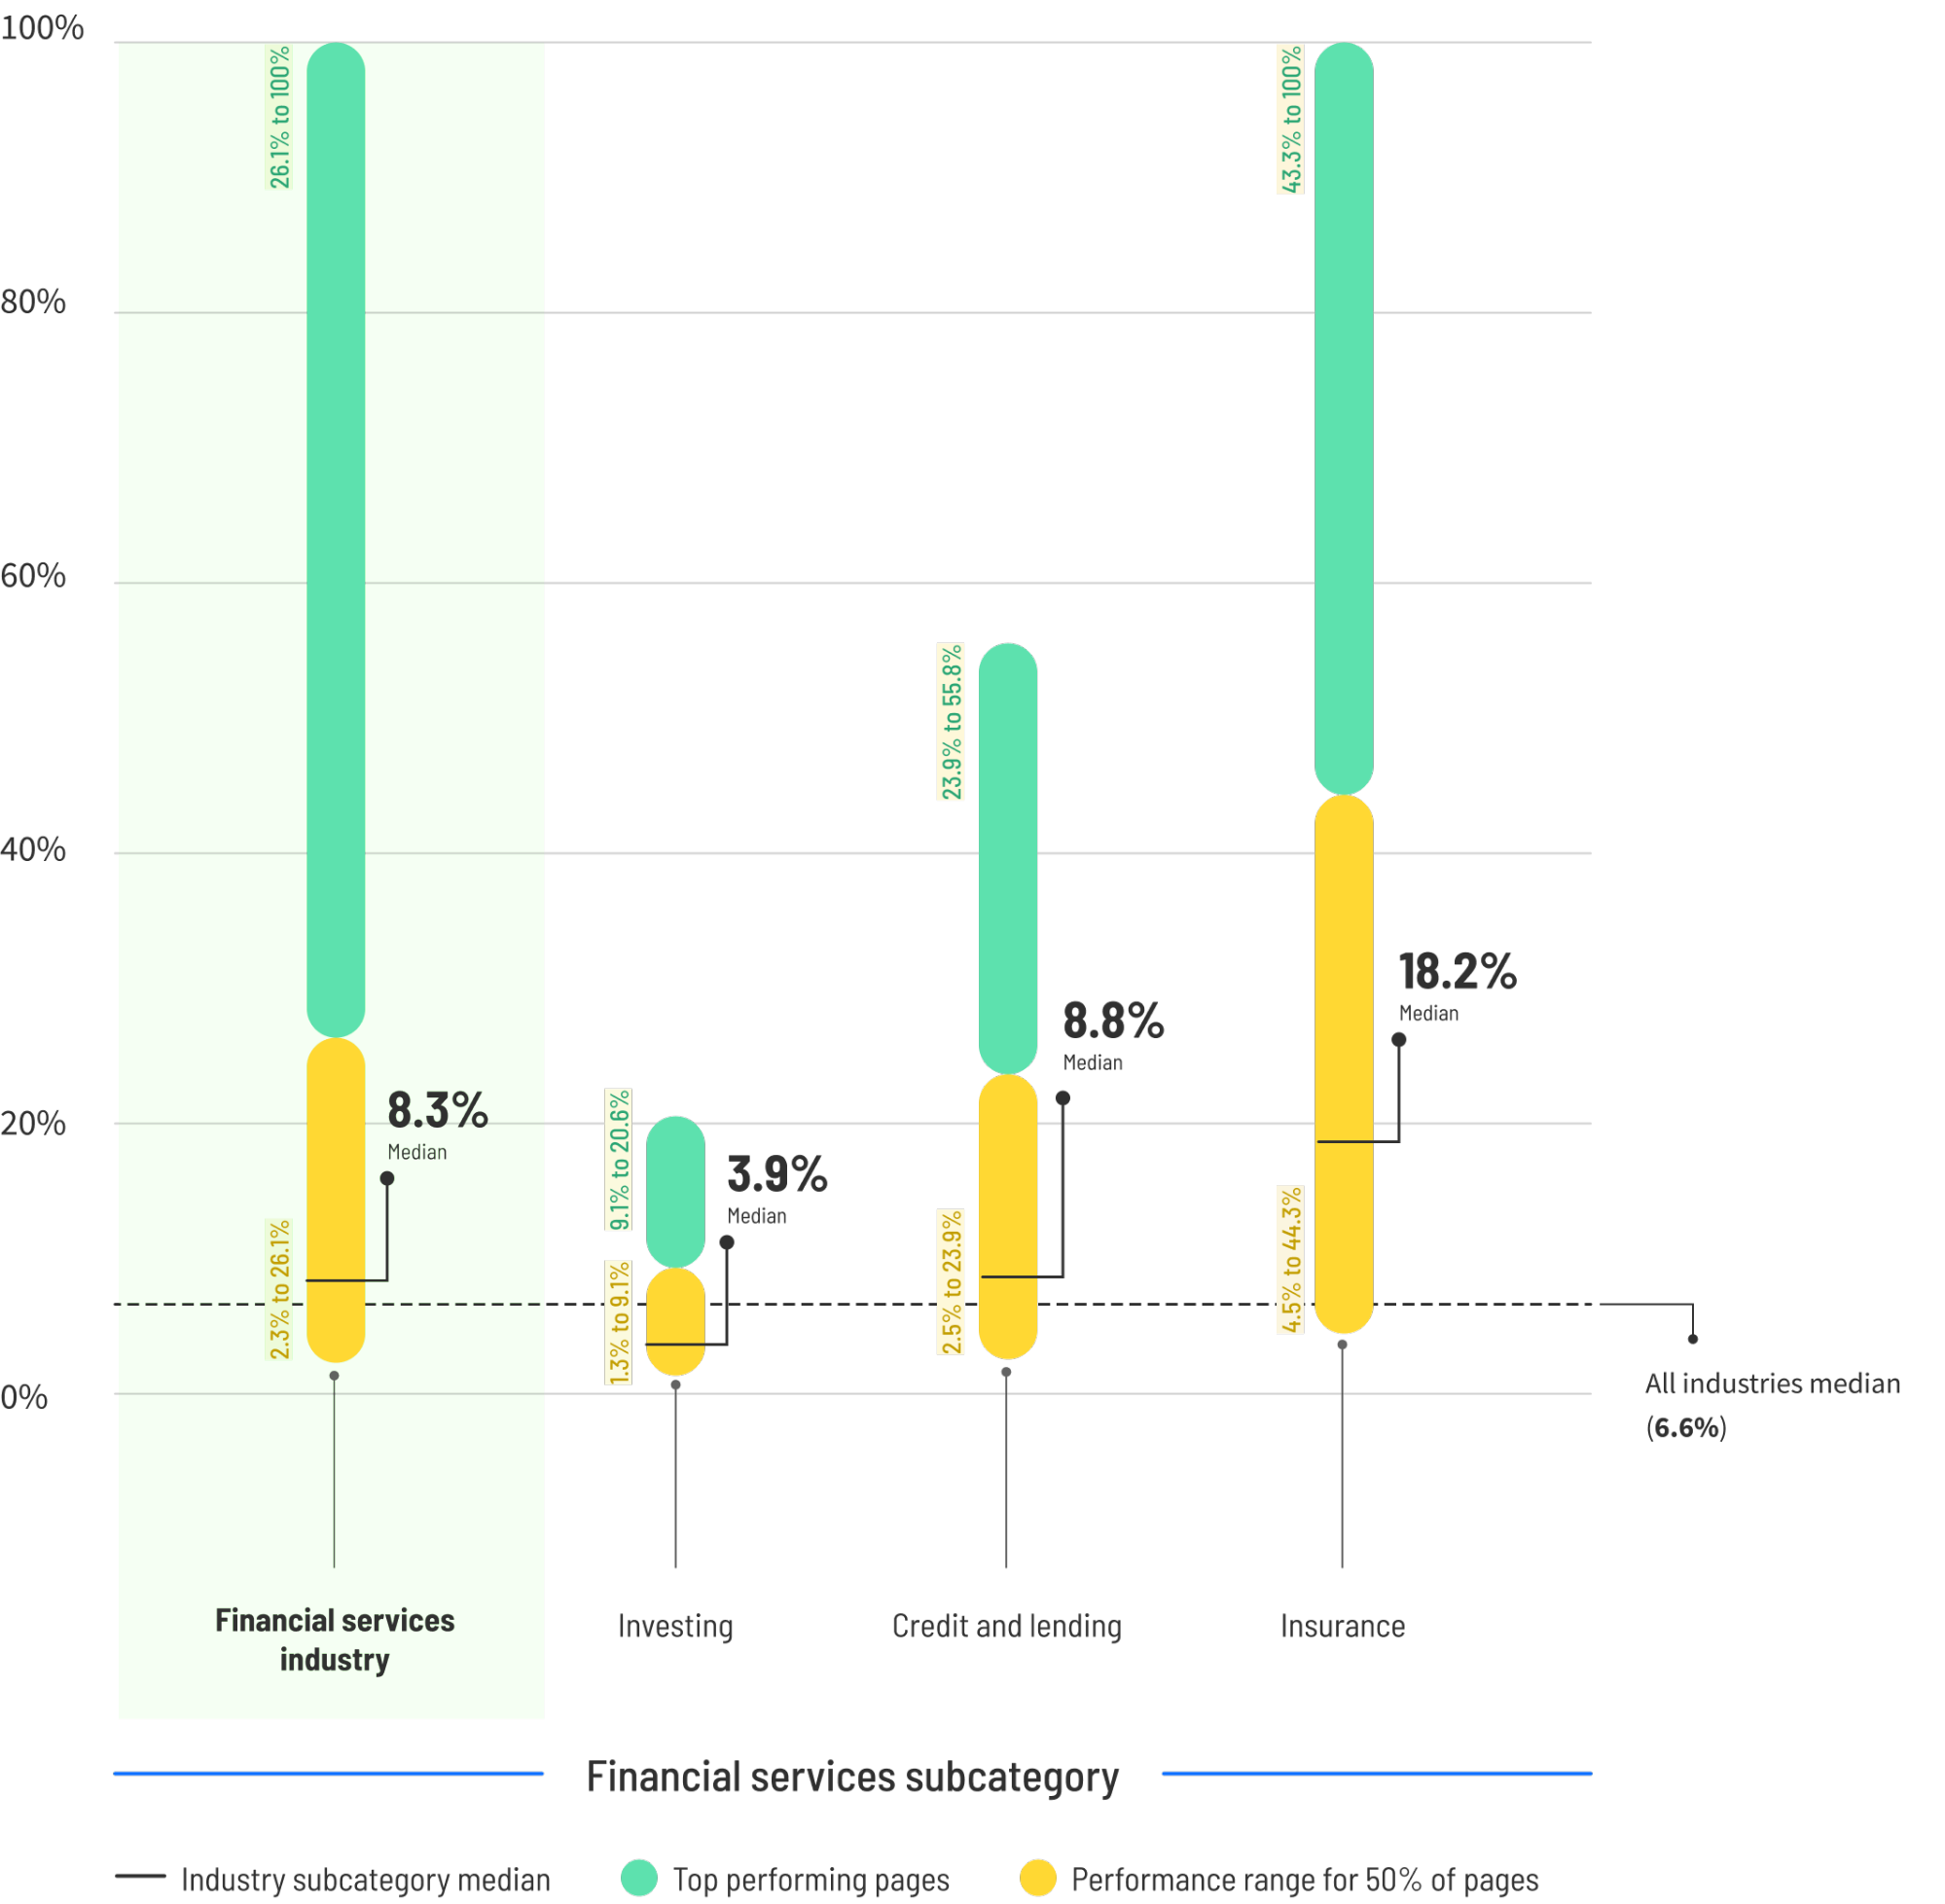
The median conversion rate across all industries currently sits at 6.6%. While this serves as a helpful "middle-of-the-pack" anchor, relying on it as a goal is akin to measuring the average height of all humans to determine if you are "tall." It provides a data point, but it lacks the necessary context to define true success.
True optimization, as emphasized by Josh Gallant of Backstage SEO, requires moving away from vanity metrics and toward industry-specific strategies. To understand where you truly stand, you must look at the 75th percentile—the "good" threshold. If you are converting at a rate higher than this, you have officially entered the top 25% of performers in your field.

A Comparative Look Across Major Industries
The divergence in conversion performance across industries is staggering, driven by differences in price point, urgency, and the complexity of the "ask."
Ecommerce: The Volume Game
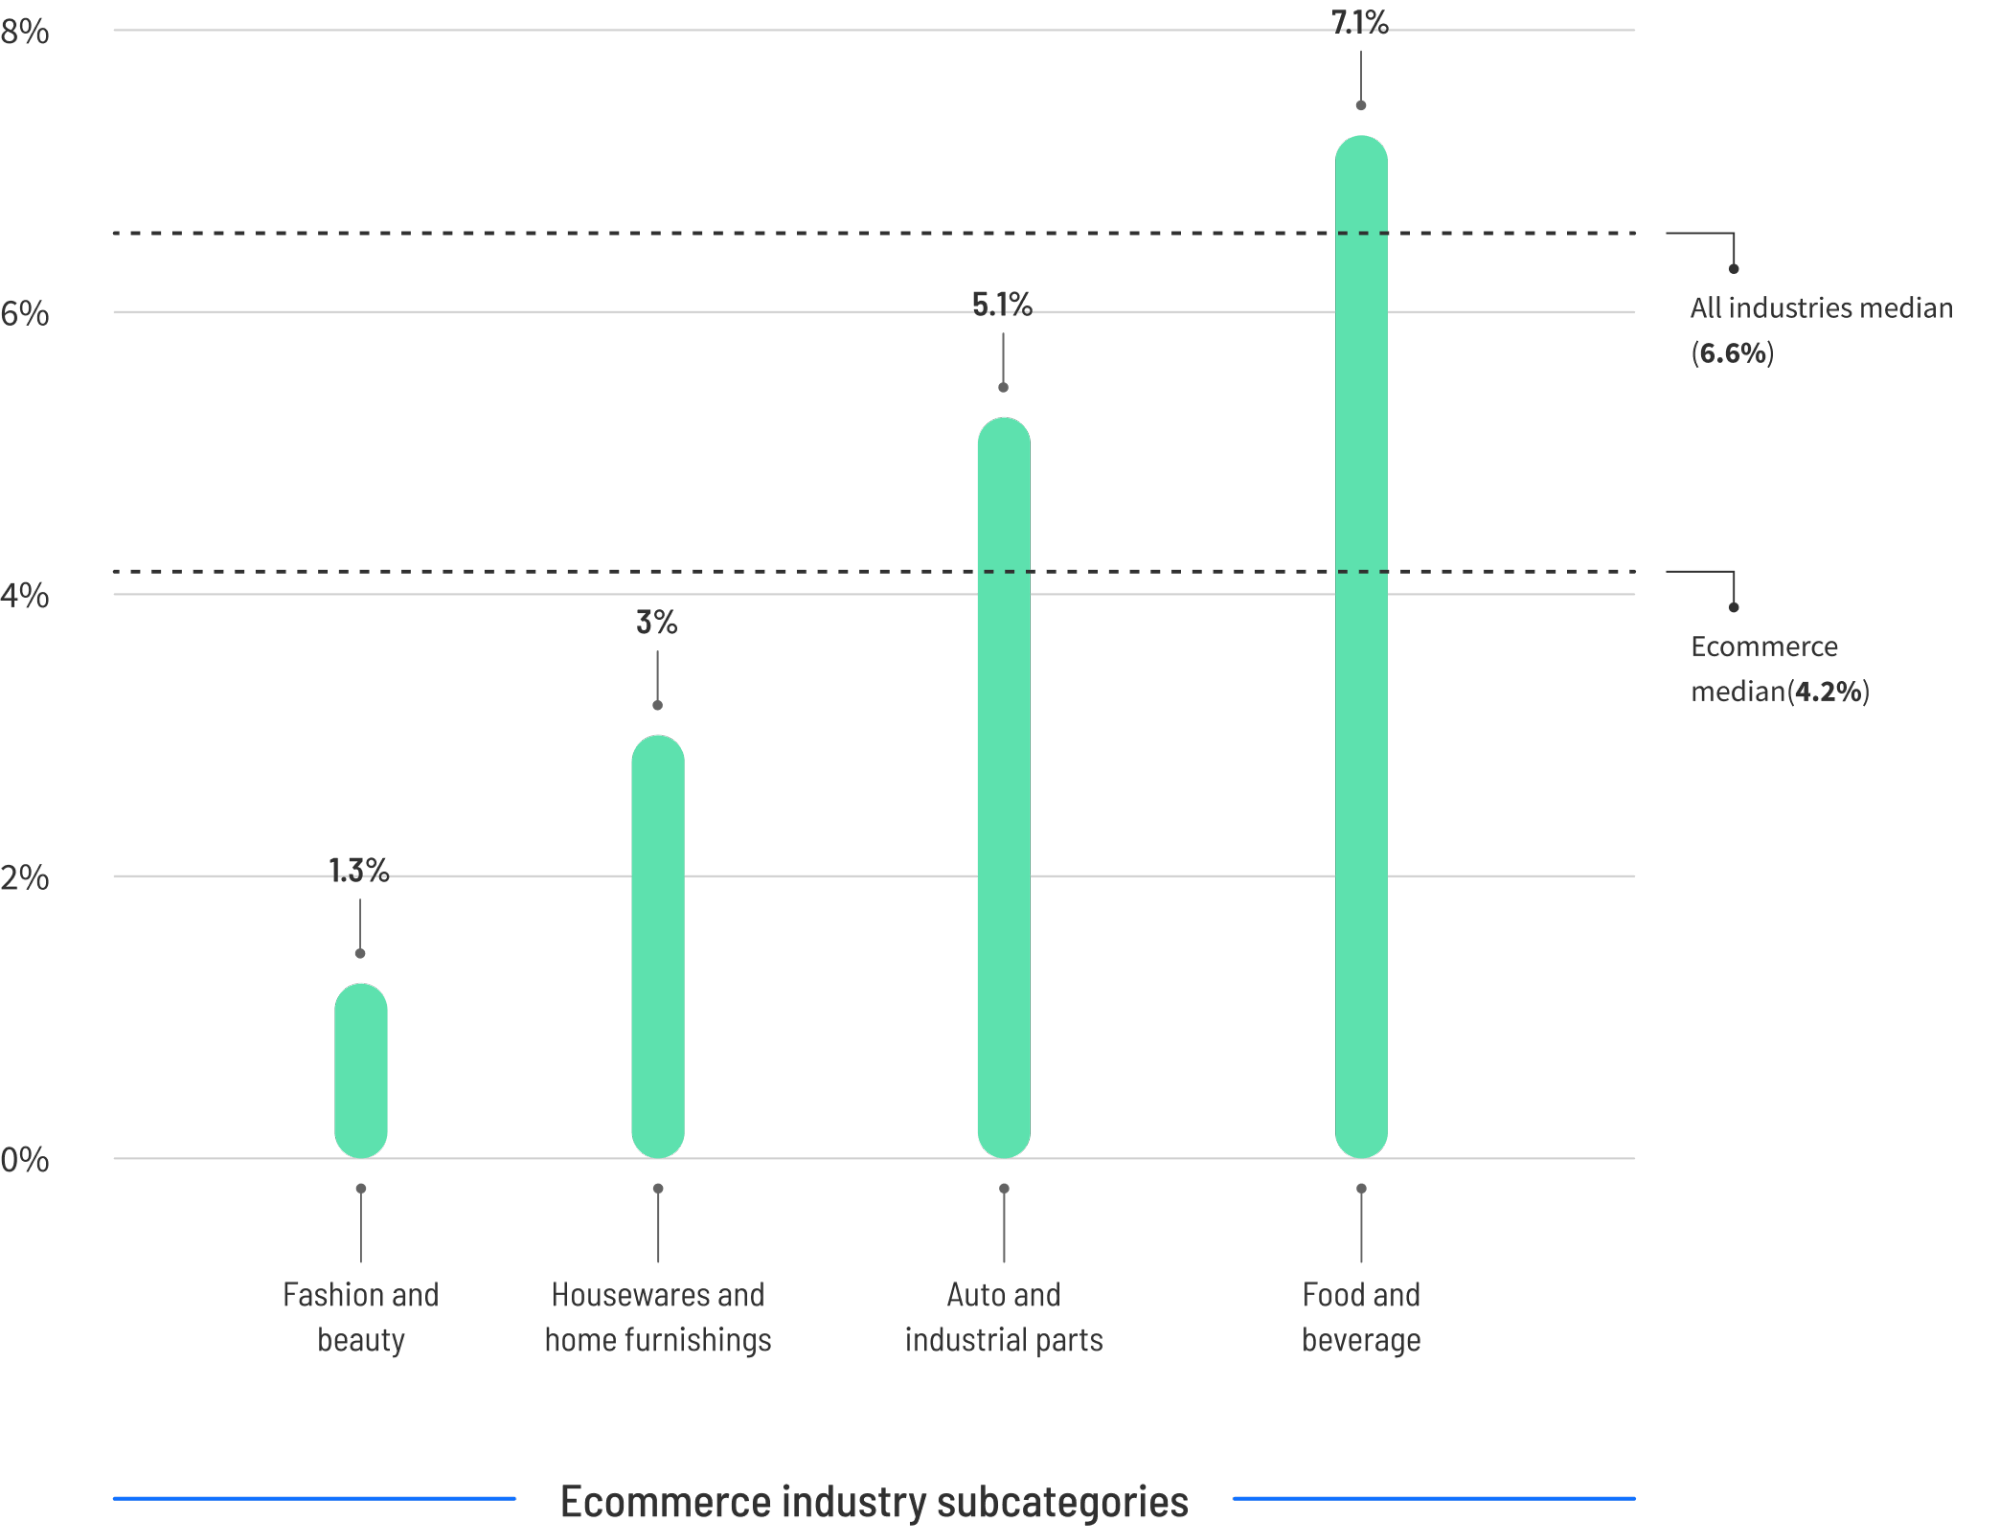
Ecommerce brands currently navigate a median conversion rate of 4.2%. However, the gap between the average and the elite is wide; the top 25% of performers see rates of 11.4% or higher. This delta represents significant revenue. For a store attracting 10,000 visitors monthly, the difference between the median and the top-tier benchmark could mean an additional 720 conversions, potentially resulting in tens of thousands of dollars in incremental monthly revenue.
SaaS: Navigating Complexity
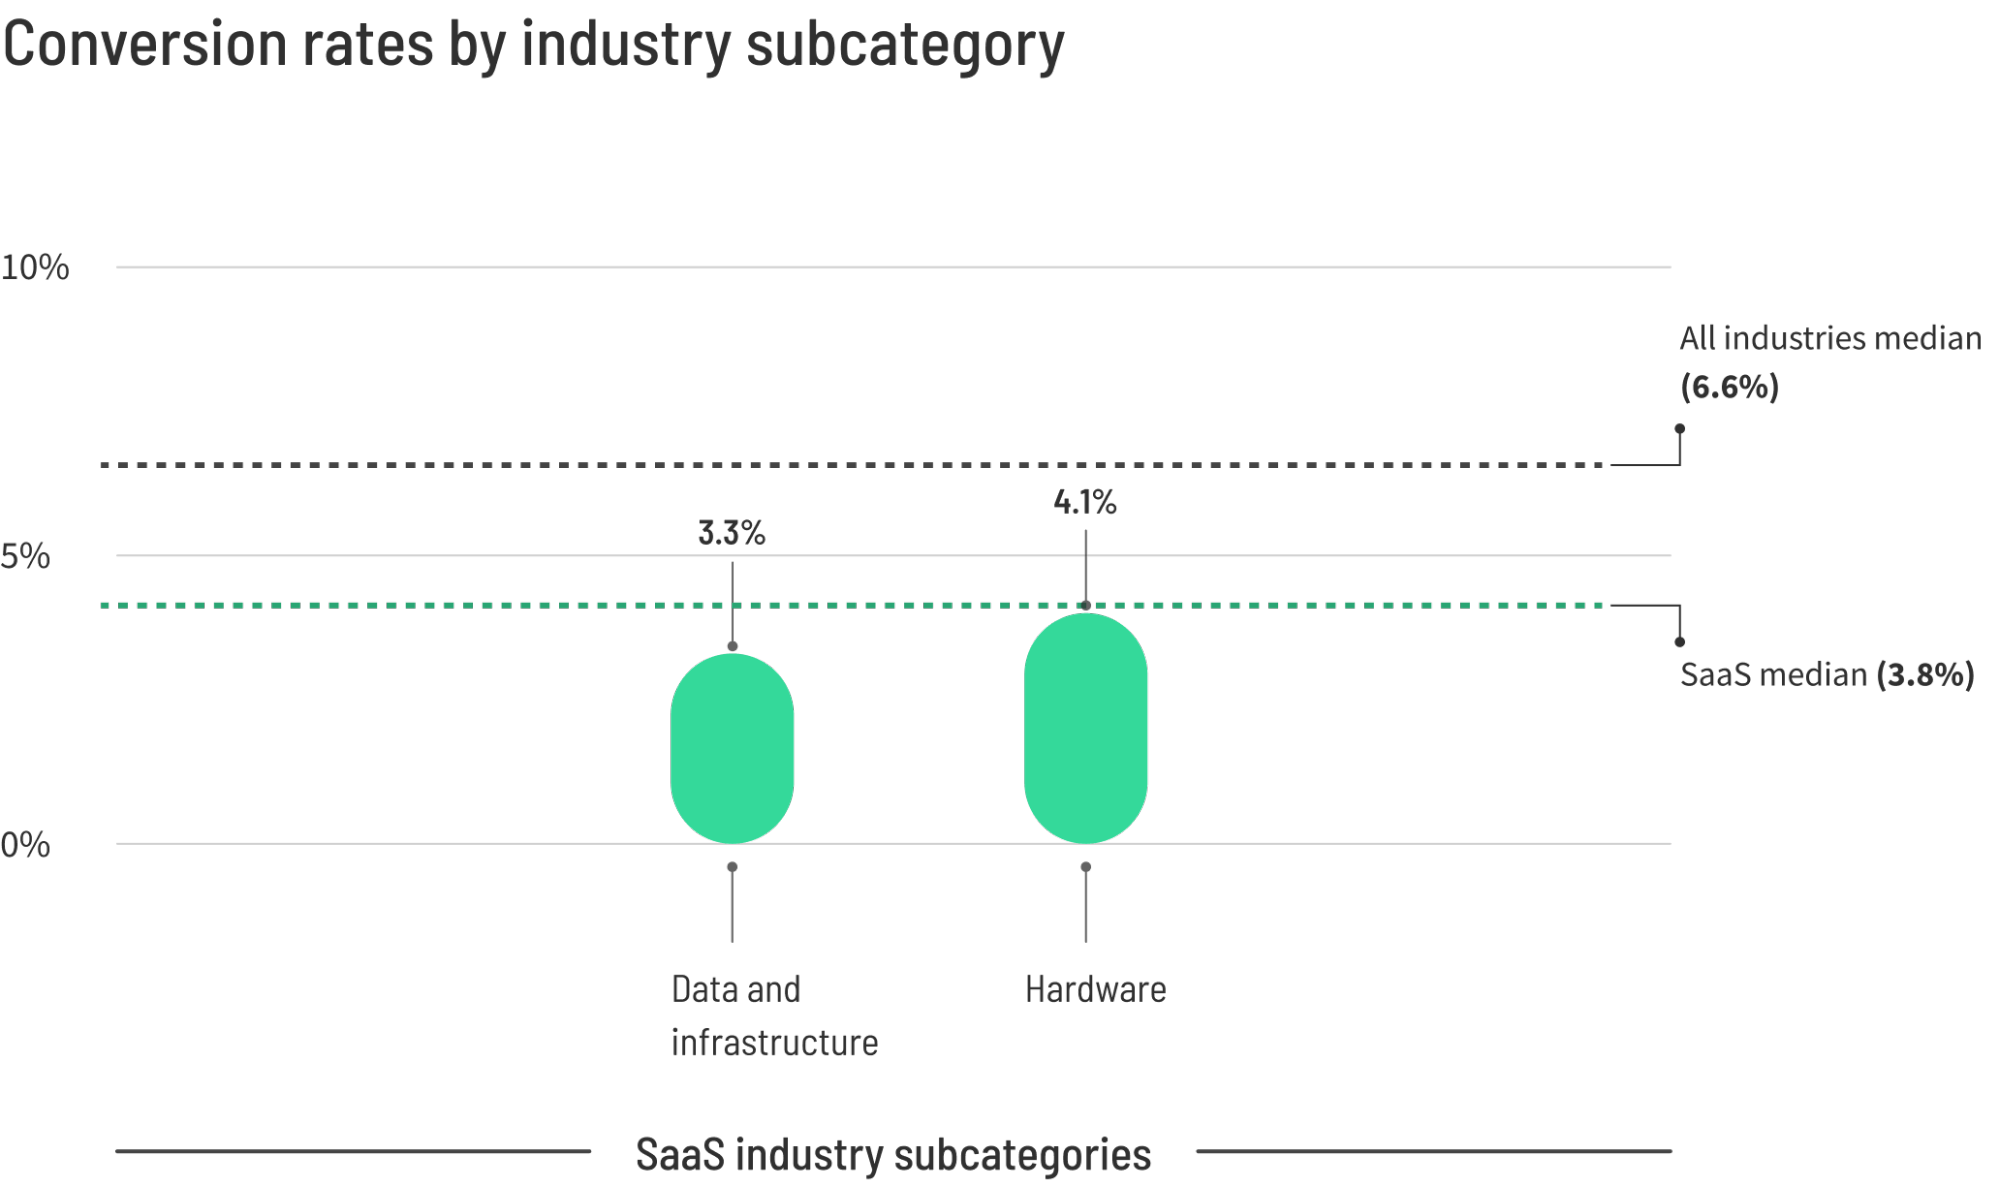
SaaS companies face a unique challenge, with a median conversion rate of 3.8%. Because SaaS products often involve longer sales cycles and varying degrees of buyer readiness, these pages must work harder to bridge the gap between "researching" and "signing up." To join the top 25% of SaaS performers, companies must aim for a conversion rate of 11.6% or higher, typically achieved by simplifying the barrier to entry—such as removing credit card requirements for free trials.
Professional Services: The Trust Factor
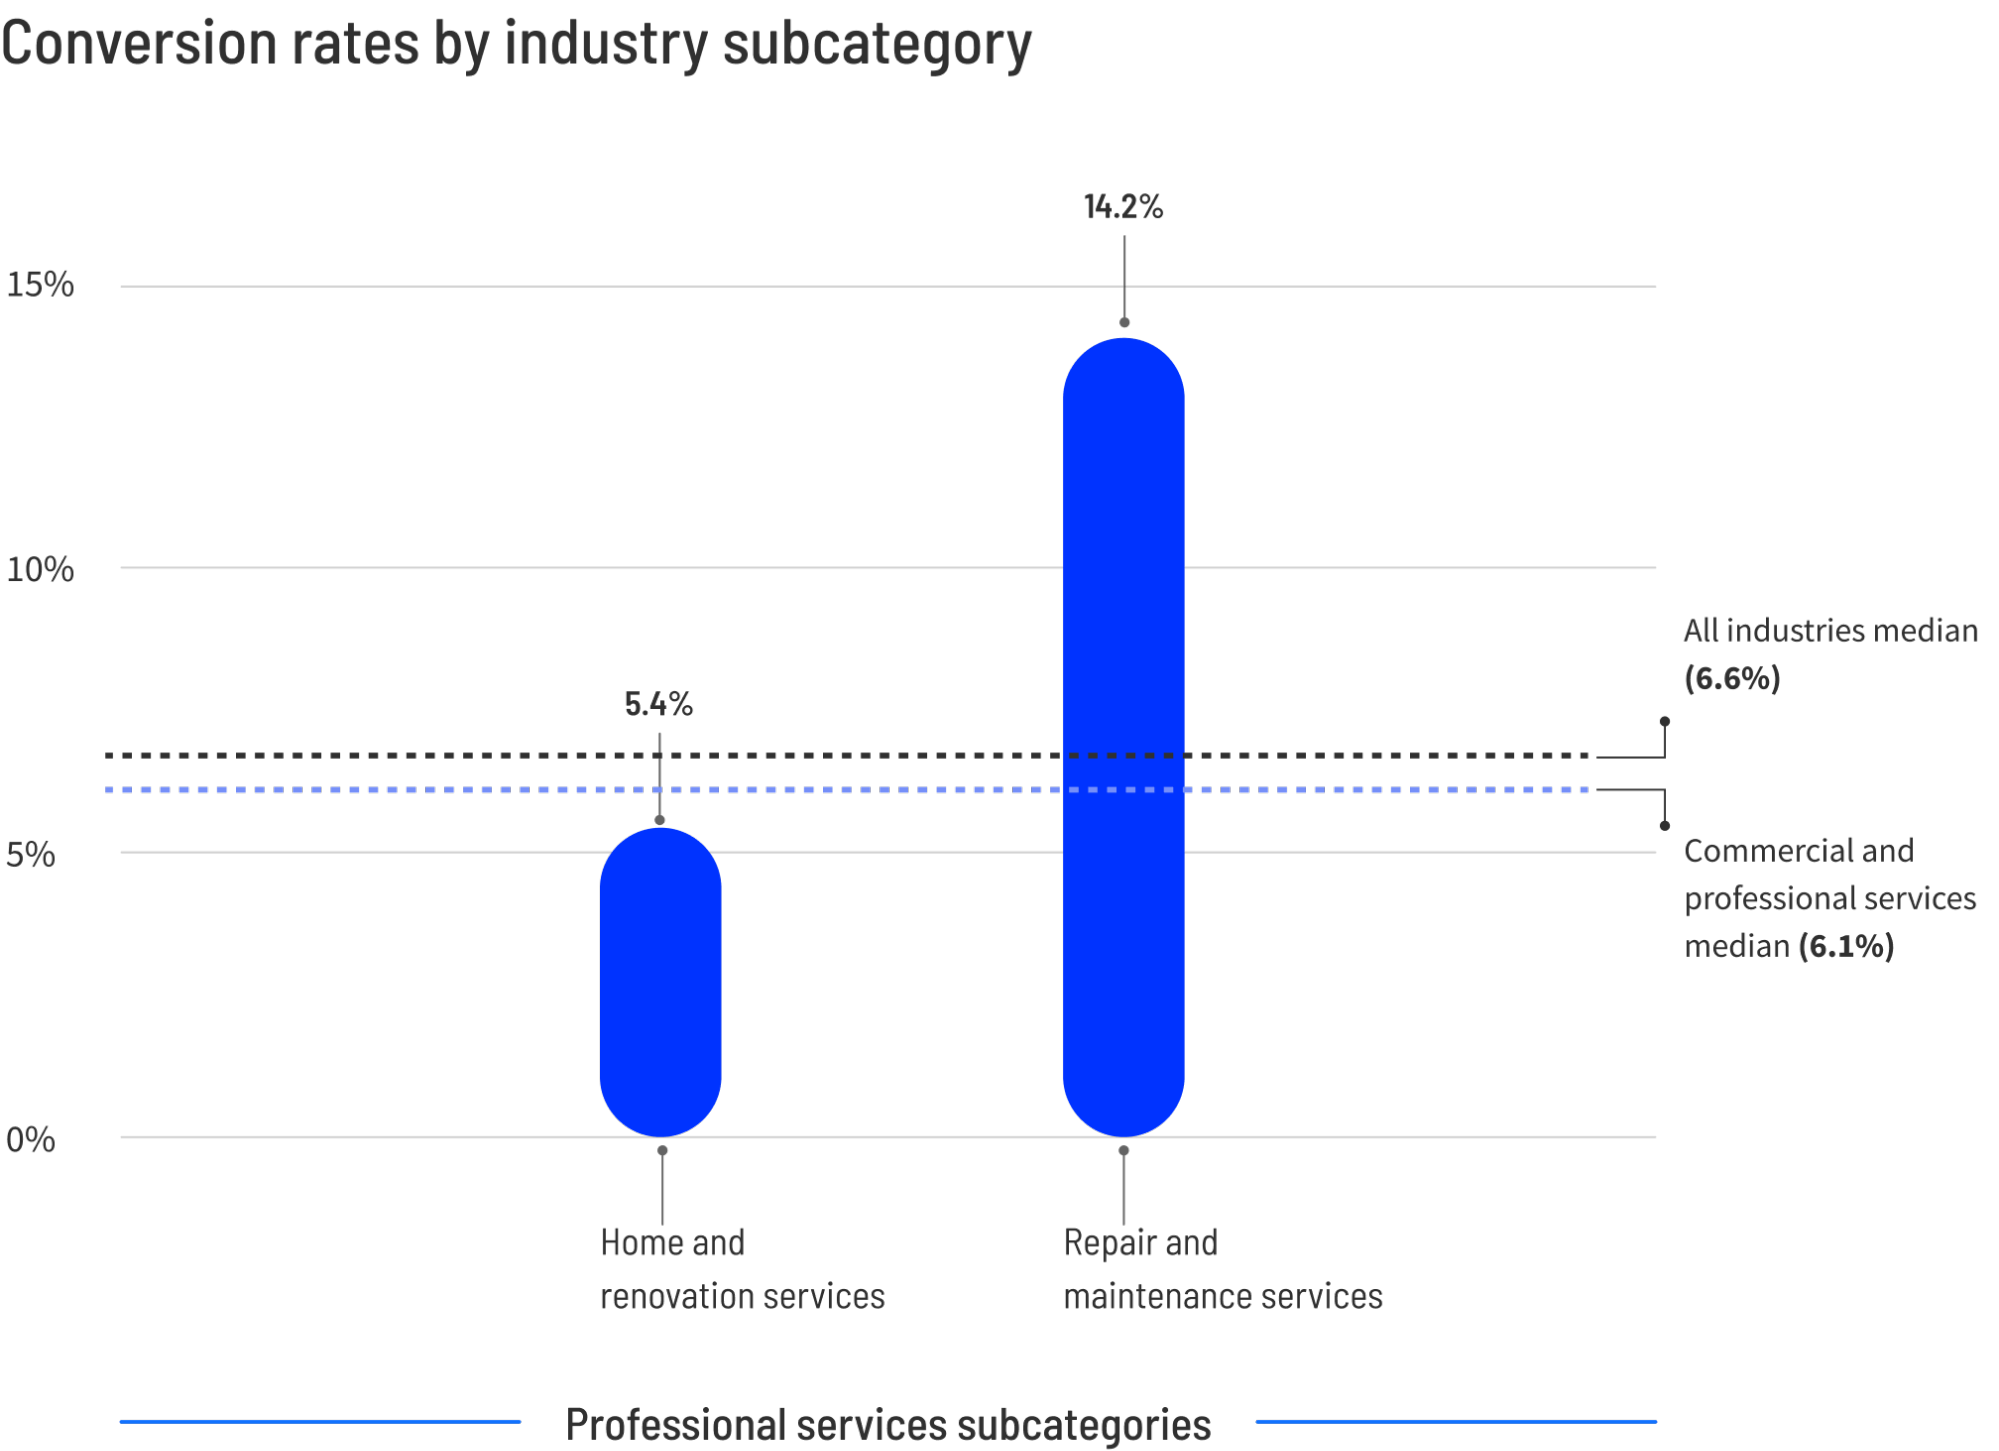
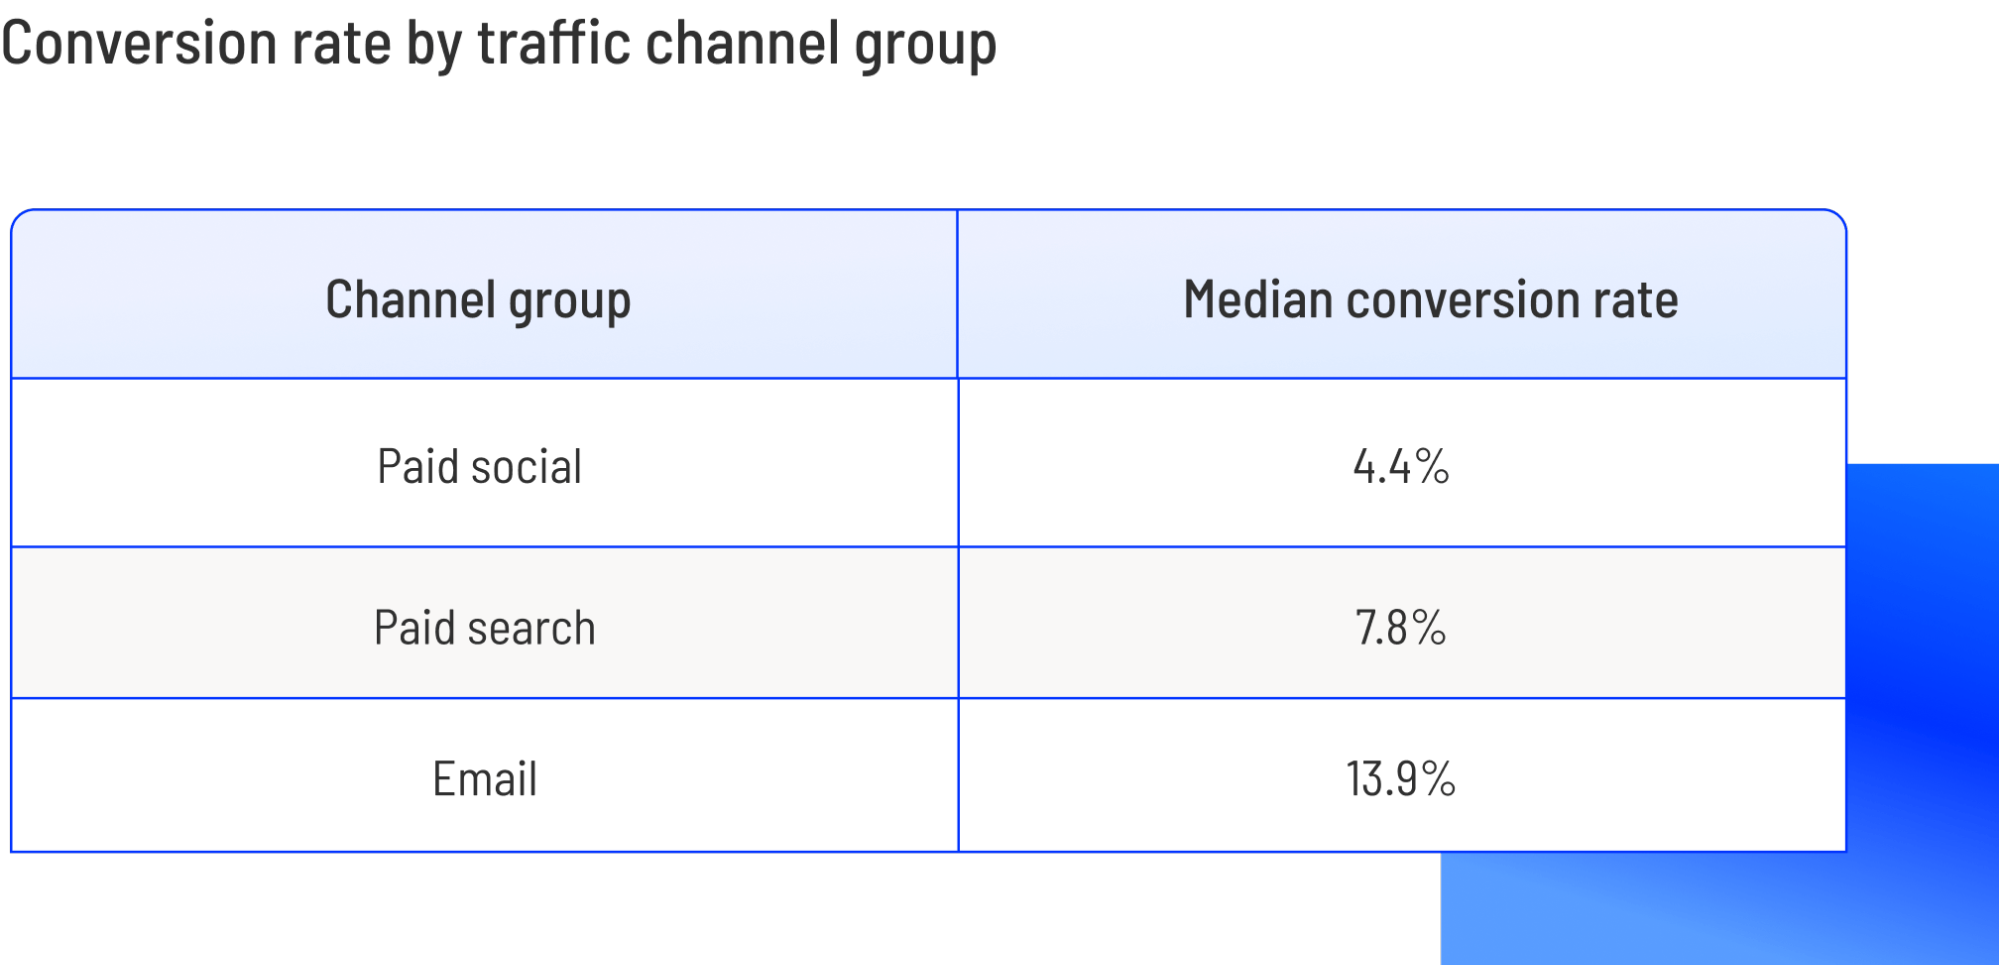
Professional services, ranging from law firms to consulting agencies, see a median of 6.1%. However, the top-tier threshold is 14.1%. In this sector, the source of traffic is critical. Data shows that email lists—comprised of warm leads—convert at nearly 14%, while paid social efforts often struggle to break 4.5%.
Financial Services: High Intent, High Stakes
Perhaps one of the most interesting findings is in the financial sector, where the median is 8.3%. Unlike other sectors, financial services see a massive performance boost from mobile traffic—27.8% higher than desktop—suggesting that users are often making critical financial decisions on the go.
Education and Entertainment: The Power of Urgency
Education and entertainment represent the highest performers in the benchmark study. Online courses, for instance, boast an 18.3% median, with top-tier performers hitting 20%. Entertainment, led by high-volume sweepstakes pages, can see conversion rates as high as 40.8% for the top 25%. These figures highlight that when the "ask" is low-friction or solves an immediate, painful problem, conversion rates naturally soar.
Chronology of Optimization: From Baseline to Breakthrough
Conversion rate optimization (CRO) is not a static event; it is an iterative process that requires a systematic approach.
- The Discovery Phase: Marketers start by establishing a baseline. By comparing their current performance against industry medians, they identify whether they are underperforming or simply hitting the expected ceiling for their category.
- The Hypothesis Phase: Once the baseline is established, teams look for the "gap." They analyze traffic sources—such as the stark difference between email and paid search—and identify which channels are providing the highest intent.
- The Testing Phase: High-performing organizations move into a cycle of constant A/B testing. They test single variables—copy, button color, or form length—to determine what specifically drives the lift.
- The Refinement Phase: Finally, successful brands implement "Smart Traffic" or automated routing, ensuring that each visitor is directed to the page variation most likely to result in a conversion based on their unique behavior.
The Science of "Good" Copy and User Experience
The report provides clear, data-backed guidance on the structural elements that move the needle:
- Reading Ease: Perhaps counter-intuitively, simpler is better. Content written at a 5th-7th grade reading level converts at 11.1%—a 56% improvement over content written for an 8th-9th grade audience.
- Mobile-First Reality: With 83% of traffic arriving on mobile devices, any friction in the mobile experience is a direct revenue leak. Top-performing sites treat mobile as the primary storefront, ensuring that forms are optimized for small screens and load times are near-instant.
- The "Distraction-Free" Rule: Every link that does not lead to the desired conversion—be it a navigation menu or an unrelated social media button—is a potential exit point. High-converting pages act as "destination" pages, stripping away all auxiliary links to focus the user entirely on the primary Call to Action (CTA).
Implications for Future Marketing Strategies
The primary implication of this data is that "best practices" are a trap. What works for a sweepstakes page in the entertainment industry will likely fail for a B2B SaaS company.
Marketers must shift their focus from generic industry advice to internal, data-driven experimentation. The goal is no longer to hit a mythical "good" number, but to maximize the return on every dollar of ad spend by systematically removing friction from the user journey.
Furthermore, the data underscores the importance of Intent Matching. If a user arrives from a search query like "emergency lawyer near me," the page must immediately acknowledge that urgency. If a user arrives from a long-form educational blog post, the page should offer a low-friction resource to continue the relationship.
Conclusion: The Path Forward
The gap between the average and the elite is not the result of magic or luck; it is the result of rigorous discipline. The most successful organizations in 2025 will be those that treat their landing pages as living, breathing assets that are constantly subjected to testing.
By prioritizing clarity over complexity, matching the offer to the intent of the visitor, and using industry-specific benchmarks as a compass rather than a cage, marketers can consistently scale their conversion rates. Whether you are currently at 2% or 10%, the data is clear: there is always a higher threshold to reach. The question is no longer "what is a good conversion rate," but "how much more can we learn from our next test?"